Attributes like natural abundance of over 99.9% and a high gyromagnetic ratio help in the characterization of protons. Thanks to these attributes, a greater detection sensitivity than those of 15N or 13C is obtained which makes 1H-detected NMR spectroscopy extremely attractive, and not only for solution NMR.[1-6]
In soluble samples, molecular tumbling cancels out unwanted dipolar couplings, but this feature is not present in insoluble molecules. Therefore, the linewidth of any 1H signal-to-noise ratio in solid-state NMR can be broadened by a powerful network of homonuclear proton dipolar couplings.
This barrier can be particularly resolved by two methods:
- using perdeuteration-reprotonation, sample is prepared by diluting the dense network of protons[1-3]
- using high magic angle spinning (MAS) speeds in the order of 60 to 111 kHz, as shown in Figure 1 [3,5]
Bruker BioSpin, together with Guido Pintacuda and co-workers, provides three fundamental 1H-detected pulse programs (‘pulprog’) that enable initial assignment of protein backbone under fast MAS[3]:
![(A) 2D 1H-detected hNH spectrum (blue) of a u-[13C,15N]-labeled and 100% 1H-back-exchanged SSB sample recorded within 30 min on a Bruker 1GHz spectrometer at 111 kHz MAS (Bruker 0.7 mm probe). (B) 2D 1H-detected hCαNH spectrum (red) of ubiquitin (same labeling scheme) recorded within 65 min on a Bruker 600 MHz spectrometer at 60 kHz MAS.](https://d2jx2rerrg6sh3.cloudfront.net/image-handler/picture/2017/8/figure_1.jpg)
Figure 1. (A) 2D 1H-detected hNH spectrum (blue) of a u-[13C,15N]-labeled and 100% 1H-back-exchanged SSB sample recorded within 30 min on a Bruker 1GHz spectrometer at 111 kHz MAS (Bruker 0.7 mm probe). (B) 2D 1H-detected hCαNH spectrum (red) of ubiquitin (same labeling scheme) recorded within 65 min on a Bruker 600 MHz spectrometer at 60 kHz MAS.
1. hNH: 1D and 2D, Figures 1A and 3, pulprog: hNH2D.dcp
2. hCαNH: 1D-3D, Figures 1B and 4, pulprog: hCaNH3D.tcp
3. hCONH: 1D-3D, Figures 4 and 6B, pulprog: hCONH3D.tcp
1H dipolar couplings can be typically in the order of several tens of kHz based on the properties of sample. If the MAS rate is higher, the unwanted 1H dipolar couplings will be more attenuated, as shown in Figure 2, black. This leads to highly resolved 1H signals and allows using polarization transfer through scalar couplings[7], as indicated in Figure 2, orange.
Solid-state NMR was traditionally used to moderate MAS rates of ≤25 kHz through probe designs, but thanks to latest advancements there have been a paradigm shift towards compact rotor sizes, for instance the Bruker 0.7, 1.3 and 1.9 mm H/C/N probes enable the use of fast (40-60 kHz) as well as ultra-fast (60-111 kHz) MAS.[3,5]
Within such conditions, there is efficient low power irradiation for heteronuclear decoupling as well as selective heteronuclear cross polarization (CP)[8], which reduces sample heating caused by RF irradiation.
1H dipolar couplings can also be reduced by targeting the dilution of the thick 1H network.[1] While preparing samples, the target protein is expressed in a perdeuterated growth medium. On subsequent incubation of the sample with a defined 2H2O:1H2O buffer, amine, amide, and hydroxyl groups, which are exchangeable sites, will experience a deuteron to proton back-exchange.
The 1H network can be robustly diluted based on the 2H:1H ratio – for instance back-exchange of 10 to 20%[2,4,6] – or completely reprotonated at all the exchangeable sites[1,3,5]. However, even with a complete back-exchange, the sample is still diluted because of the presence of deuterons at non-exchangeable sites.
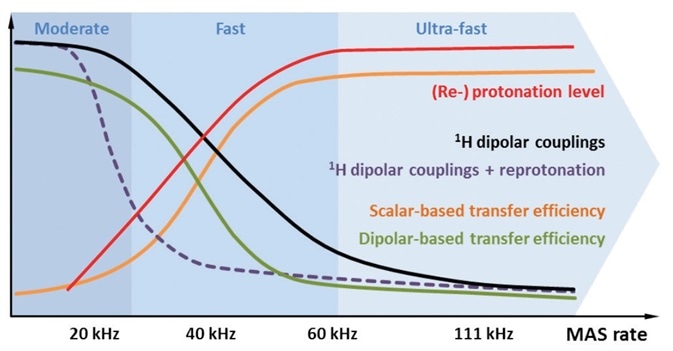
Figure 2. Schematic illustration of different aspects of protonation (red) and MAS respectively. In proportion to the MAS rate and/or reprotonation level, spectral resolution increases and longer-lived 13C coherences allow the use of homonuclear scalar coupling-based polarization transfers (orange). Dipolar coupling-mediated transfer starts to become inefficient at MAS rates ≥20 kHz, due to averaging effects (green). Using strongly deuterated samples, 1H dipolar couplings are already effectively attenuated at moderate MAS rates (purple). Under fast to ultra-fast rates, MAS averages out 1H dipolar couplings efficiently, even in fully protonated samples (black).
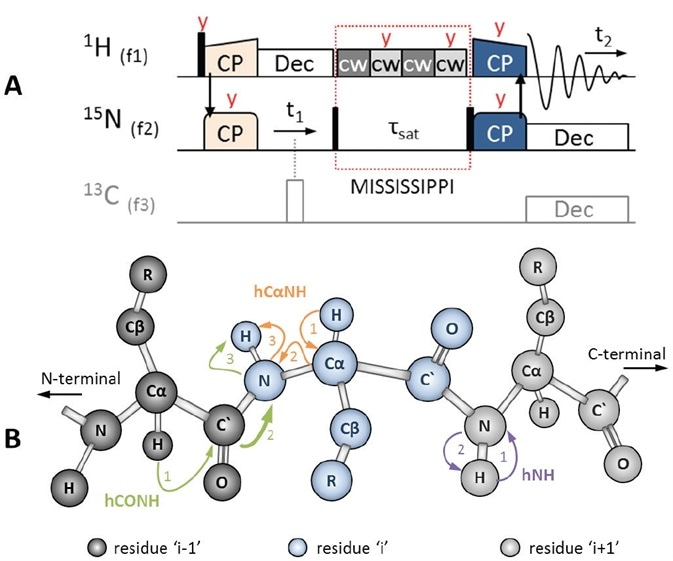
Figure 3. (A) 2D HSQC-like ‘hNH2D.dcp’ pulse sequence to correlate 15N with 1H using 1H-detection. The initial 1H magnetization is transferred to 15N via HN CP (light orange). The 15N signal evolves under 1H decoupling (white). Using an H/C/N triple channel probe, 13C-decoupling can also be used (gray, π hard pulse). During MISSISSIPPI water suppression (red dotted box), which is applied on-resonance with the water peak, 15N magnetization is stored along Z by a π/2 hard pulse (black). Afterwards, 15N magnetization is flipped back into the XY plane to transfer polarization back to 1H via NH CP (dark blue), followed by 1H-detection under low power decoupling on 15N, and possibly 13C. Pulses are applied along X, unless otherwise stated (red text). (B) Polarization transfer schemes during hNH (purple), hCαNH (orange) and hCONH (green) experiments, the latter including an interresidue sequential transfer step (thick arrow).
If 1H spin dilution is increased, it will reduce the unwanted dipolar couplings, as shown in Figure 2, purple, and at the same time will also reduce the total 1H signal-to-noise ratio. Also, it is not possible to achieve selective dipolar transfer pathways, for instance, owing to the low tendency of two protons located close to one another. In addition, in the context of fast MAS, it is the experimental conditions that decide whether scalar or dipolar coupling-based experiments are preferred, as indicated in Figure 2, orange and green[3-6]. Therefore, when fast MAS rates are used, it is important to carefully select the experimental conditions. Another way is to use a strong dilution together with full reprotonation under (ultra-)fast MAS[3,4] or moderate MAS rates[2,6], where the spinning is adequate enough to weaken the 1H dipolar couplings, as illustrated in Figure 2, red and black.
Experiments and pulse programs
The easiest way to begin a 1H-detected experiment is the heteronuclear hNH experiment, which is based on CP but similar to a solution NMR HSQC experiment. This corresponds with the amide proton to its nitrogen, as depicted in Figure 3B, purple. Shown in Figure 3B, orange, and Figure 4A, the hCαNH sequence is being used to associate the Cα of a residue with the amide group in the same residue.
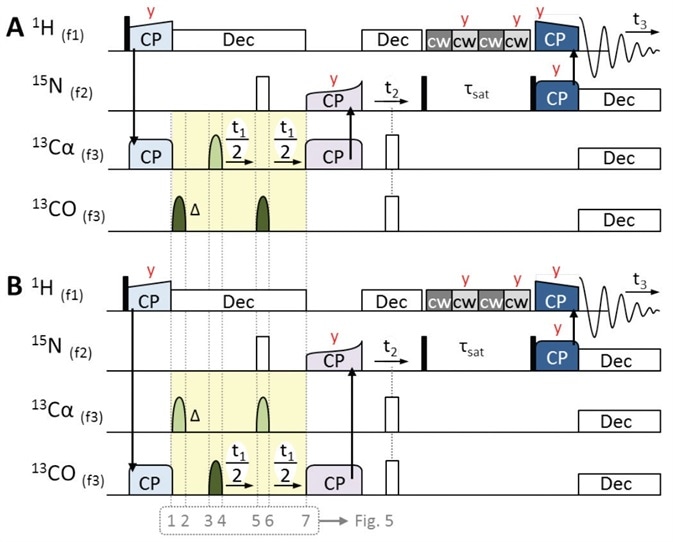
Figure 4. 3D pulse sequences of 1H-detected ‘hCaNH3D.tcp’ (A) and ‘hCONH3D.tcp’ (B) for obtaining intraresidue Cα-N-H and interresidue CO-N-H correlations respectively. Initial magnetization derives from 1H, followed by 1H to 13Cα or 13CO CP (light blue). Centered during t1, an off-resonance band-selective π pulse is used for JCO-Cα decoupling (light and dark green bell-shaped pulses). Phase evolution is compensated by a band-selective π pulse pair preceding t1 (see Figure 5 for details). Once magnetization is transferred back to 15N (purple CP step), the experiments follow the same scheme as that of the hNH experiment (Figure 3A). Pulses are applied along X unless otherwise stated (red letters).
The hCONH, shown in Figure 3B, green, and Figure 4B, can be utilized to achieve forward sequential correlations (N- to C-terminal). That allows the backbone CO of a residue ‘i-1’ to be correlated with the amide group of its successive neighbor, residue ‘i’.
The pulse sequences, except for ‘hNH2D.dcp’, are applied in triple channel mode with 1H, 15N and 13C on channels f1, f2, and f3, respectively. As shown in Figure 3A (in gray), the 13C channel is also triggered in the hNH2D.dcp when the ‘-DTC’ (‘triple channel’) flag is set in the TopSpin™ ‘ased’-parameter ‘zgoptns’. Under the header of each pulprog, a complete description of all the parameters applied and the proposed conditions are given.
Despite yielding different results, the three experiments share common pulse sequence building blocks. The first magnetization always originates from 1H activated by a π/2 hard pulse, which is subsequently followed by selective CP steps to 15N, shown in Figure 3A, orange pulses, and 13CO or 13Cα shown in Figure 4, light blue pulses.
In ‘hCONH3D.tcp’ and ‘hCaNH3D.tcp’, the RF irradiation’s carrier frequency (offset ‘o3’) is on-resonance with CO or Cα, respectively. During the time of indirect evolution (t1), it is essential to decouple homonuclear JCO-Cα coupling through a band-selective, t1-centered π pulse, which is used off-resonance, that is, a CO decoupling pulse is applied during the evolution of Cα in the hCαNH experiment and vice versa, as shown in Figure 4, light and dark green pulses.
Phase evolution of the on-resonance spins is caused by the off-resonance pulse. This Phase evolution is an effect that is typically known as the ‘Bloch-Siegert shift’ in solution NMR[9], as illustrated in Figure 5A, purple.
In addition, the initial evolution time t1(0) is also found to be greater than zero, leading to unnecessary initial chemical shift evolution for the initial TD point as shown in Figure 5A, red. To offset these effects, an on-resonance π pulse should precede t1 as depicted in Figure 5A, orange.
Next, a symmetry construct (Figure 4, yellow) that is centered around this on-resonance π pulse should be produced for complete refocusing (Figure 5B). This results in a second off-resonance π pulse as well as a symmetry delay (Δ) which offset the initial evolution time t1(0). Both these are applied successive to the initial 1H to 13C CP.
With a t1 larger than Δ, any other TD point can be obtained. This results in the required additional chemical shift evolution, which is not affected by refocusing, as clearly shown in Figure 5C, cyan.
For heteronuclear decoupling, shown in Figure 4, white pulses, a 1H low power decoupling and 15N π hard pulse are applied during t1, and this is followed by a SPECIFIC 13Cα or 13CO to 15N CP[10,11] transfer (Figure 4, purple pulses).
Later, both sequences equal the ‘hNH2D.dcp’, as indicated in Figure 3A. Here, heteronuclear decoupling attends 15N evolution (t1 or t2) using a 1H low power decoupling and 13C π hard pulse (white pulse). In order to curb the water signal, continuous wave (cw, light and dark gray) pulses are alternately applied along X and Y plane, on-resonance with the water peak.
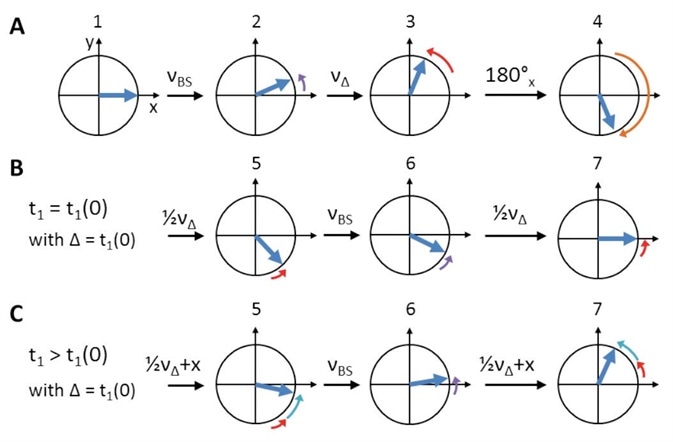
Figure 5. Schematic representation of Bloch-Siegert shift and initial t1 (t1(0)) phase evolution compensation. Numbers refer to ‘hCaNH3D.tcp’/‘hCONH3D.tcp’ pulprog of Figure 4. (A) After the initial CP, on-resonance 13C spins (blue) are oriented along X (1). The first off-resonance π pulse creates a Bloch-Siegert shift, νBS, (2, purple arrows). During the symmetry delay, Δ, which equals t1(0), additional chemical shift, νΔ, evolves (3, red arrows). Overall, evolution is reversed by the on-resonance π pulse (4, orange arrow) to refocus both νBS (6) and νΔ (5 and 7, steps of ‘½νΔ’ are due to split t1). While during t1(0) chemical shift evolution is refocused completely (B), it further evolves (‘+x’, cyan arrows) for all t1 times larger than Δ (C).
During the suppression of this so-called MISSISSIPPI H2O [12], a π/2 hard pulse stores 15N magnetization along the Z plane. 15N magnetization is returned to the XY plane with a second π/2 hard pulse to shift polarization to 1H in a final 15N to 1H CP (dark blue pulses), and this is followed by detection of 1H under low power heteronuclear decoupling on 13C and 15N.
Which experimental conditions to choose?
Using a Bruker Avance III HD 600 MHz Wide Bore system and a Bruker 1.3 mm rotor, the below recommendations have been tested on a perdeuterated, u-[13C, 15N]-labeled, and 100% 1H back-exchanged ubiquitin sample at 60 kHz MAS.
With the help of a BCU II, the sample temperature, which was about 294 K, was regulated using a N2 gas flow of ~1,100 l/hour to arrive at a set temperature of 257 K. Since faster MAS means more frictional heating, the N2 gas flow needed and the ideal temperature of the sample should be modified in advance using 79Br for instance [13]. However, care should be taken to avoid a gas flow of over 1300 l/hour so that rotor imbalances do not occur at high spinning speeds. Further, frame cooling should be employed when using temperature regulation.
As apparent from ‘conventional’ solid-state NMR, it is essential to fulfill the Hartmann-Hahn-condition n×vR=vI±vS in order to obtain CP transfer, with n representing an integer (typically ±1 or ±2), vR as the MAS rate, and vS and vI as the RF field strengths acting on the S and I spins, respectively. Addition of vS and vI is called a double-quantum (DQ) transition, and subtraction is called a zero-quantum (ZQ) transition. Selective CP, under (ultra-)fast MAS, is already efficient at low power irradiation. This results in higher sensitivity for the DQ CP condition as opposed to ZQ, as shown in Figure 6A.
RF field strengths of 50 kHz used on 1H and just 10 kHz applied on 13C or 15N, respectively have been proven well for both initial and final CP steps (νR = 60 kHz). The best results were given by SPECIFIC 13C to 15N CP using 25 kHz applied on 15N and 35 kHz on 13C. However, here the 50/10 kHz condition leads to poor transfer efficiency and hence is not suitable (Figure 6B), but on unknown samples, different Hartmann-Hahn conditions can always be tested.
During CP, transfer efficiency considerably increases when a shaped pulse is applied on one of the two nuclei involved. This is because it is possible to pass a number of Hartmann-Hahn conditions and B1 inhomogeneity can be compensated, as indicated in Figure 6A.[14] On either side of the two nuclei, a shape can be applied while the other nucleus undergoes a rectangular pulse in the form of ‘square.1000’ shape, for instance.
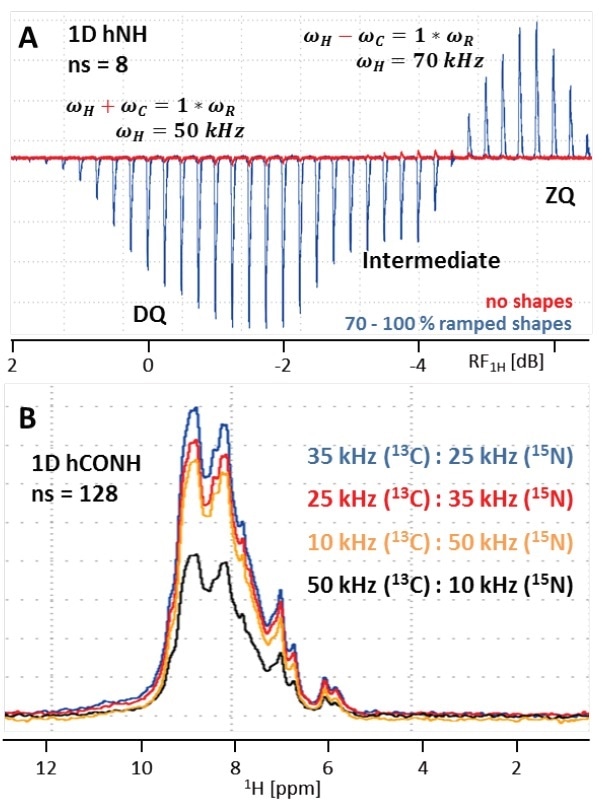
Figure 6. (A) Overlay of Hartmann-Hahn (HH) optimization curves for the initial H to N CP transfer in a 1D hNH experiment using either no shape (red) or a 70 to 100% ramp on 1H (blue, 20 times more transfer efficiency). As seen in the blue curve, double-quantum (DQ) transfer yields in increased transfer efficiency by >21% compared to zero-quantum (ZQ). Because the difference is only ~3 dB, both conditions interfere causing an intermediate window with reduced signal. (B) 1D hCONH spectra with different HH conditions for the SPECIFIC CO to N CP transfer. RF field strengths of 35 kHz on 13C and 25 kHz on 15N (DQ condition) results in best transfer efficiency.
For all initial and final CP steps, shapes that were linearly ramped up and ramped down were respectively applied on 1H. At a theoretical level, a flat ramp from 90% to 100% (for example, e.g. ‘ramp90100.1000’/‘ramp10090.1000’) would perform well at high MAS rates, but for this to happen magnetization has to be transferred most of the contact time. At times, a steeper ramp from 70% to 100%, for example, ‘ramp70100.1000’/‘ramp10070.1000’, can be much more efficient, as shown in the presented data. For SPECIFIC 13C-15N CP, it is even more efficient when a tangential amplitude modulated shape, for instance ‘tacn80’, is applied on 15N.
In accordance with solution NMR, Gaussian pulse cascades[15] such as Q3.2000 can be applied for 350 and 256 μs for selective 13CO and 13Cα pulses. A longer pulse is however more selective. When constants ‘cnst21’ and ‘cnst22’ are being set as frequency offsets for both 13CO and 13Cα in ppm, respectively, all the required frequency changes are measured and automatically set in the pulprog.
During MISSISSIPPI, it is important to optimize the H2O saturation time (tsat in Figure 3 and Figure 4, ‘d19’ in pulprogs) between 100 and 300 ms. Cw decoupling programs (cpdprg) are known as ‘and ‘cwY_13nofq’ and cwX_13nofq’. As the terms suggest, ‘plw13’ parameter is the corresponding power level and this should be set to ¼ of the MAS rate, for instance 15 kHz at 60 kHz MAS.
Note: The suffix ‘nofq’ reveals that no frequency switch is taking place with the cpdprg itself.
Similarly, just 15 kHz of heteronuclear decoupling on 1H is adequate during 13C/15N evolution times using ‘sltppm_12nofq’ at ‘plw12’ power level.[16]
During the acquisition of protons, heteronuclear decoupling of 10 kHz is applied on 15N and 13C, using ‘waltz16_18nofq’ and ‘waltz16_16nofq’ at power levels ‘plw18’ and ‘plw16’, respectively.[17]
A summary of all the required parameters, including recommendations, is given in the following Table 1.
Outlook
Bruker, along with top scientists in the solid-state NMR spectroscopy field, continues to perform sophisticated 1H-detected experiments for ultra-fast MAS.
Table 1. Summary of recommended parameters for 1H-detected experiments recorded at 60 kHz MAS. Parameters in bold text should be optimized. For all other parameters, it is sufficient to calculate/set the recommended values.
|
Parameters
|
Nuclei
|
Parameter names in pulprog
|
Rule of thumb
|
|
90° (180°) hard pulses
|
1H
|
p3 (p4) @ plw2
|
~100 kHz (2.5 μs)
|
|
15N
|
p21 (p22) @ plw21
|
~42 kHz (6 μs), optimize in hNH2D.dcp: flag ‘–DN90’ (zero crossing)
|
|
13C
|
p1 (p2) @ plw1
|
~72 kHz (3.5 μs), optimize in hCxNH3D.tcp: flag ‘–DC90’ (zero crossing)
|
|
180° selective pulses
|
13Cα
|
p24* @ spw24
|
~350 us @ shape: ‘Q3.2000’; open shape in ‘shapetool> stdisp> Analysis> Integrate Shape’ and enter: ‘length of p24, ‘180.0’, length of p1’, result tells by how much pldb1 needs to be changed for spdb24
|
|
13CO
|
p23* @ spw23
|
~275 us @ shape: ‘Q3.2000’; open shape in ‘shapetool> stdisp> Analysis> Integrate Shape’ and enter: ‘length of p23, ‘180.0’, length of p1’, result tells by how much pldb1 needs to be changed for spdb23
|
|
CP transfers
|
H-N
|
p25 @ spw42 (H) & spw43 (N)
|
1-3 ms @ 50 kHz & 10 kHz, shapes: ‘ramp90100.1000’ & ‘square.1000’
|
|
H-Cα
|
p18 @ spw38 (H) & spw52 (C)
|
2-6 ms @ 50 kHz & 10 kHz, shapes: ‘ramp90100.1000’ & ‘square.1000’
|
|
H-CO
|
p19 @ spw39 (H) & spw53 (C)
|
2-6 ms @ 50 kHz & 10 kHz, shapes: ‘ramp90100.1000’ & ‘square.1000’
|
|
Cα-N
|
p16 @ spw5 (N) & spw50 (C)
|
3-10 ms @ 25 kHz & 35 kHz, shapes: ‘tacn80’ & ‘square.1000’
|
|
CO-N
|
p17 @ spw6 (N) & spw51 (C)
|
3-10 ms @ 25 kHz & 35 kHz, shapes: ‘tacn80’ & ‘square.1000’
|
|
N-H
|
p45 @ spw47 (N) & spw46 (H)
|
400-800 μs @ 50 kHz & 10 kHz, shapes: ‘square.1000’ & ‘ramp10090.1000’
|
|
Decoupling
|
1H
|
cpdprg1 @ pcpd1 & plw12
|
‘sltppm_12nofq’ @ 33.33 μs & ¼ * νR (15 kHz)
|
|
|
cpdprg4/5 @ d19 & plw13
|
‘cwX_13nofq’/ ‘cwY_13nofq’ @ 100-300 ms & 15 kHz (=MISSISSIPPI)
|
|
15N
|
cpdprg2 @ pcpd2 & plw16
|
‘waltz16_16nofq’ @ 25 μs & 10 kHz
|
|
13C
|
cpdprg3 @ pcpd3 & plw18
|
‘waltz16_18nofq’ @ 25 μs & 10 kHz
|
|
1H
|
o1
|
on resonance with the water peak (~5 ppm)
|
|
Offsets
|
15N
|
o2
|
center of 15N signal (~119 ppm)
|
|
13C
|
o3 (hCαNH3D.tcp)
|
on resonance with Cα region (~54 ppm)
|
|
o3 (hCONH3D.tcp)
|
on resonance with CO region (~174 ppm)
|
|
cnst21
|
frequency offset for CO (~174 ppm)
|
|
cnst22
|
frequency offset for Cα (~54 ppm)
|
|
cnst26
|
frequency offset for CO-Cα (~114 ppm)
|
*The pulse length is linearly proportional to 1/B0.
References
1. B. Reif et al., 1H-1H MAS Correlation Spectroscopy and Distance Measurements in a Deuterated Peptide. J Magn Reson (2001) 151:320−327.
2. V. Chevelkov et al., Ultrahigh Resolution in Proton Solid-State NMR Spectroscopy at High Levels of Deuteration. Angew Chem Int Ed (2006) 118:3963-3966.
3. M.J. Knight et al., Fast Resonance Assignment and Fold Determination of Human Superoxide Dismutase by High-Resolution Proton-Detected Solid-State MAS NMR Spectroscopy. Angew Chem Int Ed (2011) 50:11697-11701.
4. D.H. Zhou et al., Solid-state NMR analysis of membrane proteins and protein aggregates by proton detected spectroscopy. J Biomol NMR (2012) 54:291-305.
5. E. Barbet-Massin et al., Rapid Proton-Detected NMR Assignment for Proteins with Fast Magic Angle Spinning. J Am Chem Soc (2014) 136:12489-12497.
6. V. Chevelkov et al., Proton-detected MAS NMR experiments based on dipolar transfers for backbone assignment of highly deuterated proteins. J Magn Reson (2014) 242:180-188.
7. D.P. Burum & R.R. Ernst, Net polarization transfer via a J-ordered state for signal enhancement of low-sensitivity nuclei. J Magn Reson (1980) 39:163-168.
8. S.R. Hartmann & E.L. Hahn, Nuclear Double Resonance in the Rotating Frame. Phys Rev (1962) 128:2042-2053.
9. F. Bloch & A. Siegert, Magnetic Resonance for Nonrotating Fields. Phys Rev (1940) 57:522-527.
10. M. Baldus et al., Efficient 15N-13C Polarization Transfer by Adiabatic-Passage Hartmann-Hahn Cross Polarization. J Magn Reson (1996) 118:140-144.
11. M. Baldus et al., Cross polarization in the tilted frame: assignment and spectral simplification in heteronuclear spin systems. Mol Phys (1998) 95:1197-1207.
12. D.H. Zhou & C.M. Rienstra, High-Performance Solvent Suppression for Proton-Detected Solid-State NMR. J Magn Reson (2008) 192:167-172.
13. K.R. Thurber et al., Measurement of sample temperatures under magic-angle spinning from the chemical shift and spin-lattice relaxation rate of 79Br in KBr powder. J Magn Reson (2009) 196:84-87.
14. O.B. Peersen et al., Variable-Amplitude Cross-Polarization MAS NMR. Magn Reson (1993) 104:334-339.
15. L. Emsley & G. Bodenhausen, Gaussian pulse cascades – new analytical functions for rectangular selective inversion and in-phase excitation in NMR. Chem Phys Lett (1990) 165:469-476.
16. J.R. Lewandowski et al., Measurement of Site-Specific 13C Spin-Lattice Relaxation in a Crystalline Protein. J Am Chem Soc (2010) 132:8252-8254.
17. A.J. Shaka et al., An improved sequence for broadband decoupling: WALTZ-16. J Magn Reson (1983) 52:335-338.
About Bruker BioSpin - NMR, EPR and Imaging

Bruker BioSpin offers the world's most comprehensive range of NMR and EPR spectroscopy and preclinical research tools. Bruker BioSpin develops, manufactures and supplies technology to research establishments, commercial enterprises and multi-national corporations across countless industries and fields of expertise.
Sponsored Content Policy: News-Medical.net publishes articles and related content that may be derived from sources where we have existing commercial relationships, provided such content adds value to the core editorial ethos of News-Medical.Net which is to educate and inform site visitors interested in medical research, science, medical devices and treatments.