In developmental biology, life science, and medicine, there is a growing need to visualize biological events at a high resolution in their native context [1-4]. Intravital correlative microscopy (IVM) allows users to follow biological processes in vivo using fluorescence microscopy (FM) and consequently, shows an object of interest and its microenvironment at high resolution with electron microscopy (EM).
Monitoring the volume of interest whilst moving from one imaging modality to another is the main challenge for correlative microscopy. Usually, the difference in field of view (FOV) and image formation between EM and FM make it challenging to correlate datasets.
Furthermore, conventional sample preparation procedures for EM result in loss of fluorescent labels and create alterations to the dimensions and orientation of the sample, usually making it impossible to correlate the datasets afterward. The retrieval of the ROI is the most difficult, time-consuming and tedious part of correlative microscopy for these reasons.
This article details a fast and robust workflow which depends on microCT to map resin embedded, electron-dense, biological EM-samples [5-7]. Essentially, after (intravital) fluorescence microscopy (FM), the sample is then processed for EM. Next, microCT scans are gathered and correlated to the FM volumes. 3D registration of both datasets allows users to approach this area accurately by utilizing ultramicrotomy.
Predominantly, the protocol allows a user to correlate 3D FM to EM and is applicable to a wide variety of biological samples. It permits employing endogenous landmarks for correlation, and so does not need the introduction of artificial markers which could potentially disrupt the sample. In addition, microCT can also be employed to determine the orientation of electron dense, opaque samples within the resin block.
The microCT map shows the alignment of the sample in the ultramicrotome, and permits users to trim the sample for later thin-sectioning and/or volume Scanning EM accurately [8,9].
Materials and Methods
Using fluorescence microscopy (FM) in vivo, dynamic processes in organisms and cells can be monitored over time. In this article, with the examination of the early steps in the brain colonization of metastatic cancer cells in mice, the procedure is exemplified [5,6] (Figure 1).
Using multi-photon microscopy through a chronic cranial window, these events can be seen in vivo [10]. Once the event of interest is identified, the mouse is perfusion-fixed and the ROI is then marked on the surface of the brain using near infrared branding (NIRB) [11].
![Sample preparation, multimodal imaging and image processing workflow. By use of an optimized workflow concept the processing time could be reduced from 3-6 months to approximately 2 weeks, while gaining highly relevant data at the same time. IVM: Intravital Microscopy; 3DEM: 3D electron microscopy. Reproduced from Karreman et al, 2016 [5].](https://d2jx2rerrg6sh3.cloudfront.net/image-handler/picture/2019/5/11-1.jpg)
Figure 1. Sample preparation, multimodal imaging and image processing workflow. By use of an optimized workflow concept the processing time could be reduced from 3-6 months to approximately 2 weeks, while gaining highly relevant data at the same time. IVM: Intravital Microscopy; 3DEM: 3D electron microscopy. Reproduced from Karreman et al, 2016 [5].
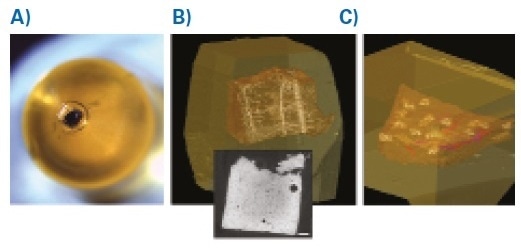
Figure 2. Mouse Brain and Skin. A: Resin block with embedded mouse brain tissue harboring the ROI. Note the tissue is fully opaque due to the 3DEM processing protocols. B: Reconstructed and rendered microCT volume of the sample.
Using a stereomicroscope, the NIRB markings can be seen on the fixed brain, which permits dissection of a ~1-2 mm3 biopsy which includes the volume of interest. In order to recognize the orientation of the sample after EM processing, the biopsy should be cut asymmetrically. This enables the sample to be mounted with the branded side closest to the resin block surface in the final embedding step of the EM processing protocol (Figure 2).
The EM processing protocol involves fixation and infiltration with 1.5% potassium ferrocyanide, and 1% osmium tetroxide (OsO4) then another fixation by 1% OsO4, and staining with 1% aqueous uranyl acetate. The heavy metals stabilize the sample and produce a strong image contrast in microCT and EM.
Utilizing smaller concentrations of stains will still permit observation of the details in microCT which are needed in order to map the sample. Different tissue components can be visualized with microCT, depending on the type of sample and choice of stain [12].
Next, the biopsy is dehydrated in a graded series of ethanol in water and infiltrated with epoxy resin gradually. These steps were carried out in a laboratory-grade microwave to enhance infiltration efficiency and make the procedure faster overall. The sample is then trimmed around the biopsy to produce a small sample in the range of 2 x 2 x 4 mm, with a flat blockface and straight sides after polymerization of the epoxy resin (see Figure 1).
The sample is imaged with the Bruker Skyscan 1272 microCT in order to show the architecture and orientation of the biopsy contained in the resin block. Afterward, the sample is mounted on a standard holder, aligned and positioned near to the X-ray source to attain optimum resolution.
The sample is usually scanned with 75 kV / 133 μAmp or 50 kV / 200 μAmp, without filter, with a 1-2 μm isotropic voxel size, at scanning angles in the range of 180o. Next, the imaged volume is reconstructed by utilizing NRECON software (Bruker BioSpin MRI GmbH, Ettlingen, Germany). Crucially, microCT imaging of the EM-processed sample shows structural details that can then be exploited for correlation with the FM volume.
MicroCT shows the outlines of the biopsy, the cell nuclei, and the resin block and, crucially, the vasculature of the mouse brain. Additionally, the blood vessels are visualized during in vivo imaging, so these can be utilized as endogenous landmarks to carry out the correlation and 3D registration. Crucially, different tissue types and cells show different features in microCT [5], and in some instances the region of interest (ROI) itself can already be identified [8].
3D models of the imaged volumes are produced by semi-automatic segmentation of the datasets by using 3D image processing software, like Amira. Utilizing the landmark module, equal positions in both datasets are chosen, which permits the user to register the IVM model into the microCT model by utilizing landmark surface warp module.
With respect to the outlines of the EM-processed resin block observed in the microCT volume, the location of the ROI from the IVM volume is now mapped. A tumor cell can now be identified by using digital measuring tools, as the the distance in X, Y and Z from the surfaces of the sample block to the ROI can now be determined.
To approach the ROI accurately, the small resin block is mounted on an empty slab of resin and can be trimmed in an ultramicrotome. The sample is ready for subsequent serial sectioning or can be prepared for volume SEM upon reaching the position of the tumor cell (Figure 1).
Discussion and Results
Imaging an electron dense, resin-embedded, biological sample using microCT permits the user to map its position within the resin block and crucially, discloses landmarks which can be utilized for correlative microscopy. The workflow has been employed successfully (Figure 1) on a range of specimen, including numerous mice tissues, platynereis, zebrafish, and mice- and starfish oocytes.
Supplied by the microCT scan, the a-priori knowledge on the sample’s architecture permits accurate and efficient approaching of the region of interest (ROI) using microtomy. A trained electron microscopist would require a minimum of 3-6 months without microCT guidance, in order to retrieve a single tumor cell in a 1-2 mm3-sized brain biopsy as discussed here, if correlation can even be achieved.
Thus, MicroCT makes correlative microscopy and 3DEM workflows quicker, so that more events can be analyzed and significant conclusions can be established on rare but critical developmental or pathological events.
References
- Karreman, M.A. et al. (2016) Intravital Correlative Microscopy: Imaging Life at the Nanoscale. Trends in Cell Biology DOI: 10.1016/j.tcb.2016.07.003
- Maco, B. et al. (2013) Correlative In Vivo 2 Photon and Focused Ion Beam Scanning Electron Microscopy of Cortical Neurons. PLoS ONE 8, e57405
- Durdu, S. et al. (2014) Luminal signalling links cell communication to tissue architecture during organogenesis. Nature 515, 120–124
- Follain, G. et al. (2018) Hemodynamic Forces Tune the Arrest, Adhesion, and Extravasation of Circulating Tumor Cells. Developmental Cell 45, 33–52. e12
- Karreman, M.A. et al. (2016) Fast and precise targeting of single tumor cells in vivo by multimodal correlative microscopy. Journal of Cell Science 129, 444–456
- Karreman, M.A. et al. (2017) Find your way with X-Ray. In Methods in Cell Biology 140pp. 277–301, Elsevier
- Weinhard, L. et al. (2018) Microglia remodel synapses by presynaptic trogocytosis and spine head filopodia induction. Nat Commun 9, 1228
- Borrego-Pinto, J. et al. (2016) Distinct mechanisms eliminate mother and daughter centrioles in meiosis of starfish oocytes. The Journal of Cell Biology 212, 815–827
- Burdyniuk, M. et al. (2018) Correlated light and electron microscopy of cell division in large marine oocytes, eggs, and embryos. In Methods in Cell Biology 145pp. 293–313, Elsevier
- Kienast, Y. et al. (2010) Realtime imaging reveals the single steps of brain metastasis formation. Nature Medicine 16, 116–122
- Bishop, D. et al. (2011) Near-infrared branding efficiently correlates light and electron microscopy. Nature Methods 8, 568–570
- Metscher, B.D. (2009) MicroCT for comparative morphology: simple staining methods allow highcontrast 3D imaging of diverse non-mineralized animal tissues. BMC Physiol 9, 11
About Bruker BioSpin - NMR, EPR and Imaging

Bruker BioSpin offers the world's most comprehensive range of NMR and EPR spectroscopy and preclinical research tools. Bruker BioSpin develops, manufactures and supplies technology to research establishments, commercial enterprises and multi-national corporations across countless industries and fields of expertise.
Sponsored Content Policy: News-Medical.net publishes articles and related content that may be derived from sources where we have existing commercial relationships, provided such content adds value to the core editorial ethos of News-Medical.Net which is to educate and inform site visitors interested in medical research, science, medical devices and treatments.