Thomas Hunt Morgan
The work of Thomas Hunt Morgan in 1911 revealed a new understanding of how genes are inherited. His work on Drosophila demonstrated that: (1) traits that were assumed to be ‘linked’, or inherited together, could be unlinked and inherited independently, and (2) some genes demonstrated little, if any, linkage.
The theory of linked genes comes from the presumption that genes located close together in space have a greater probability of being inherited together. To explain his observations, Morgan proposed that ‘crossing over’ events occurred enabling the exchange of genetic information.
Presently, this event is termed ‘recombination’, and known to occur during the prophase stage of meiosis between alleles of homologous chromosomes. This generates different combinations of alleles in each chromosome and the resultant gametes will possess recombinant chromosomes.
In addition to his theory of ‘crossing over’, Morgan further hypothesized that the frequency of recombination events could be estimated according to the distance between two genes on a chromosome. Thus, in the event of ‘crossing over’, two adjacent genes could be unlinked. Morgan correctly stipulated that the relationship between the strength of the genetic linkage between two genes was dependent on the distance between them.
This proposition enabled the construction of the human genome map.
Using Recombination Frequency to Map the Human Genome
The proportion of crossovers occurring between two genes can be used to indicate the distance between them, and thus enable the construction of a genetic map that illustrates how all genes in the genome are related in space.
The earliest experiments performed were by Sturtevant. He performed crosses between two Drosophila flies that possessed two genetic traits. For example, to determine the distance between two genes, vermilion eyes (V) and long wings (L) Sturtevant crossed a Drosophila with these features and with another with rudimentary wings and red eyes.

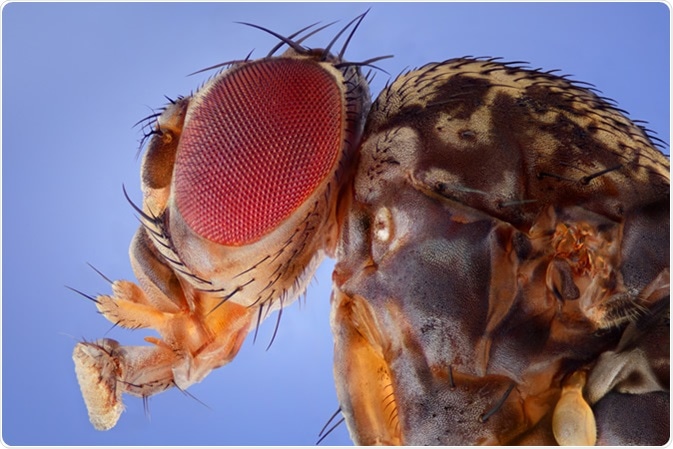
Image showed the Fruit Fly, Drosophila melanogaster. Photograph from the side showing the head and torso. Image Credit: Ireneusz Waledzik / Shutterstock
The resultant F1 generation produced offspring with either (1) red eyes and long wings or (2) vermillion eyes and long wings. This generation was subsequently crossed again and noted offspring of this F2 generation that possessed unexpected phenotypes. In total four classes of male offspring were observed in the F2 generation.
Male offspring are only used in the search from recombinants as the additional X chromosome in females can possess dominant genes that obscure the phenotype of the offspring.
- Red eyes and long wings
- Red eyes and rudimentary wings
- Vermillion eyes and long wings
- Vermillion eyes and rudimentary wings
Of the four classes of phenotypes observed, only (1) and (4) were expected and could be explained by recombination events. Classes (2) and (3) arose from nonrecombinants. From the frequency of the phenotypes in the F2 generation, the distances between the genes and the order in relation to one another could be determined. This spatial mapping of the genes is referred to as a linkage map. Sturtevant further defined the units of measurements for the linear distances, which he termed the ‘map unit’, presently referred to as the centimorgan (cM).
One centimorgan represented a 1% proportion of recombinants present in the offspring, i.e. a recombination frequency of 0.01.
The recombination frequency is calculated using the following equation:
Deviations from the Expected Recombination Frequency: The Discovery of Interference
Sturtevant discovered that not all recombinant frequencies produced experimentally could be used to produce a map that linearly mapped genes on a chromosome.
In addition, his theorized distances did not match those obtained from those calculated using the recombinant offspring data. This led Sturtevant to hypothesize that if two genes were an appreciable distance apart, instances of double recombination could occur.
He further suggested, based on the discrepancies between the theoretical and calculated recombination frequencies, that one crossover event may inhibit subsequent crossover events in a phenomenon he called ‘interference’.
This conclusion was based on his examination of crossover events between three genes: C (color of the body), EC (two closely-linked genes encoding eye color), and R (rudimentary wings). He found the recombinant frequency that produced a gametic chromosome comprised of B and CO genes from parental chromosome one and R on parental chromosome two was approximately 0.5 or a ratio of 1:2 (CO/R: nonrecombinants. This described the recombinant CO/R.
However, when a crossover occurred to produce an offspring with a chromosome comprised of a B from parental chromosome one and CO and R from parental chromosome two (recombinant B/CO), the likelihood of a second CO/R recombination event dropped (i.e. a ratio of 1:6:5 (CO/R: B/CO: nonrecombinants)) was seen. This demonstrated that the first crossing over event was interfering with the second.
The work of both Morgan and Sturtevant progressed our understanding of inheritance and began the process of gene mapping.
The ability to map genes relies on the principle of crossing over the ability of two genes that are present on the same chromosome to undergo a crossover event is related to the distance between them.
The recombination frequencies can be calculated by studying thousands of offspring. This is the key determinant of linkage distance between genes and can be used to map an entire chromosome rather than defining distances in a physical manner.
Further Reading