Authors
Authors: R. Narizzano,1 F. Risso,1 A. Bazzano,1 A. Magherini,1 F. Femminella,1 P. Legnani,1 R. Bertolotto,1 Barbara Bravo,2
Valerio Pasini,2 and Daniele Benzoni2
1Regional Laboratory Department, Chemical and Physical Analysis Division, Regional Agency for Environmental Protection–Liguria (ARPAL), Italy | 2Thermo Fisher Scientific
In forensic investigations, drug residue is a common finding. Where there are no indicators of biological fluids, it may be the only sign of a subject’s intoxication.
In such situations, Raman spectroscopy, a form of vibrational spectroscopy, is a useful technology that generates rapid and accurate results without ruining the sample itself.
This analysis utilizes a drug dilution as the assumed state if found at a crime scene. The investigation of hypnotic sedatives was predicated on tablets since there is no literature about oral solutions or dilutions in beverages. Incorporated into the analysis were:
- Effortil (Boehringer Ingelheim): Active ingredient: Etilefrine clorhyrate; for the treatment of heart failure and as a doping substance
- Sonirem: Active ingredient: zolpidem tartrate; sleep aid
- Benzodiazepines: Lorazepam (Ativan), Bromazepam (Lexotan), Alprazolam (Xanax); Used to treat anxiety
- Cocaine: Derived from the plant Erythroxylum coca; narcotic
Methods
Analyses were carried out using the Thermo Scientific™ DXR2 Raman Microscope. For diluted compounds, a drop was initially dried on a clean microscope slide. As an alternative in certain instances, a drop of the dilution was added to a closed glass microvial to prevent the solvent from rapidly evaporating.
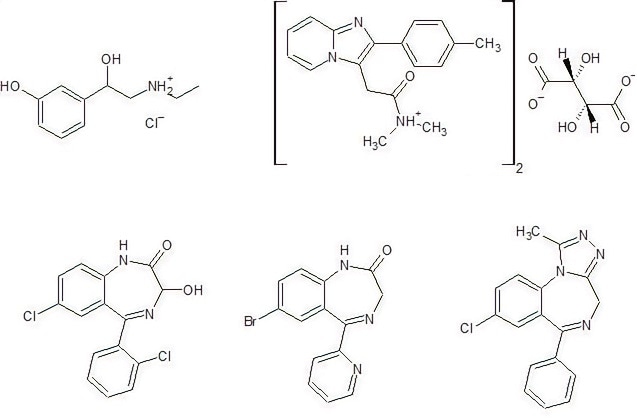
Figure 1. Active ingredients analyzed with Raman spectroscopy. Image Credit: Thermo Fisher Scientific – Materials & Structural Analysis
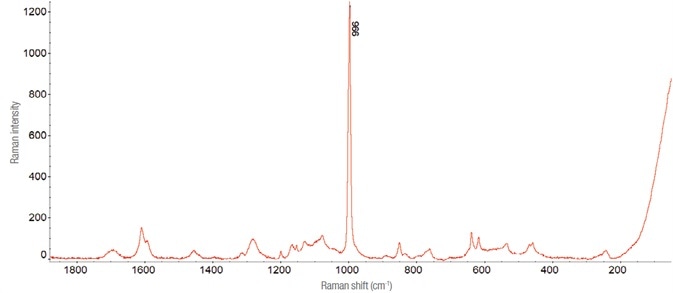
Figure 2. Raman spectrum of ethylephrine hydrochloride, collected with a 10 mW laser at 532 nm, using 300 1-second exposures. Image Credit: Thermo Fisher Scientific – Materials & Structural Analysis
Results
Effortil
The early spectra suggested the presence of more than just the active substance. (See Figure 3.) Through a reference of library data, this compound was determined to be propyl parahydroxybenzoate, one of the main additives found in the oral solution.
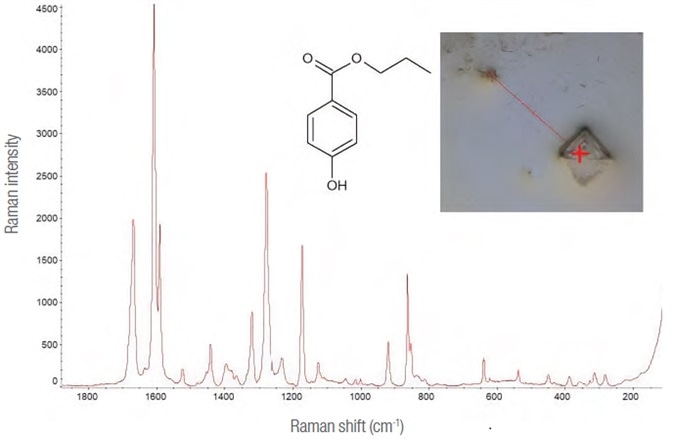
Figure 3. Propyl para-hydroxybenzoate. Raman spectrum (532 nm laser, 10 mW – 50 1 s exposures), molecule and image of the point on the map where it was detected (10x lens). Image Credit: Thermo Fisher Scientific – Materials & Structural Analysis
By retaining the spectrum of the active substance, the peak present at about 996 cm-1 is easily identified as it is much more intense than everywhere else. Therefore, it was decided to keep it as a reference for the analysis of samples diluted while assessing it on time retained in the given area for ‘complicate’.
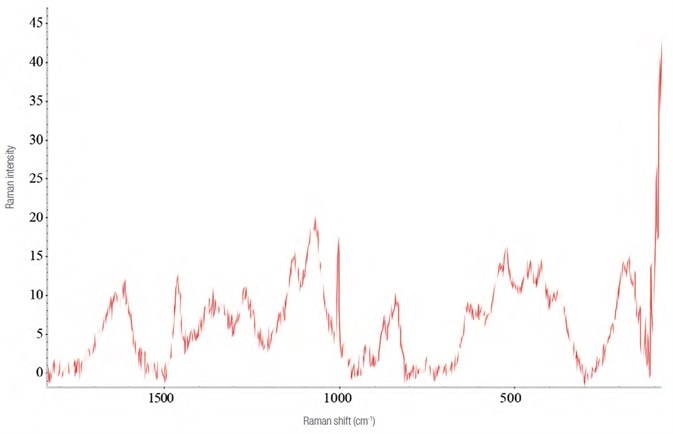
Figure 4. Raman spectrum of Effortil diluted in a matrix of pear juice (laser 532 nm - 10 mW, 8 acquisitions of 60 s). Image Credit: Thermo Fisher Scientific – Materials & Structural Analysis
To replicate an athlete’s dissolution of ethylmorphine hydrochloride in a stimulating drink, dilutions were developed using fruit juices. Corrections were made for the disturbances the fruit juices caused, see Figure 4.
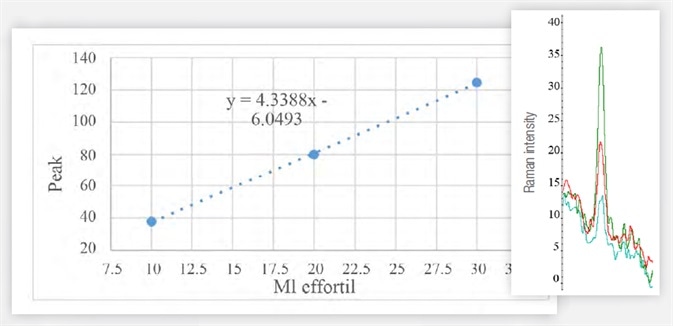
Figure 5. Area of the most intense peak of the Raman spectrum of samples of 10 (blue), 20 (red), 30 (green) μL of Effortil in the cranberry juice. Image Credit: Thermo Fisher Scientific – Materials & Structural Analysis
It is possible to precisely measure the area beneath the peak of interest, which is relative to the concentration of the active substance. The linear instrumental response facilitates quantitative analysis using the calibration curve - see Figure 5 and Table 1.
Table 1. Data used to generate Figure 5. Source: Thermo Fisher Scientific – Materials & Structural Analysis
| . |
. |
. |
. |
| μL effortil |
10 |
20 |
30 |
| Peak Area (996 cm-1) |
37,80 |
79,93 |
124,5 |
Sonirem
The Raman spectrum for zolpidem tartrate was acquired in a manner similar to that of Effortil, as shown in Figure 6. Utilizing the same instrument parameters, the spectra and the level of interference were influenced by the dilution in water as exhibited in Figure 7.
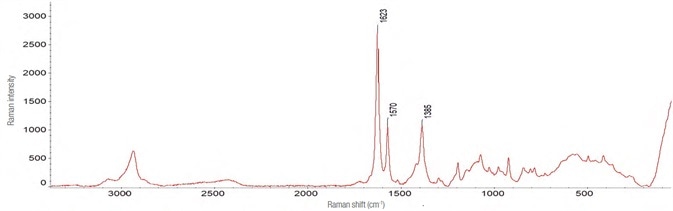
Figure 6. Spectrum of zolpidem tartrate. Obtained with the following instrumental parameters: laser 532 nm – 10 mW, 90 acquisitions of 1 s each. Image Credit: Thermo Fisher Scientific – Materials & Structural Analysis
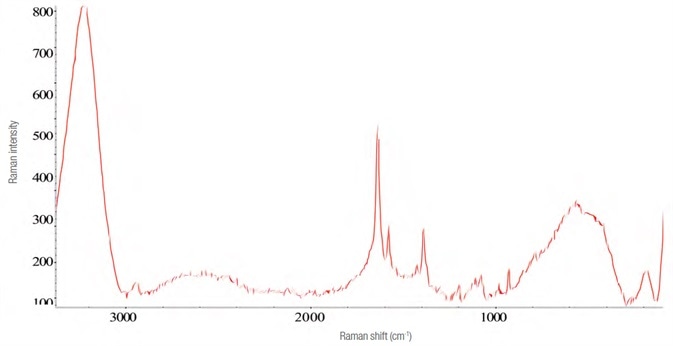
Figure 7. Raman spectrum of four times the recommended dose of zolpidem tartrate diluted in water. Image Credit: Thermo Fisher Scientific – Materials & Structural Analysis
Analysis was performed on amounts equal to half, full, double and triple the recommended dose of 10 mg. The results, as shown in Table 2 and Figure 8, indicate the linearity of the peak area at 1623 cm-1 as a function of the dilutions.
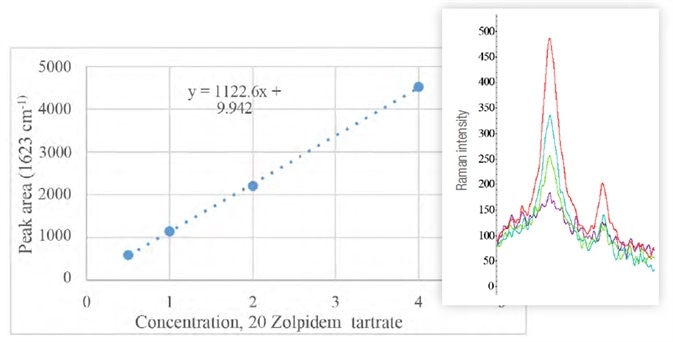
Figure 8. Graph of peak area at 1623 cm-1 (highest in Raman spectra on the right, purple to red with increasing doses) as a function of the concentration of zolpidem tartato. Image Credit: Thermo Fisher Scientific – Materials & Structural Analysis
The ratios with adjacent peaks (1570 cm-1) do not change significantly across each of the samples.
Table 2. Zolpidem tartrate samples, diluted to final concentration (Cf) with water. Initial (Vi) and final (Vf) volume, as well as critical peak areas, are also shown. Source: Thermo Fisher Scientific – Materials & Structural Analysis
| Dose |
Vi
[μL] |
Vf
[μL] |
Ci
[mg/mL] |
Cf
[mg/mL] |
Peak area
(1623 cm-1) |
Peak area
(1570 cm-1) |
Area
ratio |
| Half |
0.5 |
10 |
200 |
10 |
0.5 |
587.3 |
94.7 |
6.20 |
| Single |
1 |
10 |
100 |
|
1 |
1146.4 |
187.3 |
6.12 |
| Double |
2 |
20 |
100 |
|
2 |
2206.0 |
347.3 |
6.35 |
| Quadruple |
4 |
40 |
100 |
|
4 |
4519.2 |
696.6 |
6.49 |
Lorazepam
The hydroalcolic oral solution (Lorazepam Dorom) quickly evaporates in air, making detecting the active ingredient all the more difficult.
An improved Raman spectrum was acquired by adding a drop of the drug to a closed glass microvial and allowing the solvent to evaporate slowly. The variances are clearly seen in the Raman spectra, as demonstrated in Figure 9.
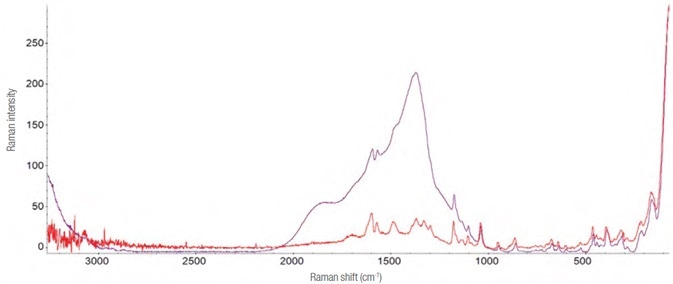
Figure 9. Raman spectra of Lorazepam. In purple is reported the one evidently interfered (laser 785 nm – 30 mW, 32 acquisitions from 5 s). In red the one obtained using the “microvial” and acquiring the Raman spectrum through it (laser 785 nm – 14 mW, 40 acquisitions of 2 s). Image Credit: Thermo Fisher Scientific – Materials & Structural Analysis
Bromazepam and alprazolam
The galenic formulations of these two products only differ slightly, and both possess an excipient (propylene glycol, PEG) that conceals the active substance.
Although an attempt was made to separate the PEG utilizing a basifying agent and chromatographic techniques (thin layer and column), the Raman spectra only generated propylene glycol (1,2-propandiol). See Figure 10.
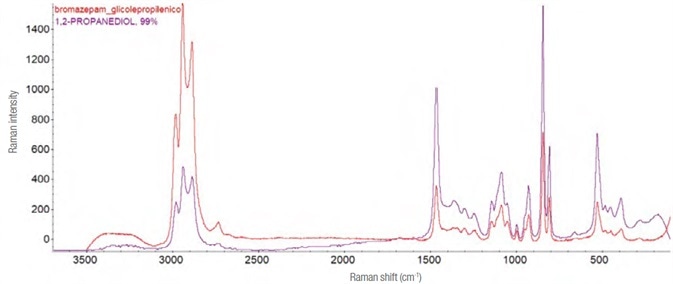
Figure 10. Raman spectrum and molecular structure of propylene glycol. In red the experimental spectrum (laser 532 nm, 4 mW – 45 acquisitions from 1 s), in purple the theoretical one assigned by the software recognition system. Image Credit: Thermo Fisher Scientific – Materials & Structural Analysis
Cocaine
The source of cocaine, erythroxylum coca, is a plant native to Latin America. As an alkaloid narcotic substance, it is a stimulant that typically activates the central nervous system.
It is commonly inhaled as a free base or sometimes injected (as a hydrochloride salt). The spectrum of cocaine hydrochloride from the sample appears in Figure 11.
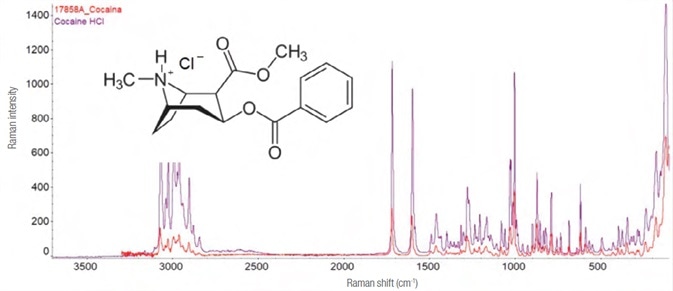
Figure 11. Experimental Raman spectrum (in red, laser 785 nm – 25 mW, 5 exposures of 8 s each) and library (purple) of cocaine hydrochloride and its structure formula. Image Credit: Thermo Fisher Scientific – Materials & Structural Analysis
Conclusions
The results determined the potential of utilizing Raman spectroscopy for qualitative analysis in the forensic field. Results can be acquired in a minimal amount of time using small samples with little sample preparation.
Liquid sample testing should be conducted using low laser power to prevent solvent evaporation and sample crystallization. If the solvent does not evaporate, which would concentrate both the analyte and interferants, quantitation can be assessed using the area beneath the peak.
The active ingredients and excipients for different drugs can be easily detected using Raman spectroscopy. However, it may be necessary to conduct preliminary separative treatments if results only demonstrate the presence of the known excipients.
About Thermo Fisher Scientific – Materials & Structural Analysis
 Thermo Fisher Materials and Structural Analysis products give you outstanding capabilities in materials science research and development. Driving innovation and productivity, their portfolio of scientific instruments enable the design, characterization and lab-to-production scale of materials used throughout industry.
Sponsored Content Policy: News-Medical.net publishes articles and related content that may be derived from sources where we have existing commercial relationships, provided such content adds value to the core editorial ethos of News-Medical.Net which is to educate and inform site visitors interested in medical research, science, medical devices and treatments.