Sponsored Content by SepmagReviewed by Maria OsipovaMay 9 2024
Optical monitoring of the magnetic bead separation process offers information on both separation completion time and the characteristics of the magnetic bead suspension.

Image Credit: Sepmag
The absorbance/opacity time change during separation can typically be fitted to a sigmoidal curve. The magnetophoretic behavior may then be defined by t50 (the time when the difference between maximal and minimal absorbance reaches 50%) and the exponent ‘p’ (which is linked to the curve slope at t50).
These two values are very resilient even when the experimental curve is not a perfect sigmoidal. However, for convenience, only the cases when the determination coefficient( r2) is greater than 0.99 are discussed in this article.
At first, quality control involved fitting absorbance curves. The separation method should result in the same curve for batches of the same product. In this scenario, if the t50 and p values do not match expectations, users can assume that there is a problem with the bead suspension.
Using QCR software (an earlier variant of the present Qualitance), it was discovered that batches in the Production Process often varied by reducing t50 and increasing p. This proved that when magnetic beads are clumped, separation occurs faster.
With this knowledge, production managers can identify the batches in which suspension was not adequately handled, or magnetic beads were stored correctly.
As a consequence, the R&D variant of this tool (Monitor software) was used to assess re-suspension procedures. When establishing the SOP, the method was tested by measuring the suspensions of the same batch after they had been stored and resuspended using the preliminary methods.
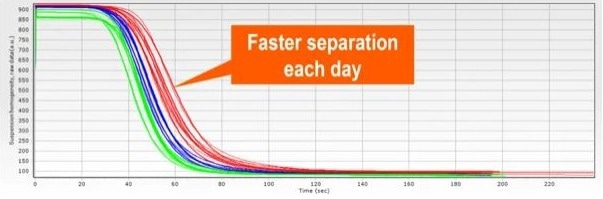
Figure 9.1. Graph showing the change in suspension homogeneity over time, where separation time declines over three days: day 1 (red), day 2 (blue) and day 3 (green). The suspension was measured several times on each day. Image Credit: Sepmag
Figure 1 depicts the separation time of a suspension sampled on three different days. On Day 1 (red), the suspension was assessed multiple times and resuspended between each measurement.
The suspension was stored and assessed again on Day 2 (blue). On Day 3 (green), this was repeated for a third time (green). Figure 1 demonstrates that the absorbance curve decreases in t50 and increases in p (Figure 2), indicating a quicker separation time each day.
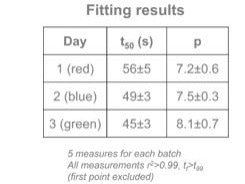
Figure 9.2. Table of results showing parameters t50 (s) and p and their errors on Days 1, 2 and 3. Image Credit: Sepmag
The predicted difference between the findings on various days should be lower than the error for both fitting parameters, t50 and p. These findings suggest that the storage and re-suspension protocols should be revised.
Figure 3 shows the separation time where a 1 L bottle with the suspension stored on a roller was used, demonstrating improved reproducibility of the magnetic separation curve.
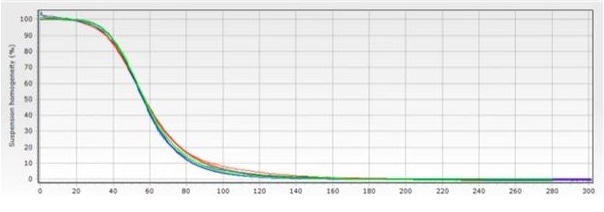
Figure 9.3. Graph showing the change in suspension homogeneity over time, where a 1 L vessel with the suspension stored on a roller was used, demonstrating improved reproducibility of the magnetic separation curve. Image Credit: Sepmag
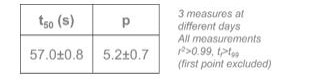
Figure 9.4. Table of results for the graph in Fig.9.3, showing parameters t50 (s) and p and their errors. Image Credit: Sepmag
With a confidence interval greater than 95 %, data from the first 20 batches can be used to establish the values of t50 and p, along with their errors, which are defined as 2σ. Assuming that the error distribution is normal and the process is reproducible, it is expected that no more than one curve will have its fitting parameters (t50 and p) fall outside the defined error margins.
Specifically, only one out of every 20 measurements can have t50 and/or p values less than <t50> -2σt50 or more than <t50> +2 σt50 (and the same for p).
Users should understand that even if the magnetic force is constant, the separation speed (and thus the separation time) is determined by the competition between the magnetic and drag forces.
Drag force depends on the viscosity of the suspension, which varies with temperature. The viscosity changes by 15 % from 18 ºC to 24 ºC (including a 5 % change from 20 ºC to 22 ºC), resulting in a corresponding decrease in t50.
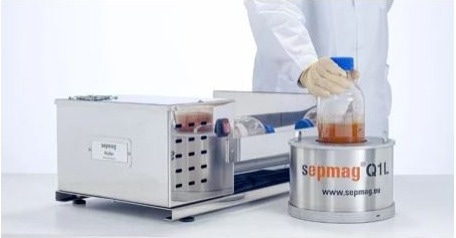
Figure 9.5. Advanced Magnetic Beat Separation System Sepmag Q1 L equipment and re-suspension equipment Sepmag Roller. Image Credit: Sepmag
Measuring and parametrizing absorbance variations during separation are powerful quality control techniques for constant magnetic force systems. They play a crucial role in determining the effect of different steps on the suspension and establishing robust SOPs.
About Sepmag 
Sepmag develops, manufactures and markets homogenous biomagnetic separation equipment for the international diagnostics market and for any user of Magnetic Beat separation techniques.
Sepmag’s instruments enhance the reproducibility of diagnostic kits, reduce material waste, facilitate the validation process and increase the safety of operation. These benefits are applicable through a range of laboratory settings from R&D facilities to large scale production processes. Sepmag is based in Barcelona and sells in Northamerica, Europe and Asia.
Sponsored Content Policy: News-Medical.net publishes articles and related content that may be derived from sources where we have existing commercial relationships, provided such content adds value to the core editorial ethos of News-Medical.Net which is to educate and inform site visitors interested in medical research, science, medical devices and treatments.