Introduction
In drug research and development, the effect that the hydration state of active pharmaceutical ingredients (APIs) has on crystallinity is an important consideration. Variations in crystallinity influence the stability, solubility, bio-availability, and dissolution rate of the drug. Therefore, knowing the effect that humidity has on the stability of different states is important, from both a regulatory and safety standpoint.
This article aims to assess the changing hydration states of two anti-inflammatory drugs at varying humidity, using Raman spectroscopy. The two drugs are nedocromil sodium (NS) and disodium cromoglycate (DSCG), which are agents used in the treatment of asthma.
DSCG (Figure 1) suppresses histamine release and reduces the production of leucotrienes, which alleviates the symptoms of allergic inflammation. DSCG can also prevent the bronchoconstriction that occurs in response to antigens, in both the short and long term.
NS (Figure 1) is known to prevent the inflammatory cell activity that occurs in asthma. Also, the impact of NS on sensory nerves suggests it may be useful in the treatment of asthmatic cough, inhibiting asthmatic reactions that occur after exercise and exposure to allergens.
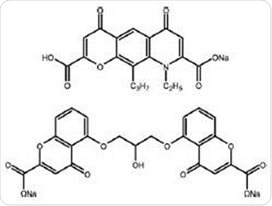
Figure 1. Nedocromil sodium (top) and disodium cromoglycate (bottom)
NS and DSCG form hydrate phases when they absorb water. On absorbing 0 to 9 water molecules, DSCG forms an endless series of nonstoichiometric hydrates and then collapses into a chain of liquid crystal mesomorphs.
Molecules of water present in adjacent unit cells of the DSCG form channels that can be continually contracted or expanded with minimal energy expenditure. This promotes equilibration at different ambient humidities.
NS, in contrast, has several hydrate states including an amorphous phase (which contains different amounts of water, from 1.5 to 3 moles), a heptahemihydrate, a monohydrate, and a trihydrate. The monohydrate form of this drug, which is achieved through dehydration of the trihydrate, is administered as a dry powder for inhalation.
This changing hydration state of the compounds can have significant effects on important pharmaceutical properties. The crystallinity and therefore entropy are changed, which in turn, influences the drug’s stability, solubility, dissolution rate and bio-availability. The quantity of water inside the crystal structure affects the strength, type, and number of intermolecular interactions inside the structure.
In pharmaceutical applications, Raman spectroscopy is often preferred for differentiating polymorphs. This technique is generally resistant to interference from free water, which makes it ideal for analyzing the hydration phases in both NS and DSCG. This method involves little or no sample preparation, meaning analysis can be carried out quickly without affecting the integrity of sample.
The molecular specificity of Raman spectroscopy makes it suitable for studying slight molecular variations in pharmaceutical materials in order to aid understanding and optimization of the drug delivery process.
Experimental Method
Both NS and DSCG were obtained for analysis. A GenRH microscopy humidity cell equipped with double glazed fused silica windows (Figure 2) was used to control the temperature and humidity of the samples, and the cell and Vapor generator were connected to a Renishaw Spectrometer.
The following parameters were followed for the experiment:
- Cumulation time 60s
- Humidity ramp-up rate 1% RH every 300s
- Humidity range 0% to 95% RH
- Dwell time 50 minutes at 95% RH
- Humidity ramp down rate -1% RH every 300s
- Spectral accumulation 1 spectrum every 600s (2% RH) rate
On fused silica slides, small quantities of each powder were placed and positioned within the humidity cell. No additional sample preparation was performed.
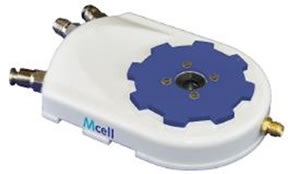
Figure 2. The GenRH M cell humidity cell
Results and Discussion
When a sample absorbs moisture, the intermolecular forces and structure within the sample adapt in order to accommodate the water molecules, which leads to changes in the molecular vibrational properties of the sample. These changes can be tracked by assessing variations in the Raman spectrum.
Nedocromil Sodium
At 0% to 13% relative humidity (RH), the Raman spectrum of NS was constant. Initial variations were observed, once the humidity was raised from 13% RH to 15% RH, as shown in Figure 3. At 13% RH, bands were observed at 1668cm-1 and 1655cm-1 and two bands were also observed at 1613cm-1 and 1625cm-1.
Close to 1400cm-1, two bands were observed at 1412cm-1 and 1399cm-1. The rise in humidity to 15% RH had several major effects. The peaks close to 1660cm-1, displayed the opposite relative intensities to those seen at 13% RH.
A number of peaks shifted to lower wave numbers and the peaks close to 1400cm-1combined to form a single broad band, centered at 1406cm-1. In the region from 1534cm-1 to 1588cm-1, significant variations were observed.
Weak bands at 1587cm-1 and 1561cm-1 and strong bands at 1574cm-1 and 1540cm-1 in the 13% RH spectrum resulted in a single powerful band at 1552cm-1 surrounded by two weaker bands at 1577cm-1and 1534cm-1 in the spectrum noted at 15% RH.
The regions 1530cm-1 to 1600cm-1 and 1350cm-1 to 1450cm-1 are related to the vibrational modes of the pyridine ring and carboxylate moiety, whereas bands near 1650cm-1 are associated with vibrations of conjugated carbonyls.
At 0% to 20% RH dynamic vapour sorption (DVS) data suggest that the drug takes up two moles of water for each mole of nedocromil sodium, as shown in Figure 4. This information compliments the Raman spectra, indicating that the molecular change that occurs from 13% to 15% RH is the conversion from the monohydrate state to the trihydrate state.
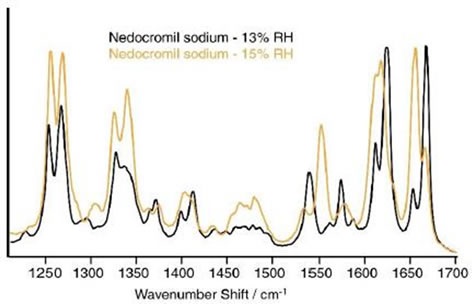
Figure 3. Spectra of nedocromil sodium at 13% and 15% RH. Clear differences are evident in various regions of the spectrum
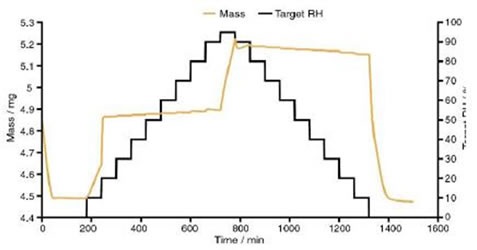
Figure 4. Dynamic vapour sorption data for nedocromil sodium
Based on the crystal structures of the heptahemihydrate and trihydrate, the carboxylate and carbonyl groups are the most strongly influenced by water coordination. Also, powder X-ray diffraction has revealed that the nedocromil sodium trihydrate has an extended pyridone carbonyl bond, indicating its interactions with Na+ions and water molecules.
The carboxylate groups have also been shown to change direction during the desorption and absorption of water, which explains the significant transformations in the regions 1530cm-1 to 1600cm-1 and 1350cm-1 to 1450cm-1.
The π-orbital overlap is affected by the angle of the carboxylate group to the pyridone ring, which, in turn, influences the Raman shift of the groups’ vibrations. The Raman spectra and mass from the DVS study remained approximately constant as the RH increased beyond 15% RH.
The DVS data showed a significant change in mass at 95% RH, as another two moles of water for each mole of NS were absorbed. The total number of moles of water increased to almost 5 for each mole of NS, suggesting that full transition to the heptahemihydrate had not occurred.
This transition was followed by substantial changes in the Raman spectrum after a period of 45 minutes at 95% RH. These transitions are shown in Figure 5.
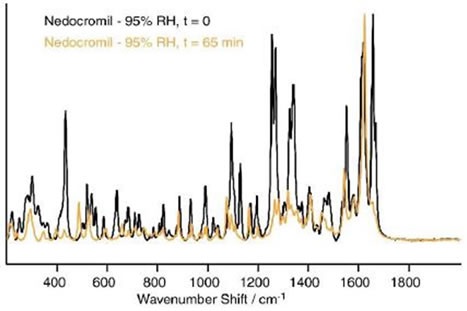
Figure 5 Differences in the spectrum of nedocromil sodium after 65 min at 95% RH.
A study performed by Grant et al. demonstrated that when RH increased, a rise in the pentahydrate stoichiometry was apparent. In the study, the presence of heptahemihydrate nedocromil sodium, trihydrate, and amorphous phase was shown through powder X-ray diffraction.
In the DVS study, decreased RH only caused a slight decrease in the sample mass over 95% to 10% RH range. As could be expected, only very few transformations were seen in the Raman spectrum over the same range.
When humidity was further reduced, DVS data showed a rapid decrease in water content, with four moles of water for each mole of nedocromil sodium being lost and giving one mole of water for each mole of NS at 0% RH.
The Raman spectrum remained similar and did not change back to the monohydrate spectrum that was originally observed. This suggests that desorption of water took place differently to absorption and possibly less efficiently, leaving the sample in an amorphous phase rather than a crystalline monohydrate.
Disodium Cromoglycate
It has been shown that for DSCG, decreasing the RH of the environment leads to decreases in both the water content and the crystallinity. This indicates that the change between the amorphous form and the crystalline form cannot be accurately defined.
The Raman data shows this gradual change across a range of humidities. Several changes were observed in the spectra at 0% to 70% RH, with the most obvious change occurring at approximately 1660cm-1, as shown in Figure 6.
These collections of peaks then stay constant up to 95% RH. The DVS data shown in Figure 7 reveals that after a prolonged period at 90% RH, 7 moles of water for each mole of DSCG were found in the drug.
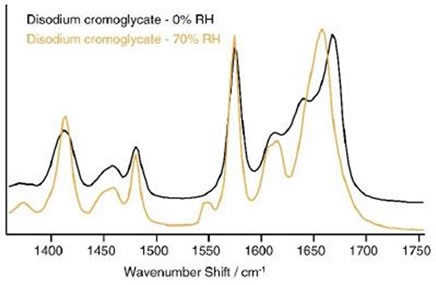
Figure 6. Spectral changes in disodium cromoglycate over the range 0% to 70% RH.
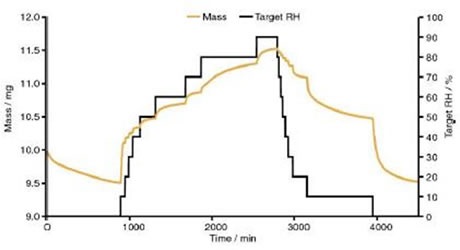
Figure 7 Dynamic vapour sorption data for disodium cromoglycate
Two structures solved for the sodium cromoglycate display similarities in packing arrangements and in most intramolecular bond angles and bond lengths. However, when the water content rises and the structure converts from one form to the other, the two carboxylate groups turn away from each other.
These data validate the spectral evidence shown here, given that it is the peak in the region of 1660cm-1 , which corresponds to the carbonyl stretch that changes the most. The increased angle between the ring systems and the carboxylate groups reduces the π-orbital overlap, which affects the Raman shifts of the carboxylate and carbonyl groups, as well as the delocalized system of electrons.
Conclusion
Raman spectroscopy is a suitable and sensitive technique that can be used with the GenRH-Mcell humidity cell to study molecular and structural changes as a function of RH. For both compounds studied, significant changes in spectra were clearly linked to changes in the intramolecular and intermolecular interactions, as the amount of water molecules in the crystal lattice increased.
Acknowledgement
Surface Measurement Systems Ltd wishes to thank Renishaw plc for gathering the data using their inVia confocal Raman microscope and for providing the images.
Thanks also to Dr. Paul Young, Department of Pharmacology, University of Bath, who kindly supplied the samples of disodium cromoglycate and nedocromil sodium, and for the DVS data for disodium cromoglycate.
References
- Chen LR, Young VG Jr, Lechuga-Ballesteros D, Grant DJW; J. Pharm. Sci.; (1999), 88 (11), 1191-1200
- Morris K, Rodriguez-Hornedo N; Encycl. Pharm. Tech., (1993), 7, 393-440
- Khankari RK, Chen L, Grant DJW; J. Pharm. Sci.; 1998, 87 (9), 1052-1071
- Hilfiker R, Berghausen J, Marcolli C, Szelagiewicz M, Hofmeier U; Eur. Pharm. Rev.; 2002, 7, 37
- Lin-Vien D, Colthup NB, Fateley WG, Grasselli JG; Infrared and Raman Characteristic Frequencies of Organic Molecules; Academic Press; 1991
- Freer A, Payling DW, Suschitzky JL; Acta Cryst; 1987, C43, 1900-1905
- Hamodrakas S, Geddes AJ, Sheldrick B; J Pharm Pharmacol; 1974, 26, 54-56
- Khankari RK, Ojala WH, Gleason WB, Grant DJW; J Chem Cryst; 1995, 25(12), 863-870
About Surface Measurement Systems Ltd
 Surface Measurement Systems Ltd develops and engineers innovative experimental techniques and instrumentation for physico-chemical characterisation of complex solids. We are the world leaders in Dynamic Vapor Sorption technology and Inverse Gas Chromatography instrumentation and solutions, providing professional world-class scientific and technical support for our international customers. By carefully controlling, measuring and analysing the physico-chemical interaction of vapors with solid samples such as powders, fibres and films, Surface Measurement Systems Ltd can help solve problems in research and development, such as stability studies and drying performance, through to manufacturing and quality control.
Our range of characterization instruments and scientific/engineering techniques has helped solve difficult problems in the pharmaceuticals, biomaterials, polymers catalysts, chemical, cosmetics and food industries, and are used by hundreds of leading laboratories and universities throughout the world.
Sponsored Content Policy: News-Medical.net publishes articles and related content that may be derived from sources where we have existing commercial relationships, provided such content adds value to the core editorial ethos of News-Medical.Net which is to educate and inform site visitors interested in medical research, science, medical devices and treatments.