Electron energy loss spectroscopy (EELS) is used to analyze the energy distribution of the electrons that are passing through a thin sample and interacting with it inelastically. EELS is a robust technique that can provide chemical and electronic data from specific areas in the sample.
Methods for collecting spatial information
It is possible to obtain spatial information using two methods. The first approach involves integrating EELS into a scanning transmission electron microscope (STEM) where the region of interest in a sample is scanned by an electron probe and a spectrum image (SI) is obtained by acquiring an EELS spectrum point by point across the scan.
Using energy-filtered transmission electron microscopy (EFTEM) is the second approach, where a special spectrometer is used to filter the energy released by the electrons that have entered into an interaction with the sample. Concentrating on a specific ionization edge allows constructing images that depict a 2D distribution of a specific element.
TEM analysis of unstained biological materials is conventionally hard to perform as these materials have very little contrast and high sensitivity to the electron beam. The electron beam can easily damage the sample if the experiment is not performed carefully.
Although carbon represents nearly 100% of biological materials, trace amounts of other elements can be observed in them, in some regions. The collection efficiency and high sensitivity to light element make EELS ideal for studying such materials.
Experimental procedure
EFTEM and EELS SI methods can be applied to determine the elemental distribution throughout a specific region in a sample collected from human autopsy tissue. The specimen was fixed in glutaraldehyde and formalin, post fixed in uranyl acetate and osmium tetroxide, dehydrated in propylene oxide and ethyl alcohols, and embedded in epoxy resin.
The PECS instrument was used to apply 5Å carbon coating on both sides of the TEM sample to avoid any charging effect caused by the electron beam traversing through the specimen.
Dr. Wenlang Lin at Mayo Clinic in Jacksonville, Florida, provided the TEM samples. The same region in the TEM sample was investigated in EFTEM as well as in EELS SI modes. This experiment used a TEM microscope featuring a LaB6 electron source and operating in STEM mode and a 10nm probe with 1.6nA/cm2 current density. The region selected for both experiments reveals the existence of a feature, which has been determined as a cell nucleus.
Results
TEM images obtained from biological specimens have very little contrast. The image contrast can be significantly improved through energy filtering and as a result, details that seem to be missing in the unfiltered image can now be observed (Figure 1).
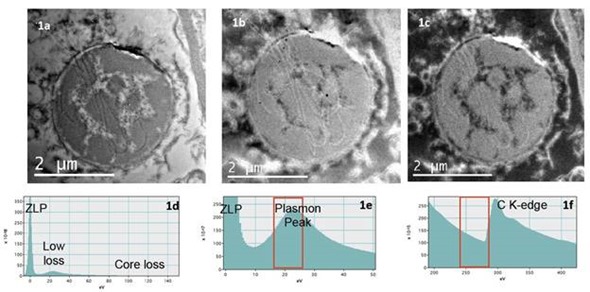
Figure 1a is an unfiltered TEM bright field image. All the scattered electrons both inelastically and elastically contribute to the image as shown in Figure 1d. Figure 1b is a plasmon filtered TEM image. Here only the electrons selected in the 25eV window placed in the plasmon region as shown in Figure 1e contribute to the image. Figure 1c is obtained by placing the 25eV slit in the region of the EELS spectrum prior to the C K-edge as shown in Figure 1f. The position of the slit in the EELS spectrum determines which electrons contribute to the image.
Images can be obtained with the intensity in correlation with the concentration of a particular element by choosing an energy window around an ionization edge. The next step is superimposing the signal of this element on other signals, including thickness variation, elastic contrast, diffraction contrast, and most significantly the background.
It is possible to remove the background using two different methods, namely the two window and three window approaches. In the first method, the filtered image collected immediately after the ionization edge is divided by the one collected from the area before the edge in order to form the image.
In the second approach, two images before the edge provide the background contribution that can be identified by the power law. The slit’s position and width greatly influence the background removal before the ionization edge.
The selection of these two conditions identifies the background size and eventually the error subsequent to its removal. The best approach to handle this issue is acquiring a battery of images where scanning the slit position for each image is carried out over a specific region in the EELS spectrum.
This is known as EFTEM SI. Besides pure filtered images, spectroscopy data can also be obtained from the EFTEM SI stack. It is possible to extract an EELS spectrum everywhere across the series of images and place the background accordingly to realize the best fit (Figures 2 and 3).
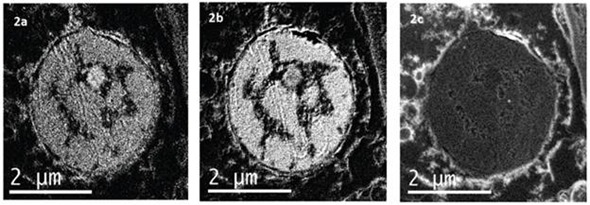
Figures 2a, b, c show the N K-edge at 401 eV, the P L2,3-edges at 132eV and the Cl L2,3-edges at 200eV elemental maps respectively. Each map was extracted in EFTEM SI mode. 10eV slit was scan over a region of the EELS spectrum between 90 – 230eV. The P and Cl elemental maps are extracted from this EFTEM SI stack. The N elemental map was extracted from another EFTEM SI stack where 15eV slit was scan from 320 – 430eV. 10eV and 15eV width slits were used as they represent the best compromise between two factors: the slit should be narrow enough to avoid edge overlap, but it should be large enough to provide adequate counting statistics.
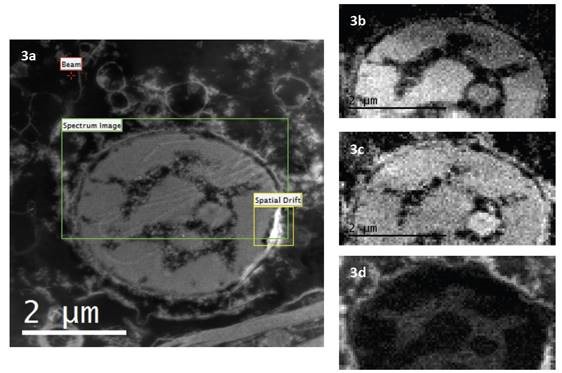
Figures 3a, b, c show the N K-edge at 401 eV, the P L2,3-edges at 132eV and the Cl L2,3-edges at 200eV elemental maps respectively. Each map was extracted in EFTEM SI mode. 10eV slit was scan over a region of the EELS spectrum between 90 – 230eV. The P and Cl elemental maps are extracted from this EFTEM SI stack. The N elemental map was extracted from another EFTEM SI stack where 15eV slit was scan from 320 – 430eV. 10eV and 15eV width slits were used as they represent the best compromise between two factors: the slit should be narrow enough to avoid edge overlap, but it should be large enough to provide adequate counting statistics.
About Gatan Inc.

Gatan, Inc. is the world's leading manufacturer of instrumentation and software used to enhance and extend the operation and performance of electron microscopes.
Gatan's products, which are fully compatible with all brands of electron microscopes, cover the entire range of the analytical process from specimen preparation and manipulation to imaging and analysis.
Our customer base spans the complete spectrum of end users of analytical instrumentation typically found in industrial, governmental and academic laboratories.
The applications addressed by these scientists and researchers include metallurgy, semiconductors, electronics, biological science, new materials research and biotechnology.
The Gatan brand name is recognized and respected throughout the worldwide scientific community and has been synonymous with high-quality products and the industry's leading technology.
Sponsored Content Policy: News-Medical.net publishes articles and related content that may be derived from sources where we have existing commercial relationships, provided such content adds value to the core editorial ethos of News-Medical.Net which is to educate and inform site visitors interested in medical research, science, medical devices and treatments.