Pharmaceutical manufacturing practices are advancing towards a future in which continuous manufacturing processes will be the norm. Developing and applying such techniques is therefore an essential part of long-range planning in this field.
The advantages of continuous manufacture are obvious, including lower running costs, less waste of expensive materials and higher adaptability to changing demands. One of the front-runners in this race is Twin-Screw Granulation (TSG) which allows for both standard and customized dosage forms to be manufactured within a replicable and uniform manufacturing process, ensuring high quality.
The use of TSG enables the manufacturer to put together the materials within a processing volume with throughputs which can be adapted to a large range. It also makes manufacturers lives easier as they can start with just one TSG instrument, and have this run continuously throughout the whole granulation process.
The implementation of this technology is yet not present everywhere, but it is important to realise that the benefits of the process are far greater than the challenges, and rather TSG makes the challenges manufacturers in the transition to continuous granulation both fewer and smaller.
For example, with TSG we face the idea that greater advancement on current process knowledge is required to run continuous equipment and perform nonstop processing using TSG. This knowledge typically exists with batch technologies that are already up and running, such as high-shear granulation or fluid bed. However, on the upside the continuous processes can be designed using recognized and established quality by design (QBD) approaches. This would allow for products to be ready for release immediately after leaving the manufacturing process., making the TSG method highly efficient in this respect.
This article shows important components of a wide-based experimental setup in which a process map is being planned based on data, to use TSG with the benchtop Thermo ScientificTM Pharma 11 Twin-screw Extruder and an Eyecon2™ Particle Analyser system. The Eyecon2 is an inline process analytical technology (PAT) device from Innopharma Technology which operates in the real-time process.
The role played by PAT to produce a drastic reduction in time needed to execute a defined DOE, and analyze it is illustrated by these experiments, in addition to the demonstrated advantage of gaining additional data that would not have been feasible with conventional offline analysis.
Experimental Plan
The basis of the present experiments was the use of different inputs to produce a placebo formulation with the twin-screw extruder. The particle sizes that were generated from these operations were subject to real-time monitoring with the Eyecon2, as well as sampled for subsequent offline analysis as well. The use of TSG meant that the process ran continuously with the least possible settling time, allowing for change of input parameters during the operation, thus making the DOE both fast and efficient.
The following parameters were changed during the run:
- Throughput rate
- Liquid-to-solid ratio (L/S)
- Speed of the screw
- Screw configuration
The existing knowledge of the Pharma 11 extruder and of the formulation chosen was the foundation on which the design space was built, comprising lower and upper practicable values for each of these parameters as well as two intermediate values for each. With each experimental run, a different parameter was varied keeping the others constant at mid-range values. Table 1 displays all the combinations of parameters which were employed in this series of tests.
Table 1. List of Extruder Parameters for Each Experiment
| Experiment |
Throughput Rate |
L/S |
Screw Speed |
Screw Configuration |
| 1 |
2.0 kg/h |
18% |
500 RPM |
sc2F30 |
| 2 |
2.0 kg/h |
20% |
500 RPM |
sc2F30 |
| 3 |
2.0 kg/h |
25% |
500 RPM |
sc2F30 |
| 4 |
2.0 kg/h |
28% |
500 RPM |
sc2F30 |
| 5 |
1.0 kg/h |
20% |
300 RPM |
sc2F30 |
| 6 |
1.0 kg/h |
20% |
500 RPM |
sc2F30 |
| 7 |
1.0 kg/h |
20% |
700 RPM |
sc2F30 |
| 8 |
1.0 kg/h |
20% |
900 RPM |
sc2F30 |
| 9 |
0.5 kg/h |
20% |
700 RPM |
sc0 |
| 10 |
0.5 kg/h |
20% |
700 RPM |
sc1F30 |
| 11 |
0.5 kg/h |
20% |
700 RPM |
sc2F30 |
| 12 |
2.4 kg/h |
20% |
500 RPM |
sc0 |
| 13 |
2.4 kg/h |
20% |
500 RPM |
sc1F30 |
| 14 |
2.4 kg/h |
20% |
500 RPM |
sc2F30 |
| 15 |
2.4 kg/h |
20% |
500 RPM |
sc3F30 |
| 16 |
2 kg/h |
20% |
500 RPM |
sc1F30 |
| 17 |
2 kg/h |
20% |
500 RPM |
sc1F30 |
| 18 |
2 kg/h |
20% |
500 RPM |
sc1F30 |
| 19 |
3 kg/h |
20% |
500 RPM |
sc1F30 |
Materials and Equipment
For this experiment, a commonly used pre-mixed solid placebo was utilized, the contents of which are shown in Table 2. The liquid added to the formulation was water because the blend already contained PVP 30 as the binder. The variation between the input and the processed material is seen in Figure 1.
Table 2. Formulation
| . |
. |
| PVP 30 |
5% |
| Corn Starch |
32 % |
| Lactose |
62.8 % |
| Talcum |
0.2 % |
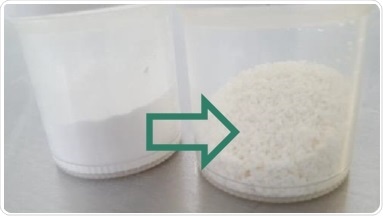
Figure 1. Material Before and After Granulation
The twin-screw extruder used here was the Pharma 11 from ThermoFisher Scientific, which granulates material on a laboratory scale for both hot melt extrusions and wet granulation processes. The throughput rate is very low and thus enables experimental runs using a small amount of expensive API. The full range of ThermoScientific twin-screw granulators has a scale-up design with respect to the screws as well as the barrels, so that the process rate can be moved up or down with ease. In the current setup the wet granulation configurator of the Pharma 11 was used.
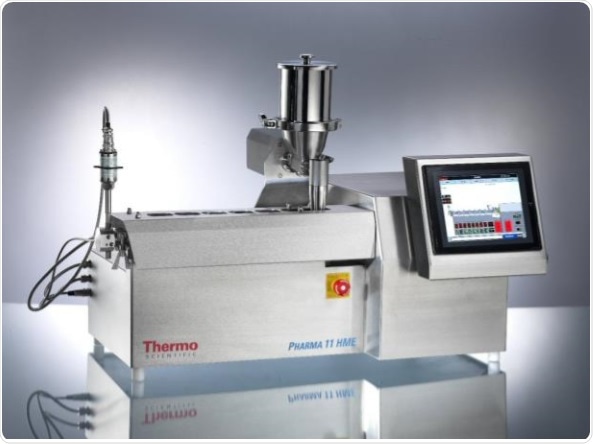
Figure 2. Pharma 11 Twin-Screw Extruder
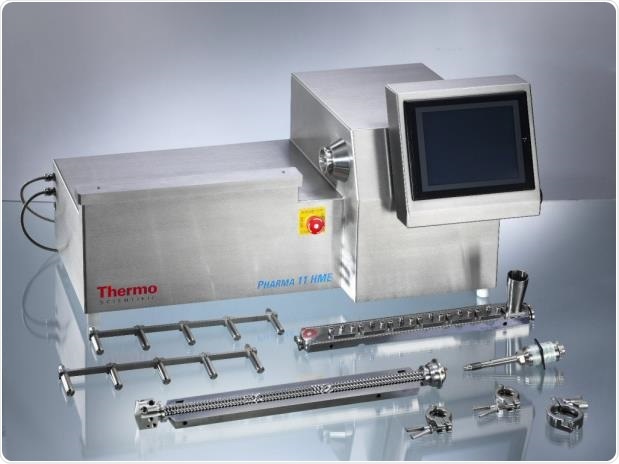
Figure 3. Pharma 11 Extruder Disassembled for Cleaning
Real-time granule size was monitored using the Eyecon2 from Innopharma, fitted on the twin-screw outlet. This device uses direct imaging to visualize either free-flowing or static materials, and then analyzes the acquired images using advanced technology to generate a report on the distribution of the particle size. This analyzer can be applied for a growing spectrum of pharmaceutical processes, such as fluid bed coating with granulation, milling, or twin-screw granulation, in all of which it significantly cuts down the time required for analysis and speeds up the acquisition of data on the process from the point of development to commercial manufacturing.

Figure 4. Eyecon2 Imaging & Illumination Hardware

Figure 5. Eyecon2 in At-line Configuration
Innopharma has also brought out integration devices which are custom-built to fit the Eyecon2 analyzers to the specific process equipment of different clients. The availability of these devices reduces interference with the operational run but optimizes the flow of material, avoiding fouling which could hamper material movement, as well as its presentation at the measuring point where the output from the granulator is assessed. Fouling may often be a risk in such processes because of the potentially high moisture content of the granulator output which promotes its adhesion to the surface over which it flows. Ensuring appropriate flow allows for very repeatable and precise data acquisition. The present experiment used placebo, and did not make provision to meet GMP requirements, thus avoiding the use of containment measures and opting for the use of rapid-prototyping methods. At the same time the design may be readily shifted to one which is GMP-compliant and fully contained, to handle hazardous category APIs.
In order to achieve the required level of accuracy in measurement, the integration device was built to direct the particle flow straight from the twin-screw to a stream running before the image capturing area of the Eyecon2 but within its focal depth. Fouling is prevented by using 316l stainless steel with a high polish for all surfaces in contact with the granulated material, as well as active heating elements which helps to keep condensation at bay. Figures 6-8 show the device design, with the Eyecon2 fitted on the end of the granulator to measure the particle size.
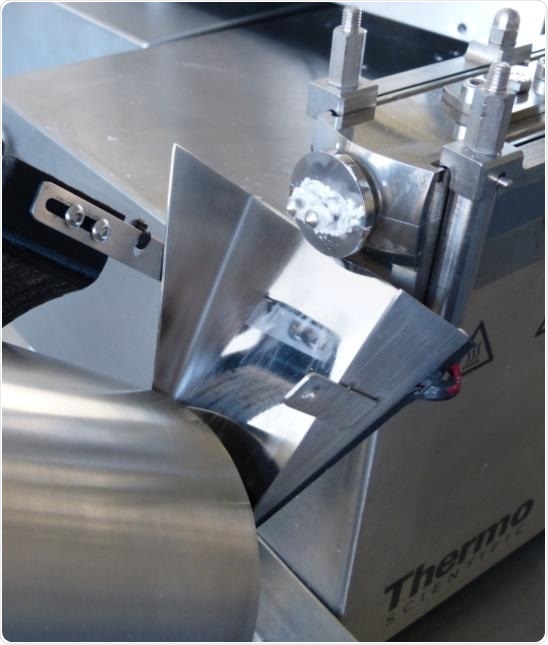
Figure 6. Eyecon2 Particle Analyser with Integration Device in-place on Pharma 11 Extruder in Granulation Mode (View 1)
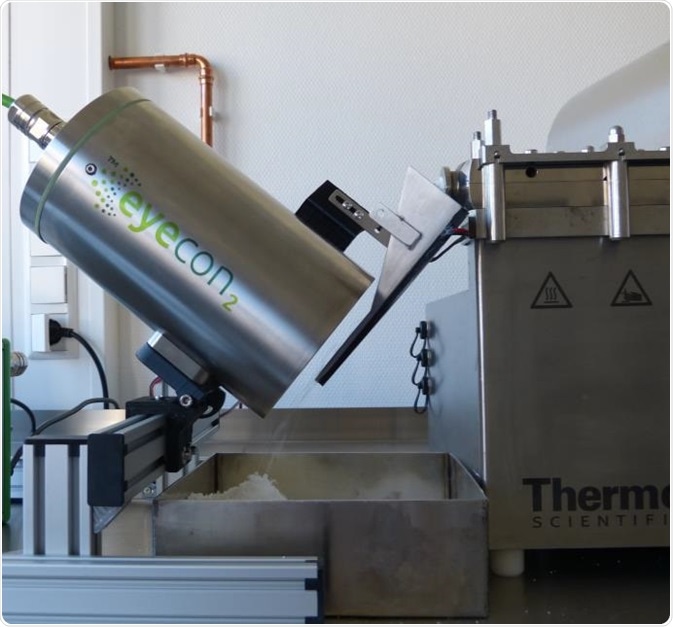
Figure 7. Eyecon2 Particle Analyser with Integration Device in-place on Pharma 11 Extruder in Granulation Mode (View 2)
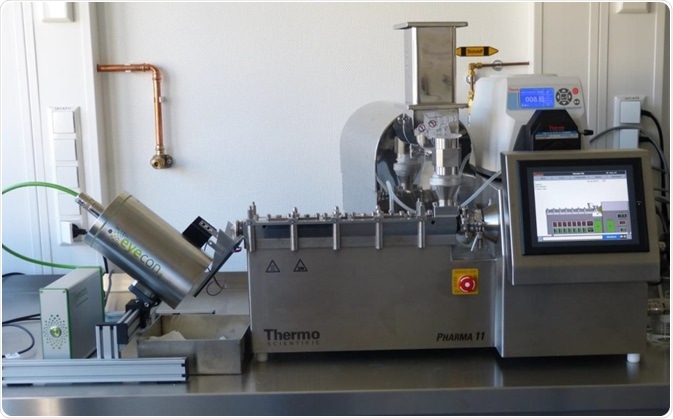
Figure 8. Eyecon2 Particle Analyser with Integration Device in-place on Pharma 11 Extruder in Granulation Mode (View 3)
Results and Discussion
Changes in Various Parameters
The following table presents the format in which the results of increasing various process parameters from the list above in a series of runs are shown:
Parameter Change
Table 3. Explanation of Parameter Change Tables
| Particle Size Distribution |
Dv,50 |
Oversize Particles |
Fines |
Density of Granules |
| Distribution width |
50 % of mass/volume smaller than this value |
> 1500 μm |
< 300 μm |
+ / - |
- The Particle Size Distribution (PSD) in the first column shows the distribution width in terms of three trends: increasing, decreasing or unaltered width with parameter increase
- The Dv,50 column shows the mass median diameter change with parameter increase, in terms of increase or decrease
- The Oversize particles and Fines columns show whether there is an increase or decrease in the size range as shown in the header with parameter increase
- The Density of Granules column shows how the parameter increase affects the granule density, from a calculated estimate based on existing literature, because this data could not be acquired from this experiment.
Increasing Liquid-to-Solid Ratio
Table 4. Effects of Increasing L/S Ratio
| Particle Size Distribution |
Dv,50 |
Oversize Particles |
Fines |
Density of Granules |
| 0 |
+ |
+ |
- |
+ |
| |
[Thompson2010] |
[Keleb2004] |
[Beer2014] |
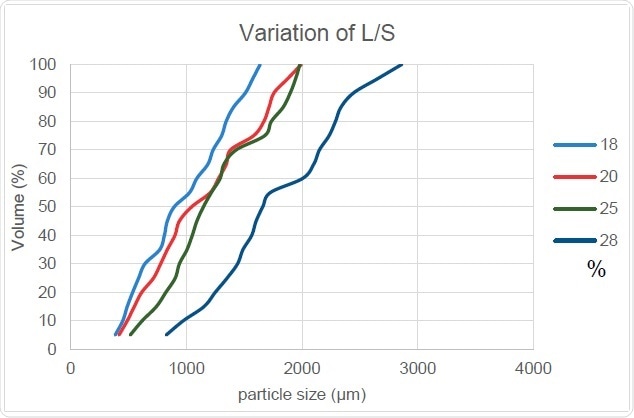
Figure 9. L/S Ratio’s Effect on PSD
Figure 9 shows how the cumulative particle size increases with an increase in the ratio of liquid to solid. This is because the granule size increases as more liquid is added and confirms the positive correlation between the Dv,50 and Oversize Particles columns while Fines are negatively related. The slope of this curve also remains generally unchanged which shows that particles size distribution width does not undergo any significant change with increasing liquid-to-solid ratio.
The report of Beer (2014) reveals that granules produced with a higher proportion of liquid to solid will have higher density, which in turn leads us to conclude that the ease and speed of dissolution of these granules will be reduced overall. This means that the addition of liquid to adjust the granule size expected from this process must be carefully regulated with due consideration of its other effects.
Increasing Screw Speed
Table 5. Effects of Increasing Screw Speed
| Particle Size Distribution |
Dv,50 |
Oversize Particles |
Fines |
Density of Granules |
| - |
- |
- |
0 |
|
| |
[Thompson2010] |
|
|

Figure 10. Screw Speed Effect on PSD
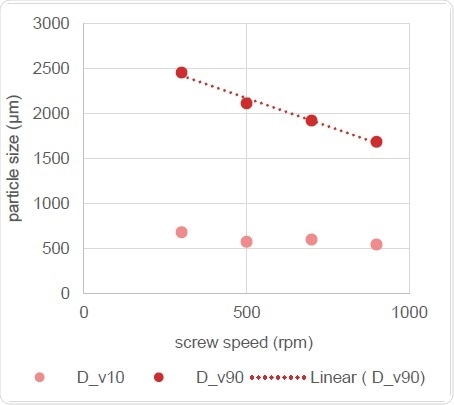
Figure 11. Correlation of Particle Size with Screw Speed
The effect of changing the screw speed is also reflected in particle size and distribution width, as Figure 10 shows, with the curve shifting to the left with increase in screw speed. In turn, this causes the Dv,50 and Oversize Particles readings to reduce, but leaves the point of origin of the cumulative curves seen at bottom left virtually unchanged. In other words, this change does not affect the amount of Fines finally generated. However, the slope of these curves does steepen with screw speed increases, showing that the particle size distribution width is reduced.
Figure 11 makes it clear that screw speed is related to the volume of change in particle size distribution, with the Dv,50 showing a linear reduction as the speed of the screw increases.
Increasing Number of Kneading Zones
When the screw configurations are changed as shown in Figures 11-14, the number of kneading zones is increased from 1 to 3. The number of mixing zones is indicated in the screw configuration name, while the F30 suffix shows that the forward mixing angle of that screw is 30°.
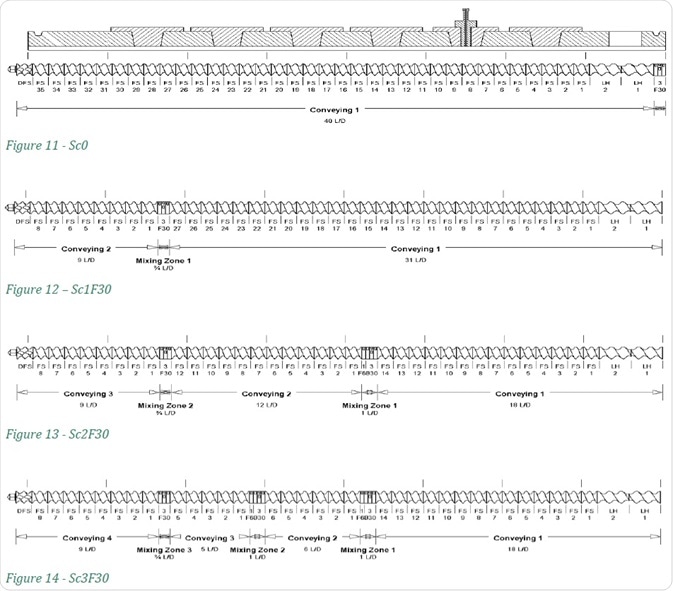
Table 6. Effects of Increasing Number of Kneeding Zones
| Particle Size Distribution |
Dv,50 |
Oversize Particles |
Fines |
Density of Granules |
| |
+ |
+ |
- |
+ |
| |
|
|
|
[Djuric2008] |
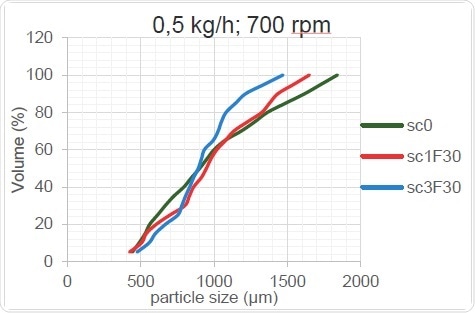
Figure 15. Kneading Zone’s Effect on PSD (low throughput rate)
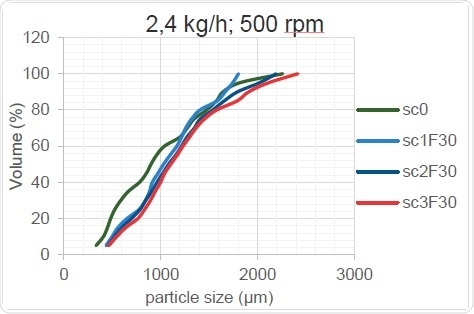
Figure 16. Kneading Zone’s Effect on PSD (high throughput rate)
As Figure 15 and Figure 16 show, the change in screw configuration results in high and low throughputs for the granulator. When the throughput increases, the overall particle size increases, probably because the thoroughness of mixing decreases when less material is present in the screw. The mixing element cannot work as well when too little material is provided, as sufficient shear forces are not created within the material and the overall size of the granulated particles remains unchanged after passing through the TSG when it acts as a mere conveyor. On the other hand, when the barrels are optimally filled, the shear force is increased, the powder agglomerates better and the particle size increases.
Table 6 shows the trends which can be clearly seen only at higher throughputs and which can occur only when the material flow crosses a critical lower limit.
Benefits of Inline Measurement
The inline measurements provided by the use of the PAT device are demonstrably beneficial. For one thing, process changes with time become much clearer without the need to test samples at separate points. This helps achieve better understanding of the temporal changes to be expected with such a process. At the same time, it shows up some disadvantages of offline methods of measurement, such as sieve analysis, as seen in the graphs below.
In Figure 17, the Dv,50 of a process in relation to time is seen, showing how the particle size changes over the period of the process from about 1000 μm to approximately 2300 μm. The first temporal change is relatively large, followed by variations of about 500 μm throughout the measurement period. Offline measurement of such a sample cannot reveal this time-bound fluctuation, and the results are significantly dependent upon the time at which the sample is taken for testing. This can in turn vitiate the conclusions drawn relating to the generated product, especially if the sample for testing was taken during the periods circled on the graph.
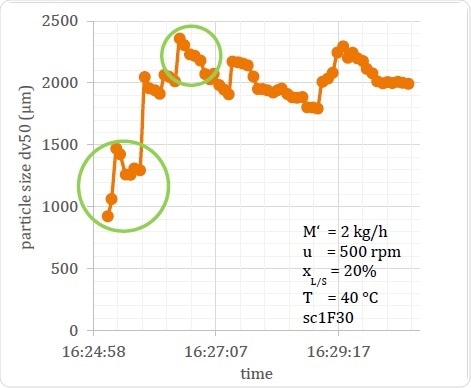
Figure 17. Example of Output Material Variation
A compensation is often attempted for this drawback by taking multiple samples to find the mean of the particle size as well as to define the variability of the process over time. This does offer the possibility of correction of measurement errors, but at the cost of increased costs for testing.
In Figure 18 a process in an unstable state is shown, in which the amount of water added at the startup phase was excessive. This made the material too wet, causing the particle size to shoot up. However, this was self-corrected in about 7 minutes. The point is that this would not have been known without real-time inline measurement, as the fact of the process being in an unstable state would not be detected. Inline measurements are also the only way in which the period of startup instability can be measured with accuracy.
In this example it is clear that inline measurement helps to regulate the process, allows unstable states to be detected during the process, and thus allows for correction of the process flow or for diversion of the material as required. Finally, it helps to design optimal start-up procedures by drawing attention to the occurrence of such beginning phase process instabilities as well as how long they last.
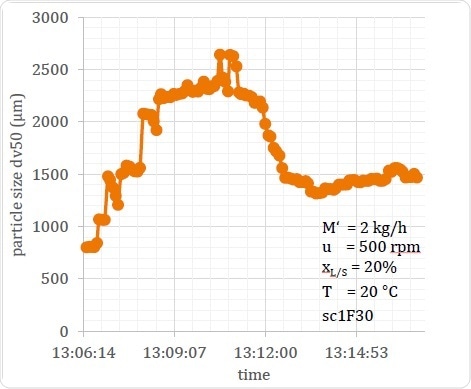
Figure 18. Example of an Extended Unstable Start-up Condition
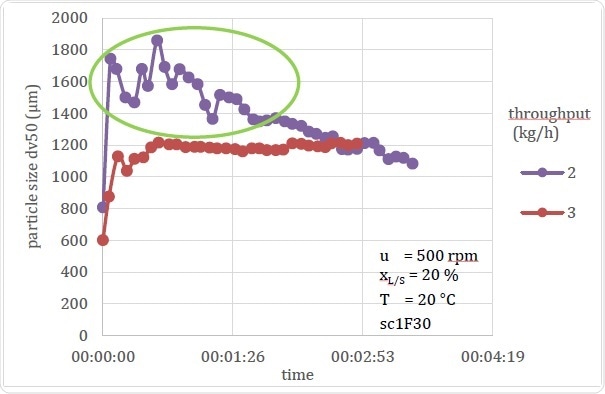
Figure 19. Comparison of Stable and Unstable Processing Conditions
Figure 19 shows another instance in which a process undergoes changes that could quite possibly be liable to wrong conclusions if only offline data are available. These graphs show how throughput can affect the particle size. The first one shows data from the 3 kg/h throughput setup which corresponds to previous experimental data on similar throughput rates; however, the second one at 2 kg/h showed that the Dv,50 for this experiment continued to show instability, perhaps because the barrel contained too much dampness from the previous experiment.
If an offline measurement had been recorded at about 2 or 3 minutes, which is the average time required for settling as seen in other similar experiments, it would have shown the particle size to be increased as the throughput was reduced. This would go against the expected results, but the reason would be apparent on a glance at the temporal data – that is, the error was due to the instability in the process. This same conclusion would take far longer using offline sampling, which would require repetition of the process for much longer and taking many more samples for measurements so as to define the time and parameters of the process instability and when it reached steady state conditions.
Conclusions
This experiment to establish the roles of various parameters in changing the output in the TSG process resulted in establishing the crucial nature of two parameters:
- The ratio of liquid to solid
- The level of filling of the screws which in turn depends upon the speed, configuration and throughput
Again, it was possible to draw some conclusions about the apparatus used:
- The use of the PAT is immensely valuable in analyzing, developing and increasing the scale of a continuous process
- Inline measurement is to be preferred to at-line measurement particularly with regard to process development, because it shows the time and degree to which fluctuations and instabilities occur in the process, unlike offline sampling methods. In short, the following benefits are apparent:
- It allows critical parameters for the process to be easily and conveniently identified
- It makes it simpler to troubleshoot at the point of difficulty
- It helps delineate efficient startup procedures to avoid such instabilities and variations
- It gives increased possibilities of process regulation
- It prevents the drawing of wrong conclusions from the data as a result of temporal fluctuations in the process over time
- It gives better insight into how the process operates
- It helps understand the overall picture as to how the process operates
- It speeds up the development time of the process.
- TSG being a continuous process has the immense advantage of allowing the process to be developed and refined in real-time. Thus the process parameters may be repeated very quickly to gauge the effects of alterations made while the process is running. The geometric scale design of the full range of ThermoScientific Pharma extruders allows for steep reductions in the time taken to optimize the process, the labor involved and the materials used when a manufacturing process is to be scaled up using this device.
References and Further Reading
- [Beer2014] Beer, P., Wilson, D., Huang, Z., & De Matas, M. (2014). Transfer from high-shear batch to continuous twin screw wet granulation: A case study in understanding the relationship between process parameters and product quality attributes. Journal of Pharmaceutical Sciences, 103(10), 3075–3082. http://doi.org/10.1002/jps.24078
- [Djuric2008] Djuric, D., & Kleinebudde, P. (2008). Impact of screw elements on continuous granulation with a twin-screw extruder. Journal of Pharmaceutical Sciences, 97(11), 4934–4942. http://doi.org/10.1002/jps.21339
- [Keleb2004] Keleb, E. I., Vermeire, A., Vervaet, C., & Remon, J. P. (2004). Twin screw granulation as a simple and efficient tool for continuous wet granulation. International Journal of Pharmaceutics, 273(1-2), 183–194. http://doi.org/10.1016/j.ijpharm.2004.01.001
- [Thompson2010] Thompson, M. R., & Sun, J. (2010). Wet granulation in a twin-screw extruder: Implications of screw design. Journal of Pharmaceutical Sciences, 99(4), 2090–2103. http://doi.org/10.1002/jps.21973
About Thermo Fisher Scientific – Materials & Structural Analysis
 Thermo Fisher Materials and Structural Analysis products give you outstanding capabilities in materials science research and development. Driving innovation and productivity, their portfolio of scientific instruments enable the design, characterization and lab-to-production scale of materials used throughout industry.
Sponsored Content Policy: News-Medical.net publishes articles and related content that may be derived from sources where we have existing commercial relationships, provided such content adds value to the core editorial ethos of News-Medical.Net which is to educate and inform site visitors interested in medical research, science, medical devices and treatments.