Chirality is a phenomenon exhibited by both naturally occurring and synthetic molecules – it refers to the natural handedness of the molecule and can have important implications in the biological activity and metabolism of these compounds. The molecular structure of a chiral drug can occur in two enantiomeric forms (Figure 1). While one enantiomer can impart beneficial effects, the other can exhibit significantly diminished efficiency, and in some cases potentially adverse properties.1 This dichotomy was exemplified in the case of thalidomide, a pharmaceutical given to pregnant women in the 1950s to alleviate morning sickness.
The drug proved effective, but it was later discovered that it also displayed disastrous teratogenic side effects, resulting in babies born with absent or deformed limbs, respiratory issues, and decreased life expectancy.2 Thalidomide was sold as a racemate, meaning it contained both enantiomers in a 50:50 ratio.
The investigations that followed revealed that while the (R)-(+)-enantiomer of thalidomide was safe, the (S)-(−)-enantiomer had serious toxic and teratogenic effects. As a result, almost 75% of new drugs entering the market are sold as a single enantiomer rather than a racemic mixture, with the quantity of single-enantiomer drugs in the market increasing rapidly.3 Hence, the swift identification and differentiation of chiral molecules is increasingly important to synthetic, medicinal, and biological chemistry.
Identifying and differentiating enantiomers is complicated by the fact that both forms display identical chemical and physical properties, except for their capacity to rotate plane polarized light. Nuclear Magnetic Resonance (NMR) spectroscopy is a powerful tool to acquire chiral information by utilizing chiral derivatizing or solvating agents to generate complexes that can differentiate between the two enantiomers.
Even with extra sample preparation, NMR spectroscopy offers an easy and quick alternative to X-ray crystallography or chiral chromatography. However, this powerful method is significantly underutilized because of the capital expenditure, substantial operating cost, space, and power consumed to sustain and run a traditional, super-conducting high-field NMR spectrometer.
A recently published chemosensory method employs fluorinated metal-ligand complexes to deduce the chirality of various amines by 19F NMR spectroscopy.4 The ligand produces a chiral environment in which the binding of enantiomeric amines creates “static” diastereomeric complexes on the NMR timescale with distinct and characteristic 19F NMR shifts (Figure 2).
Fluorine-19 is an exceptional nuclide for this purpose thanks to its high sensitivity, 100% natural copiousness, and characteristically well resolved, naturally sharp resonances.5 Herein, we detail the use of this powerful, cost-saving method with a benchtop NMR spectrometer to afford an accessible and reasonable amine chirality quantification tool. The benchtop NMR spectrometer can differentiate between enantiomers of chiral amines, concurrently sense multiple chiral amines, and approximate the enantiomeric ratio (er) and enantiomeric excess (ee).
Identification and Differentiation of Chiral Amines
The identification of different chiral amines was achieved by employing palladium complex 1 and 19F NMR spectroscopy. As illustrated in Figure 3, complexation of the chiral amines results in the appearance of a distinct and characteristic 19F NMR resonance (the peaks are doublets due to coupling with the adjacent proton on the ligand pendant arm). The enantiomers of α-methylbenzylamine (Figure 3a – c) and α-ethylbenzylamine (Figure 3d – f) can be undoubtedly differentiated in racemic mixtures.
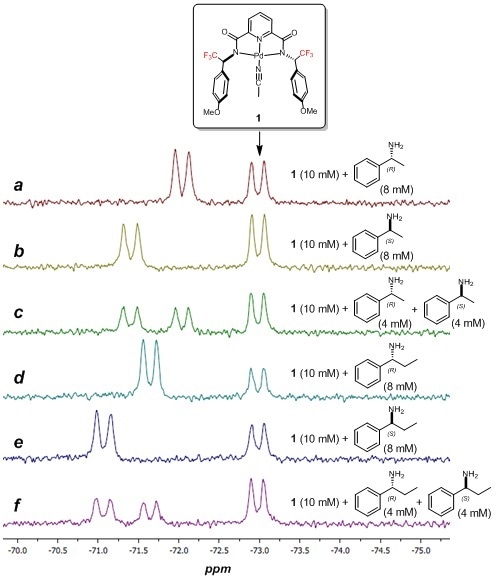
Figure 3. Chemical structure of palladium complex 1 with fluorine probes. a – c) 60 MHz 19F NMR spectra (64 scans) of complex 1 with enantiomers of α-methylbenzylamine. d – f) 60 MHz 19F NMR spectra (64 scans) of complex 1 with enantiomers of α-ethylbenzylamine.
Simultaneous Sensing of Multiple Chiral Amines
As illustrated in Figure 4a and 4b, multiple enantiomers can be identified simultaneously using complex 1. Each enantiomer produces a resonance at the same chemical shift observed in the single-enantiomer spectra, enabling the straightforward identification of each peak. Combining the four analytes (both enantiomers of each of the two chiral amines) resulted in overlapping peaks as demonstrated in Figure 4c. Although individual peaks were not easily identified, the spectrum clearly exposed the existence of multiple chiral species. Using a peak-fitting tool (offered in most NMR processing software)6 the overlapping peaks can be deconvoluted, allowing for the identification of each individual peak as seen in Figure 4d.
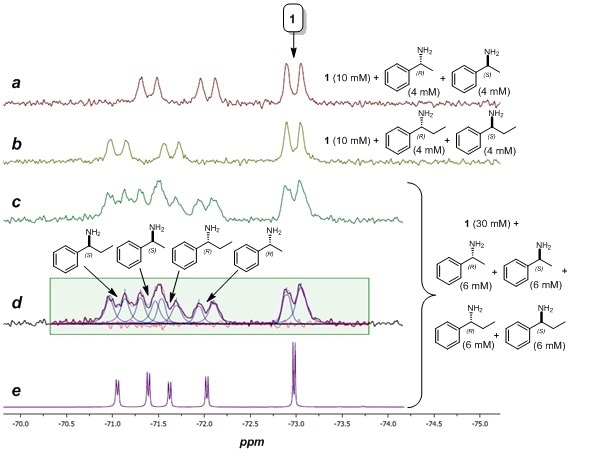
Figure 4. a – c) 60 MHz 19F NMR spectra (64 scans) of complex 1 with mixtures of chiral amines. d) Peak fitting results of spectrum 4c (black = actual spectrum; blue = simulated peaks; magenta = sum of simulated peaks; red = residual error). e) 400 MHz 19F NMR spectrum (64 scans) of same sample as spectrum 4c.
For contrast, Figure 4e shows a high-field 19F NMR spectrum of the same sample as in Figure 4c. Predictably, while both spectra comprise identical information, the NMR spectrum logged on a 400 MHz instrument showed better peak dispersion than the spectrum recorded on the 60 MHz benchtop instrument.
Estimation of Enantiomeric Ratio (er) and Enantiomeric Excess (ee)
Owing to the characteristically quantitative nature of NMR spectroscopy, the concentration of each species present in the sample can be projected by integrating the NMR peaks directly7 Figure 5 shows the 19F NMR spectra of complex 1 with a sequence of mixtures of (R)-α-methylbenzylamine and (S)-α-methylbenzylamine with different enantiomeric ratios. Integrating the peaks of the two enantiomeric amines and likening their areas gave an approximation of the enantiomeric ratio (er) and enantiomeric excess (ee), as shown in Figure 5.
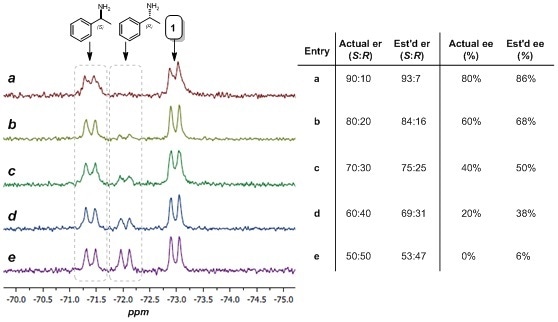
Figure 5. Estimation of er and ee using 19F NMR spectroscopy. Left: 60 MHz 19F NMR spectra (64 scans) of complex 1 (ca. 10 mM in CDCl3) with (R)-α-methylbenzylamine and (S)-α-methylbenzylamine (ca. 8 mM total). Right: Actual and estimated er and ee values.
Using the relative integral values as a rough estimation, the er values attained by this technique are correct within 10% while the ee values gained by this method are correct within 20%. Essential to this method is the procurement of only a single NMR spectrum and can rapidly deliver a good estimate of the er and ee of a sample within a couple of minutes.
If greater accuracy is required, a calibration curve can be created as illustrated in Figure 6. This process can more precisely account for any error in the measurement. The estimated er and ee values attained by the method above exhibits a linear relationship with the actual er and ee values. This enables the original estimate to be further attuned towards a more accurate value.
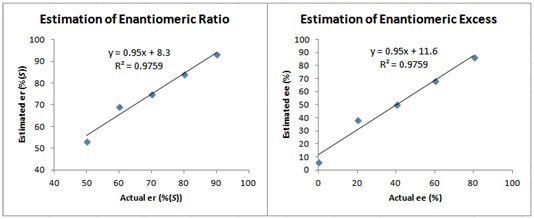
Figure 6. Calibration curves obtained from the data displayed in Figure 5 showing the linear relationship between actual and estimated er and ee values.
Conclusion
The compact footprint, low-cost, and ease-of-use of a benchtop spectrometer in tandem with the cleverly considered palladium pincer chemosensor permitted the easy and straightforward analysis of chiral amines via 19F NMR spectroscopy. The chiral sensing technique presented allowed the identification, differentiation, and quantification of multiple chiral amines without any extravagant derivatization. This chemosensory method, in combination with a benchtop NMR spectrometer, has the potential to hasten advances in synthetic and medicinal chemistry by simplifying the rapid analysis and quantification of enantiomers.
References and Further Reading
- Solomons, T. W. G.; Fryhle, C. B.; Organic Chemistry, 7th Ed., Wiley: New York, 1998.
- ‘What’s happened to Thalidomide babies?’ http://www.bbc.com/news/magazine-15536544 (accessed Aug 2017)
- Agranat, I.; Caner, H.; Caldwell, J. Nat. Rev. Drug Discov. 2002, 1, 753.
- Zhao, Y.; Swager, T. M. J. Am. Chem. Soc. 2015, 137, 3221.
- Yu, J.-X.; Hallac, R. R.; Chiguru, S.; Mason, R. P. Prog. Nucl. Magn. Reson. Spectrosc. 2013, 70, 25.
- Mestrelab MNova Software, www.mestrelab.com
- Giraudeau, P. Magn. Reson. Chem. 2017, 55, 61.
About Nanalysis Corp.
Nanalysis was established in 2009. The company develops and manufactures portable Nuclear Magnetic Resonance (NMR) spectrometers for the laboratory instrumentation market.
In the fall of 2012, the first product was launched: NMReady™, the first fully featured portable NMR spectrometer in a single compact enclosure requiring no liquid helium or any other cryogens.
The NMReady is used by chemical professionals in all types of industries (oil & gas, chemical, pharma, biotech, food processing) as well as government and university labs.
The NMReady enables all chemical trainees to gain first-hand knowledge of NMR as the premier spectroscopic method by using it in a variety of training environments.
Sponsored Content Policy: News-Medical.net publishes articles and related content that may be derived from sources where we have existing commercial relationships, provided such content adds value to the core editorial ethos of News-Medical.Net which is to educate and inform site visitors interested in medical research, science, medical devices and treatments.