A thorough evaluation of the transcriptome is provided by high-resolution RNA analysis using next-generation sequencing (RNA-seq), enabling the measurement of global gene expression. The use of RNA-seq in the study of diseases has increased, especially in cancer research where molecular profiling of tumors has become more useful.
Commercially available library preparation kits use various chemistries and strategies for RNA enrichment and library construction. This study examines the efficacy of three RNA-seq workflows from Kapa Biosystems, Illumina, and New England Biolabs (NEB) for tumor profiling.
RNA was extracted from donor-matched normal and tumor breast tissue and is used as an input into each RNA-seq library construction kit to examine the effects of workflow variations. Key metrics for library construction and sequencing were used to compare the resulting libraries. Differential gene expression analysis was carried out, and the outcomes were independently confirmed using qRT-PCR.
Materials and methods
Breast tissue samples
From AMSBIO, researchers obtained a patient-matched, fresh-frozen primary breast tumor and surrounding normal breast tissue. The tumor is a Grade 2, Stage IIb infiltrating lobular carcinoma, according to the technical documentation. A large tumor without detectable lymph node involvement or distant metastasis was indicated by the TNM staging (T3, N0, M0).
Using the Qubit® RNA HS Assay (ThermoFisher), total RNA was quantified after extraction and DNase treatment. A 2100 Bioanalyzer instrument and an Agilent® 6000 RNA Pico Kit (Agilent Technologies) were used to evaluate the quality of the RNA (Figure 1).
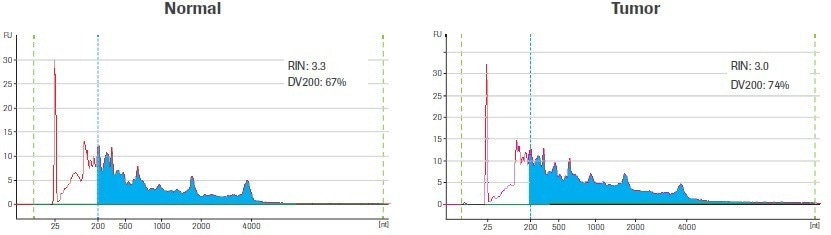
Figure 1. Input sample quality. Electrophereograms of input RNA were generated using an Agilent RNA 6000 Pico Kit. The RNA Integrity Number (RIN) and amount of material ≥200 nt (DV200) are indicated. Blue shading highlights RNA fragments ≥200 nt. Image Credit: Roche Diagnostics Limited
The RNA Integrity Number (RIN) and the DV200 value are two metrics that are regularly used to assess the quality of RNA. Both metrics are based on the size distribution of the RNA, which is assessed using an electrophoretic trace. The ratio of intact ribosomal peaks to the presence of intermediate peaks is used to calculate the RIN score, which is instantaneously tabulated by the Agilent Expert software.
The RIN score’s usefulness is however diminished by the fact that RNA extracted from archived biospecimens, like those used in this study, frequently lacks distinct ribosomal peaks. In contrast, the DV200 value, which is calculated as the percentage of RNA molecules longer than 200 nucleotides (nt), is independent of the presence of ribosomal peaks.
The DV200 is a better method for evaluating the quality of degraded RNA samples since RNA fragments smaller than 200 nt are poor substrates for RNA-seq library construction and are unlikely to contribute to the final library.
Library construction
To create libraries, 100 ng of input RNA was used. Unless otherwise stated, library construction was carried out using the reagents included in the relevant library preparation kits, as per the manufacturer’s instructions. Table 1 provides a summary of the kits used in this study and important library construction parameters.
Table 1. Library construction workflow and data overview. Source: Roche Diagnostics Limited
| |
KAPA RNA HyperPrep Kit with RiboErase (HMR) |
TruSeq® Stranded Total RNA with Ribo-Zero Gold |
NEBNext Ultra Directional RNA Library Prep Kit with rRNA Depletion |
| Sample RNA |
Normal |
Tumor |
Normal |
Tumor |
Normal |
Tumor |
| Input quantity (ng) |
100 |
100 |
100 |
| Depletion method |
RNase H |
Paramagnetic beads |
RNase H |
| Fragmentation |
94 °C for 4 min |
94 °C for 4 min |
94 °C for 15 min |
| PCR cycles |
13 |
15 |
15 |
| Post-PCR yield (nM) |
14.3 (±2) |
20.9 (±2.6) |
60.6 (±4.4) |
82 (±20.1) |
12.5 (±1.7) |
20 (±2.1) |
| Mean library size (bp) |
364 (±5) |
369 (±4) |
311 (±7) |
380 (±34) |
334 (±4) |
333 (±2) |
| Adapter-dimer (%) |
2.2 (±0.4) |
1.6 (±0.4) |
<1 |
<1 |
<1 |
<1 |
Ribosomal RNA (rRNA), which is typically present in high concentrations in RNA extractions (up to 90%), is not of biological interest to the majority of researchers. Prior to building an RNA-seq library, rRNA is removed, which enhances coverage of lower-abundance transcripts and makes sequencing more economical. Therefore, rRNA depletion is the first step in each of the three workflows used in this study.
The total RNA sample is incubated with probes that are complementary to rRNA sequences under circumstances that promote hybridization.
RNase H is then added to degrade the hybridized rRNA enzymatically, or paramagnetic beads are added to eliminate the probe/rRNA complexes from the sample when a magnetic field is applied, whichever method results in the least amount of rRNA. Each workflow’s rRNA depletion method is listed in Table 1.
Using the qPCR-based KAPA Library Quantification Kit for Illumina® platforms, library yields were measured after the final post-amplification cleanup step. Using an Agilent® High Sensitivity DNA Kit and a 2100 Bioanalyzer device, library size distributions were verified.
Sequencing and data processing
Using HiSeq® 2500 technology and v4 chemistry (Illumina), distinctively indexed duplicate libraries out of each sample and workflow were normalized and pooled for 2 × 100 bp paired-end sequencing.
Cutadapt and trimmomatic were used, respectively, for adapter and quality trimming. Reads were filtered to remove rRNA reads and sub-sampled to the least common number of paired reads (14 M) before being aligned to a hard-masked version of the human reference GRCh38.
Using Kallisto (0.42.4), gene expression was normalized and quantified. EdgeR was employed to analyze differential gene expression. VENNY2.1 was used to perform an overlap analysis.1
Validation of differential gene expression by qPCR
A specially created RealTime ready qPCR array (Roche) was used to validate the results of the differential gene expression analysis. Three reference genes for normalization, five positive and negative reverse transcription controls, and 88 assays for transcripts recognized as differentially expressed by RNA-seq are all included in the custom design.
The Transcriptor First Strand cDNA Synthesis Kit (Roche) was used to create cDNA for each sample, starting with 600 ng of total RNA and using both random hexamers and anchored oligo-dT primers.
After being heat-inactivated, 200 ng of cDNA was integrated with qPCR tools (LightCycler® 480 Probes Master), aliquoted into a real-time assay plate, and amplified using the LightCycler 480 System in accordance with the manufacturer’s instructions.
Data was grouped before analysis, and duplicate plates were assayed for each sample. The delta delta Cp method was used to calculate the relative differential gene expression.
Results and discussion
Comparative library metrics
Library construction metrics
The output from all three workflows was sufficient for library QC, sequencing, and archiving. Even though the number of amplification cycles for Kapa and NEB libraries (13 and 15 cycles, respectively) was different, similar yields were still obtained. If the two workflows’ amplification efficiencies are comparable, this should result in higher diversity for Kapa libraries and lower duplication rates.
Illumina libraries had higher yields than Kapa, which is consistent with using two more amplification cycles. Higher yields from Illumina libraries may also point to less effective rRNA depletion, according to additional library construction QC data (data not shown).
Even though Kapa and NEB libraries were more consistent between sample types than Illumina libraries, all three workflows generated final libraries with minimal adapter-dimer formation (<3%) and libraries of comparable sizes (Table 1).
Sequencing metrics
Five key sequencing metrics were contrasted among libraries created using the Kapa, Illumina, and NEB workflows, including the percentage of mapped reads, the percentage of rRNA reads, the uniformity of coverage, the percentage of duplicate reads, and the number of distinct transcripts found. For both samples, the percentage of mapped reads for all three workflows exceeded 90%. (Figure 2A).
While the Illumina bead-based strategy produced up to 22% rRNA reads, the Kapa and NEB workflows, which both use enzymatic strategies for rRNA depletion, demonstrated effective depletion of rRNA (≤2% rRNA reads) (Figure 2B).
In comparison to alternative workflows, Kapa libraries showed improved coverage uniformity, as evidenced by a lower mean coefficient of variation (CV), particularly for the tumor sample (Figure 2C). Both the Illumina and Kapa workflows outperformed NEB in terms of the percentage of duplicate reads (Figure 2D).
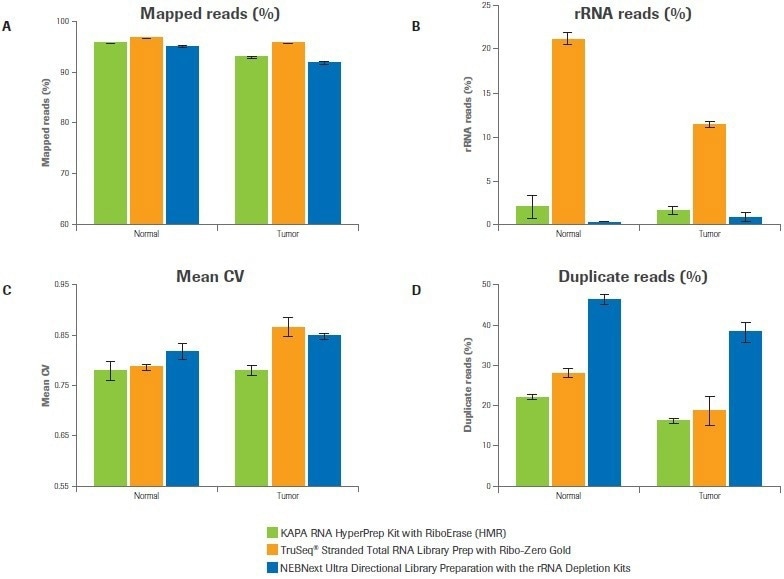
Figure 2. Workflow effects on sequencing metrics. Data was analyzed to quantify (A) percent mapped reads, (B) percent rRNA reads, (C) coverage uniformity (mean coefficient of variation), and (D) percent duplicates. Bars represent the mean from duplicate libraries and error bars indicate 0.5 of the range. Image Credit: Roche Diagnostics Limited
Transcript identification and differential expression
Compared to the Illumina or NEB workflows, the Kapa workflow found more distinct transcripts in both tumor and normal samples (Figure 3A). It was anticipated that this would have consequences for the study of differential gene expression.
When the minimum foldchange was set to ≥2 at a p-value <0.05, data analysis from Kapa libraries found up to 50% more differentially expressed transcripts than from libraries made with the alternative kits (Figure 3B). The difference was even more pronounced when the statistical threshold was raised (p-value ≤0.001); Kapa discovered five times as many differentially expressed transcripts as alternative workflows (Figure 3B–C).
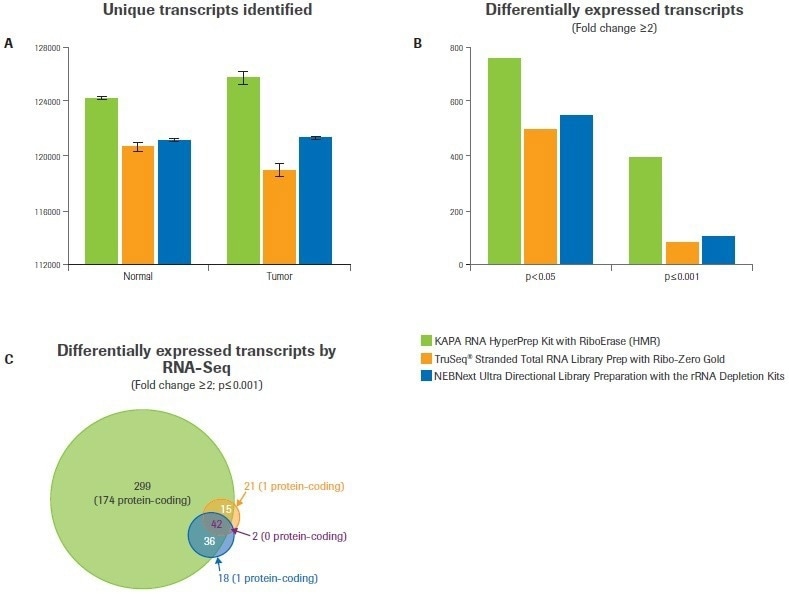
Figure 3. Comparison of workflows for identifying differential gene expression. After subsampling, data was analyzed to quantify (A) the number of unique transcripts identified for each workflow. Bars represent the mean from duplicate libraries and error bars indicate 0.5 of the range. (B) Differential gene expression analysis was performed with varying statistical stringencies to test the robustness of each workflow. (C) Overlap analysis was performed to test the degree of agreement between workflows. The number of transcripts in each category is indicated, with the number of protein-coding transcripts listed in parentheses. Image Credit: Roche Diagnostics Limited
The significant proportion of differentially expressed transcripts discovered by Illumina and/or NEB (69%) and an additional 299 transcripts not discovered by either NEB or Illumina were found by the Kapa workflow, according to further analysis (Figure 3C). Notably, only 5% of the transcripts discovered by Illumina and/or NEB but not by Kapa code for proteins (2 out of 41).
However, only 174 out of 299 of the transcripts discovered using the Kapa workflow (or 58%) are protein-coding, and most of these are identified to be dysregulated in breast cancer.2,3
Verification of differential gene expression
Hydrolysis probe-based identification of differentially expressed transcripts was carried out using pre-designed qPCR assays (custom panel design, Figure 4). Three reference genes for normalization, five positive and negative reverse transcription controls, and 88 assays chosen based on RNA-seq data are all included in the custom panel.
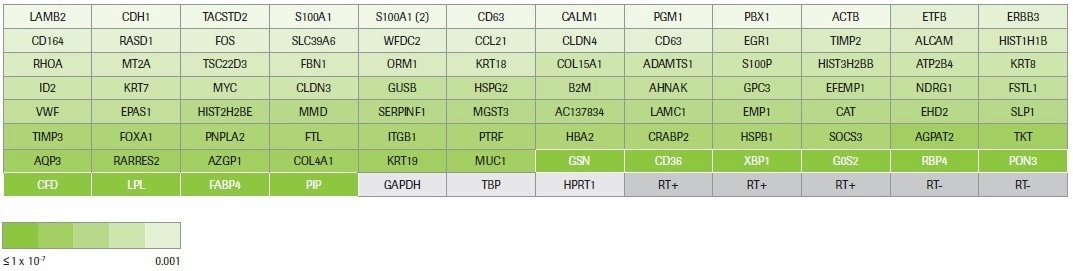
Figure 4. RealTime ready custom panel design. This panel was designed to test 88 up- and down-regulated transcripts across a range of fold changes (≥2) and p-values (0.001 to 9.02E-39) identified by RNA-seq. The coloring reflects the p-value for each target measured by RNA-seq. The 10 targets highlighted in white are differentially expressed transcripts that were identified by multiple workflows. The remaining 78 targets were identified by Kapa only. Housekeeping genes and controls for the reverse transcription reaction are in grey. Image Credit: Roche Diagnostics Limited
The targets include 78 assays that only target transcripts identified as differentially expressed by KAPA RNA HyperPrep and 10 assays that target transcripts recognized as differentially expressed by multiple workflows (Kapa, Illumina, and/or NEB).
Of the 88 assays, 81 (92%) produced Cp data with high confidence for duplicates of the tumor and normal samples. These 81 transcripts—71 of which were “Kapa-only” targets—were further examined for expression differences.
All 10 transcripts that were determined to have differential expression by multiple RNA-seq workflows showed a change in expression of ≥2-fold by qPCR in the same direction; seven transcripts were upregulated and three transcripts were downregulated (Figure 5).
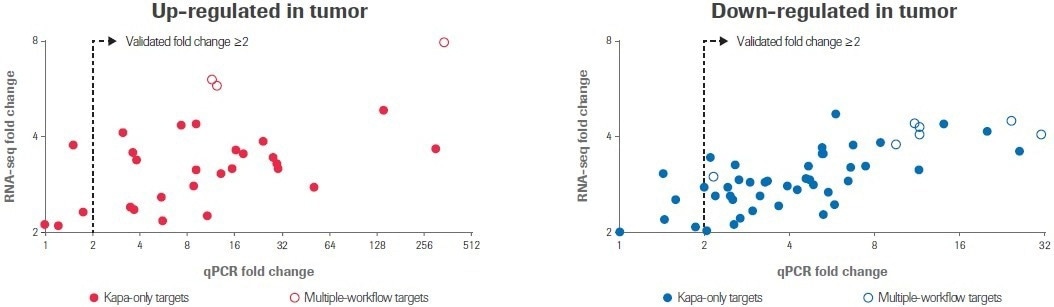
Figure 5. qPCR validation of differential gene expression. RealTime ready custom qPCR arrays were used to validate gene expression profiles obtained by RNA-seq. Scatter plots compare fold change values obtained by RNA-seq to values measured by qPCR. Each circle represents the average of two replicate measurements for a unique transcript. Filled circles indicate transcripts that were identified as differentially expressed by only the Kapa workflow; open circles indicate transcripts identified as differentially expressed by multiple workflows. Image Credit: Roche Diagnostics Limited
Of the 71 targets discovered exclusively using the Kapa workflow, 62 transcripts (87%) showed a ≥2-fold change in the anticipated direction. Seven more targets showed a similar trend to the RNA-seq data but did not change by at least a 2-fold threshold for qPCR. Only two (3%) targets did not change numerically between normal and tumor samples.
The overall conclusion is that these qPCR results provide independent confirmation that the differentially expressed transcripts discovered solely by the Kapa workflow represent quantifiable changes in gene expression and not RNA-seq artifacts.
It is important to note that the PAM50 classifier, a clinical tool used to categorize breast cancers into one of four intrinsic subtypes and frequently used as a prognostic indicator, contains four of the transcripts that were found to be differentially expressed solely by the Kapa workflow.
FOXA1, MLPH, MYC, and SLC39A6 were the PAM50 transcripts that showed differential expression.2
The SAM264 gene classifier set, which represents genes related to breast cancer patient survival, includes additional “Kapa-only” transcripts. ALCAM, AQP3, CDH1, CRABP2, IGFBP5, KRT18, KRT7, KRT8, MUC1, S100A1, and S100P are some of the genes in this group.3 The Kapa workflow successfully recognizes the differential expression of genes that are important for disease research.
Conclusions
A simplified, reliable workflow for building RNA-seq libraries from partially degraded RNA samples is provided by the KAPA RNA HyperPrep Kit with RiboErase (HMR). In comparison to alternative workflows, the library construction was successful and reproducible, with higher complexity, more effective rRNA depletion, and more balanced base coverage.
Additionally, the Kapa workflow found more transcripts with differential expressions. These results were validated by qPCR, demonstrating the effectiveness of the KAPA RNA HyperPrep Kit with RiboErase (HMR) as a molecular profiling tool.
Acknowledgments
Produced from materials originally authored by Nancy Nabilsi Senior, Applications Scientist, Drew Cheney, Applications Scientist, Ida van Jaarsveld, R&D Team Leader (Bioinformatics), Leendert Cloete, Bioinformatics Scientist, Davis Todt, Bioinformatics Scientist, Jennifer Pavlica, Applications Manager, Rachel Kasinskas, Director of Scientific Support & Applications, from Roche Sequencing & Life Science Wilmington, MA, USA, and Cape Town, South Africa.
References
- Oliveros, J.C. (2007 – 2015) Venny. An interactive tool for comparing lists with Venn’s diagrams. http://bioinfogp.cnb.csic.es/tools/venny/ index.html)
- Parker JS, Mullins M, Cheang MC, Leung S, Voduc D, Vickery T, Davies S, Fauron C, He X, Hu Z, et al: Supervised risk predictor of breast cancer based on intrinsic subtypes. J Clin Oncol. 2009, 27 (8): 1160-1167. 10.1200/JCO.2008.18.1370.
- Sorlie T, Perou CM, Tibshirani R, Aas T, Geisler S, Johnsen H, Hastie T, Eisen MB, van den Rijn M, Jeffrey SS, et al. Gene expression patterns of breast carcinomas distinguish tumor subclasses with clinical implications. Proc Natl Acad Sci USA. 2001;98:10869–10874.
About Roche Sequencing and Life Science
 Roche Sequencing & Life Science is part of Roche Diagnostics, which, along with Roche Pharmaceuticals, plays an important role in modern healthcare. Roche Diagnostics’ broad range of innovative diagnostic tests and systems play a pivotal role in the groundbreaking area of integrated healthcare solutions and cover the early detection, targeted screening, evaluation and monitoring of disease. Roche Diagnostics is active in all market segments, from scientific research and clinical laboratory systems to patient self-monitoring.
Sponsored Content Policy: News-Medical.net publishes articles and related content that may be derived from sources where we have existing commercial relationships, provided such content adds value to the core editorial ethos of News-Medical.Net which is to educate and inform site visitors interested in medical research, science, medical devices and treatments.