Clinical research frequently uses tissue that has been formalin-fixed and paraffin-embedded (FFPE). Due to the destructive nature of the formalin fixation process, where crosslinking, chemical alteration, and fragmentation can occur, the quality of RNA recovered from FFPE tissue can be extremely varied.
The age of the tissue, the technique of extraction, and the user’s background are other factors that affect RNA quality. The quantity and quality of the RNA input have an impact on the library creation approach used and the outcomes.
RNA-seq workflow selection
For the creation of an RNA-seq library, many options are available. Total RNA-seq libraries are created with the least amount of input material and capture the fullest transcriptome, including ribosomal RNA (rRNA) content (~90% of total RNA content).
By removing rRNA from RNA-seq libraries, sequencing costs are reduced and low-abundance transcripts of interest are better covered. Enriching mRNA or depleting rRNA from the RNA sample are two typical methods to eliminate rRNA during library creation.
Usually, mRNA enrichment employs bead-based captures or oligo-dT selective priming to target the poly-A tail. As a result, RNA quality affects whether mRNA enrichment can successfully capture a full-length transcript. mRNA enrichment is not appropriate for highly degraded inputs, such as those from FFPE-derived RNA, and using this method will result in a substantial bias towards the 3′-ends of transcripts.
A successful method for upfront elimination of rRNA is to deplete it enzyme by enzyme utilizing complementary DNA oligonucleotides and RNase H. rRNA depletion, as opposed to mRNA enrichment, is very efficient with degraded RNA inputs and produces a more complete depiction of the transcriptome because precursor mRNAs and non-coding RNAs are kept.
The KAPA RNA HyperPrep Kit with RiboErase (HMR) was used to create the libraries that were sequenced in this investigation. This procedure deprives both cytoplasmic (5S, 5.8S, 18S, and 28S) as well as mitochondrial (12S and 16S) rRNA species and is intended for both manual and automated RNA-seq library creation from 25 ng to 1 µg of total human, mouse, or rat RNA.
The procedure may be used for a variety of RNA-seq tasks, such as splice junction and gene fusion detection, single nucleotide variation (SNV) discovery, and gene expression analysis. Figure 1 shows an overview of the workflow with steps for quality control (QC) highlighted.
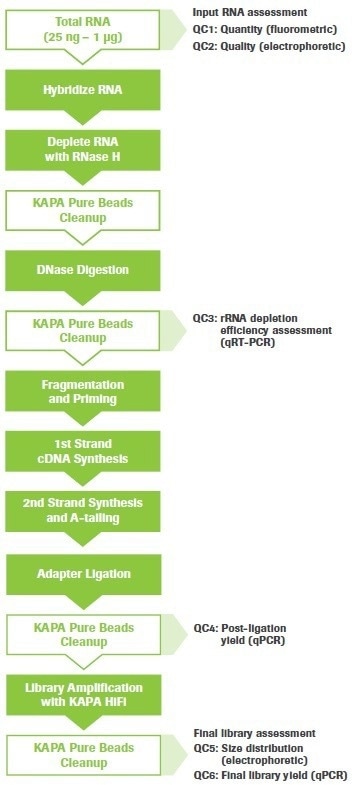
Figure 1. KAPA RNA HyperPrep Kit with RiboErase (HMR) workflow. Quality control (QC) points are indicated. Image Credit: Roche Diagnostics Limited
Input RNA and library construction QC steps
Input RNA handling and assessment, QC1 and QC2
The amount of genomic DNA (gDNA) contamination in the RNA sample should be kept to a minimum. In the process of ribosomal depletion, RNA is first incubated in a way that encourages rRNA to hybridize with complementary DNA oligonucleotides, and then it is treated with RNase H to eliminate rRNA that has duplexed with DNA.
In these circumstances, contaminated gDNA could also hybridize into complementary transcripts, resulting in the unintended destruction of non-rRNA species. Intergenic read counts would likewise rise in the presence of significant DNA contamination.
Therefore, total RNA should be DNase treated (without heat inactivation) and re-purified if it was not already during the RNA extraction procedure. RNA was extracted from tissues in this investigation utilizing kits that have on-column DNase treatment.
QC1
Fluorometric assays are advised to quantify RNA samples since they often offer a more accurate determination of the quantity of nucleic acids than spectrophotometric techniques. For instance, the Qubit® RNA HS Assay, which was created for RNA sample concentrations between 250 pg/µL and 100 ng/µL, is extremely selective for RNA, and will not measure DNA, protein, or free nucleotides, and is efficient on low-abundance RNA samples.
QC2
Before building a library, the quality and size distribution of the input RNA should be evaluated using an electrophoretic approach (such as an Agilent® Bioanalyzer RNA test). The RNA Integrity Number (RIN) and the DV200 value are two metrics widely used to assess the integrity of the RNA based on the electrophoretic trace of the sample.
The Agilent Expert program calculates the ratio of ribosome peaks and the existence of degraded product to assign the integrity number, which then automatically tabulates the RIN score. High-grade samples are those with a RIN ≥7. The RIN score’s applicability as a quality assessment for such damaged samples is impacted by the fact that FFPE-extracted RNA frequently lacks identifiable ribosomal peaks.
After fragmentation, random priming, and subsequent library cleanup processes, RNA pieces less than 200 nucleotides (nt) are poor substrates for RNA-seq library formation and are likely to be lost.
When used with lower-quality, degraded inputs, the DV200 measure quantifies the fraction of sample RNA that is longer than 200 nt and is anticipated to be a better indicator of RNA quality than the RIN score.
The quality criteria of tissue-derived RNA samples can be very different. Figure 2(A–E) displays the bioanalyzer traces for three FFPE-derived samples as well as one sample of slightly degraded RNA (from fresh-frozen breast tumor tissue) and one sample of high-quality, intact RNA (from the Universal Human Reference, UHR) (thyroid, duodenum, and breast tumor). Keep in mind that the same biological material was used to acquire both the FF and FFPE breast tumor samples.
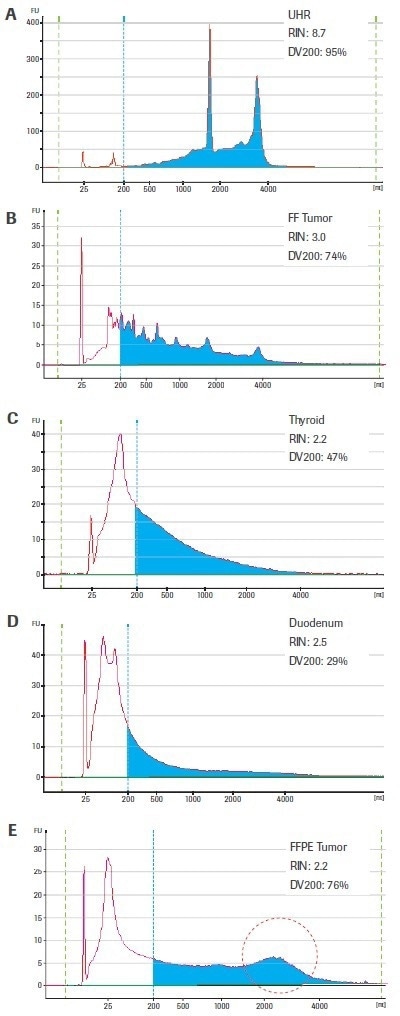
Figure 2. Electrophoretic profiles for representative RNA samples utilized in this study. Samples C–E were isolated from FFPE tissue; whereas sample B originated from fresh-frozen (FF) tissue of the same biological specimen as sample C. High-quality human Universal Human Reference RNA (Agilent Technologies; A) is included for comparison. Electropherograms were generated using an Agilent 2100 Bioanalyzer and RNA 6000 Pico Kit. Blue shading highlights RNA fragments >200 nt. The region circled in red in the breast tumor FFPE sample (E) designates a high-molecular weight peak that is likely the result of crosslinking or inefficient deparrafinization (rather than intact transcripts that could be efficiently converted to sequenceable cDNA fragments). Image Credit: Roche Diagnostics Limited
The DV200 values are more evenly distributed and suggest that the RNA extracted from the fresh-frozen tumor (74%) and FFPE-thyroid (47%) are higher quality inputs than the RNA from FFPE-duodenum (29%) — which is considered to be similarly low quality based on the RIN score for all four tissue-derived samples.
The DV200 value of the FFPE breast tumor sample is equally high (76%) but is probably exaggerated by the high molecular weight peak seen in this otherwise severely damaged sample. Sometimes, rather than true intact RNA, this may represent cross-linked or insufficiently deparaffinized material.
rRNA depletion efficiency assessment, QC3
QC3
If required, a quality control test can be done to determine if the RNA sample’s rRNA was successfully removed. After rRNA depletion and before fragmentation, an aliquot of RNA is kept (see Figure 1). qRT-PCR is carried out utilizing primers against a housekeeping control gene (in this study, GAPDH) and an rRNA species (in this work, human 28S).
The success of rRNA depletion is determined by calculating the delta Ct (dCt) value between both the depleted sample and a control input sample.
In this investigation, 47 RNA-seq libraries were created utilizing either a bead-based method or an enzymatic approach, as used in the KAPA RiboErase (HMR) module, to remove rRNA. The final RNA-seq results from samples made using enzymatic ribodepletion demonstrate a robust connection between lower rRNA read counts (<5%) and higher dCt values for 28S rRNA (≥7). (Figure 3).
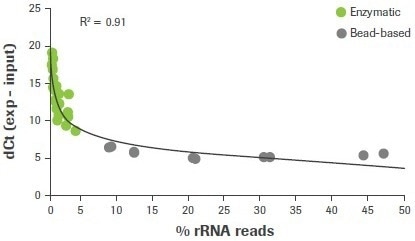
Figure 3. Correlation between rRNA depletion QC3 and RNA-seq data. RNA samples were depleted of rRNA content using either enzymatic (RNase H) or bead-based workflows. Delta Ct values for 28S were measured using qRT-PCR and plotted against the rat of carryover rRNA reads obtained from RNA-seq. For this and all subsequent RNA-seq data, sequencing was performed using an Illumina HiSeq® 2500 in high output mode with v4 chemistry and 2 x 100 bp read length. Image Credit: Roche Diagnostics Limited
Post-ligation library quantification, QC4
QC4
It is advised to assess the post-ligation yield of RNA-seq libraries before carrying out amplification since RNA samples extracted from tissues in general and FFPE-derived samples, in particular, have a high degree of intrinsic variability. This enables the user to calculate the approximate number of cycles required to generate enough material for sequencing, quality assurance, and sample storage without over-amplifying.
Unwanted artifacts caused by excessive library amplification include bias in the amplification process, duplicate PCR products, chimeric library inserts, and nucleotide alterations. Cycle numbers were chosen for this investigation based on the sample post-ligation yield to produce an amplified library at a concentration of ≥10 nM, which is typically suggested for long-term preservation.
Using the qPCR-based KAPA Library Quantification Kit, samples utilized in this investigation were quantified following the post-ligation cleanup and post-amplification cleanup stages (Figure 1). This package contains standards and primers based on the Illumina® primer sequences and may be used to measure libraries created using full-length adapters. Libraries must be diluted to fit inside the assay’s dynamic range.
The quality and amount of the input will affect the dilution factor. Prior to measurement in this investigation, post-ligation libraries made from 25–100 ng of partly degraded or FFPE RNA samples were diluted 1:20. Prior to measurement, post-ligation libraries made from 25–100 ng of high-quality UHR RNA were diluted 1:100. On kapabiosystems.com/support, data analysis templates for library quantification may be downloaded.
Final library assessment, QC5 and QC6
QC5
With an electrophoretic technique, the size distribution of the final libraries should be verified. Conventional gels should be substituted with a LabChip® GX, GXII, or GX Touch (PerkinElmer), Bioanalyzer, or TapeStation (Agilent Technologies), Fragment Analyzer (Advanced Analytical), or comparable equipment. A final library distribution exhibiting the correct mode or mean fragment size and low adapter-dimer carryover detected as a sharp 120–140 bp peak, are indicators of the successful library building.
QC6
For high-sensitivity quantification of final library yields, the KAPA Library Quantification Kit is advised. Prior to measurement in this investigation, post-amplification libraries were diluted by 1:20,000. For multiplex sequencing, libraries were measured, standardized, and pooled. By using qPCR to quantify the final library pools (Table 1), sequencing was then requested.
Workflow optimization for degraded inputs
FFPE RNA samples
The creation of an RNA-seq library is significantly influenced by RNA quality. As RNA quality decreases for a given input quantity (100 ng), post-ligation yield decreases, and adapter–dimer formation rises (Figure 4). The adapter–dimer rates and post-ligation yield are often improved by increasing the amount of RNA input.
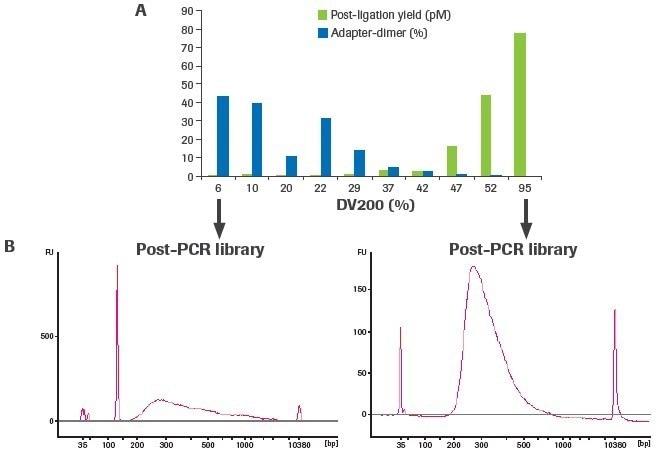
Figure 4. Sample quality affects RNA-seq library construction. Libraries were constructed using 100 ng of RNA from FFPE tissues (DV200 range: 6–52%) and a high-quality UHR control (DV200: 95%). (A) Post-ligation yield was measured by qPCR, and adapter-dimer rates were calculated from electrophoretic assessment of final libraries. (B) Representative traces of final libraries from low-quality (left) and high-quality (right) samples measured using an Agilent® High Sensitivity DNA Kit. Image Credit: Roche Diagnostics Limited
More distinct molecules were likely transformed from input RNA to appropriately adapted library fragments, as evidenced by an increase in post-ligation yield. Higher post-ligation yield for samples that are effectively rRNA depleted shows an increase in library diversity and is linked to a decreased duplication rate (Figure 5). Notably, the lowest post-ligation yields and greatest duplication rates were seen with duodenal FFPE, the lowest-quality RNA sample evaluated.
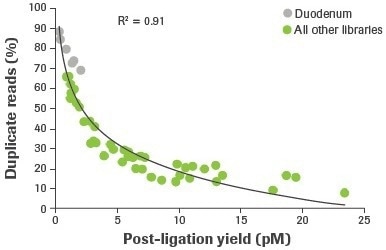
Figure 5. Correlation between post-ligation yield and percent duplicate reads. Post-ligation yield was measured by qPCR and plotted against the percent of duplicate reads obtained from RNA-seq of rRNA depleted samples. Reads aligning to rRNA were removed and paired reads were randomly subsampled to 14M for comparative analyses. Image Credit: Roche Diagnostics Limited
The effect of input RNA quality on library construction is further illustrated in Figure 6A. The bioanalyzer traces for three different, variable-quality RNA extractions from the same FFPE tissue source are displayed. Using the KAPA RNA HyperPrep Kit, duplicate RNA-seq libraries were created from 25 ng of total RNA (without rRNA depletion).
Reduced DV200 values are connected to lower final library yield, supporting the findings for rRNA-depleted libraries (Figure 6B). Unlike rRNA-depleted preparations, adapter-dimer rates are not significantly elevated. Please take note that the libraries generated from thyroid sample 3 (DV200: 11%) are just displayed for illustration. It is uncertain if input RNA with such a low-quality score will yield usable sequencing results.
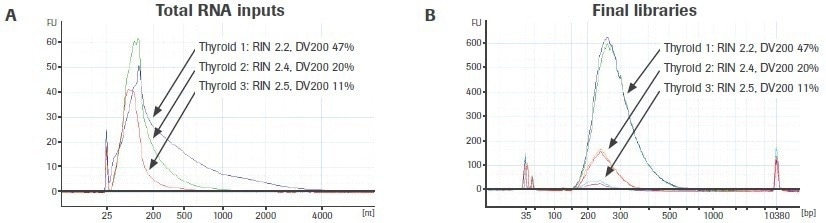
Figure 6. Effect of RNA quality on the KAPA RNA HyperPrep Kit (without rRNA depletion) workflow. Electrophoretic profiles of (A) three separate extractions of RNA from FFPE thyroid tissue and (B) final total RNA-seq libraries prepared from each extraction. Final library yield decreases as a function of input RNA quality. Image Credit: Roche Diagnostics Limited
Adjusting the adapter concentration and post-ligation cleaning ratios can boost performance when the input volume is constrained and/or sample quality is very poor. Titrations of adaptor concentration and post-ligation bead clean-up ratios were carried out using a severely deteriorated FFPE input to examine the effect of altering these stages on library quality (DV200: 29%).
Increased adapter concentration and laxer post-ligation cleanups resulted in an improvement in post-ligation yield (Figure 7A), but this was accompanied by a rise in the creation of adapter dimers (Figure 7B).
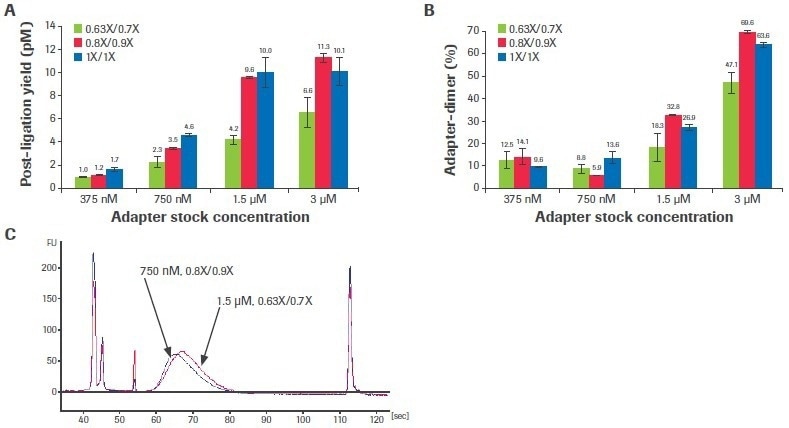
Figure 7. Titration of adapter concentration and post-ligation cleanup ratios. Titrations were performed with 50 ng poor-quality input RNA. (A) Post-ligation yields were measured by qPCR and (B) adapter dimer rates were calculated based on electrophoretic assessment of final libraries. Each bar represents the mean of two replicate libraries prepared with the KAPA RNA HyperPrep Kit with RiboErase (HMR). (C) Electrophoretic traces show that decreasing adapter concentration to 750 nM and relaxing post-ligation clean-up ratios to 0.8X/0.9X lowers adapter-dimer rates without affecting final library yield. Standard conditions are 1.5 µM adapter concentration and 0.63X/0.7X clean-up ratios. Image Credit: Roche Diagnostics Limited
For this sample, dropping the adapter concentration to 750 nM (from the usual concentration of 1.5 uM) and loosening the post-ligation cleaning ratios to 0.8X/0.9X (from the normal ratios of 0.63X/0.7X) decreased adapter-dimer formation without noticeably impacting library yield (Figure 7C). Although this situation was shown to be optimum for this sample, ideal circumstances are probably different for various input quantities and characteristics.
If workflow optimization is required, it is advised to focus on the application’s expected range of input quantities and quality. Adapter-dimers may occasionally continue to exist even after workflow optimization. In this situation, tiny products can be eliminated by doing a second 1X bead cleanup following amplification.
Partially degraded RNA samples
Additional biological sample types (such as fresh-frozen tissues) may provide electrophoretic profiles with partly degraded RNA. Typically, slightly deteriorated samples have higher DV200 values but lower RIN scores than fully intact ones (in comparison to FFPE samples). Fragmentation conditions can be changed for partially degraded samples to increase library yield or change the fragment size distribution.
Figures 8A to C’s left panels display the bioanalyzer traces for samples of input RNA that have been partly degraded and range in quality. Figures 8A to C, right panels, show the final amplified libraries created from each input after fragmentation time and temperature titrations were carried out. Increases in temperature and/or fragmentation time for all inputs led to shorter, more evenly spaced library fragments and decreased post-amplification yield.
The mean fragment lengths of the amplified libraries are presented in Figure 8D, grouped by fragmentation condition to emphasize the influence of sample quality and fragmentation circumstances on final library size. Be aware that libraries created from lower-quality samples are shorter than those created from higher-quality sources for certain fragmentation circumstances.
Reduced fragmentation time and temperature circumstances make this development more pronounced. As a result, larger quality-dependent changes in final library sizes are anticipated when using a single fragmentation condition across samples of different qualities when fragmenting at lower temperatures and/or for shorter periods of time.
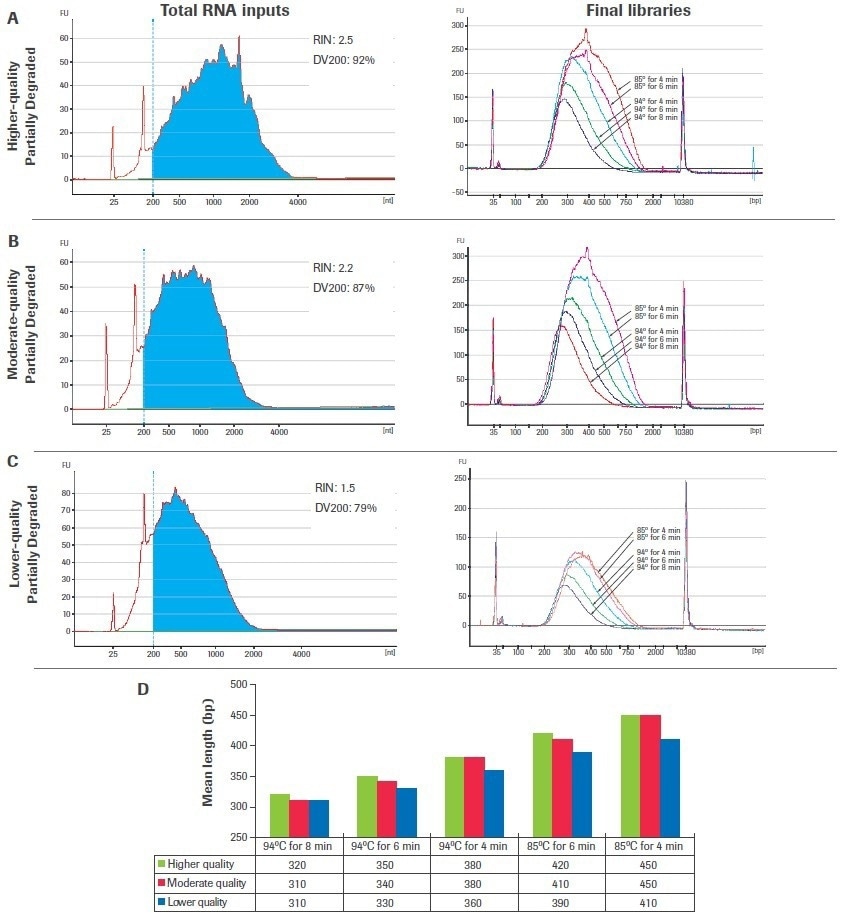
Figure 8. Titration of fragmentation conditions for partially degraded samples. Libraries were constructed using 100 ng of chemically degraded UHR RNA including (A) higher-quality, (B) moderate-quality, and (C) lower-quality inputs. Total RNA traces were generated with an Agilent® RNA 600 Pico Kit (left panels) and final library traces were generated with an Agilent High Sensitivity DNA Kit (right panels). (D) Mean library lengths are grouped by fragmentation condition. Image Credit: Roche Diagnostics Limited
Effect of input quality and quantity on sequencing metrics
The KAPA RNA HyperPrep Kit with RiboErase (HMR) was used to create libraries from RNA samples of variable quality (shown in Figure 2), utilizing inputs of 25 and 100 ng.
Only 100 ng of input was used to create libraries for extremely degraded duodenal FFPE RNA. The usual adapter stock concentration (1.5 µM) and post-ligation cleaning ratios (0.63X/0.7X) were used to prepare all samples. Table 1 includes pertinent data for input quality and library creation. Regardless of input or sample quality, all samples showed effective rRNA depletion (<5% rRNA readings).
Table 1. High-level sample, workflow, and data overview. Source: Roche Diagnostics Limited
| |
UHR |
FF Tumor |
FFPE Tumor |
Thyroid |
Duodenum |
| Input RNA |
RIN |
8.7 |
3.0 |
2.2 |
2.2 |
2.5 |
| DV200 (%) |
95 |
74 |
~76 (inflated) |
47 |
29 |
| Input (ng) |
25 |
100 |
25 |
100 |
25 |
100 |
25 |
100 |
100 |
| Library construction conditions |
Fragmentation |
94 °C for 4 min |
65 °C for 1 min |
| PCR cycles |
13 |
11 |
15 |
13 |
15 |
13 |
15 |
13 |
17 |
| Library construction QC data |
Post-ligation yield (pM) |
9.3 |
77.5 |
5.9 |
17.2 |
2.4 |
10.3 |
5.8 |
16.3 |
1.4 |
| Post-PCR yield (nM) |
14.3 |
22.9 |
36.1 |
20.9 |
8.4 |
13.6 |
21.0 |
26.9 |
13.9 |
| Mode library size (bp) |
333 |
349 |
302 |
295 |
278 |
287 |
312 |
305 |
282 |
| Sequencing metrics |
rRNA reads (%) |
1.6 |
0.9 |
4.0 |
1.5 |
0.6 |
0.7 |
0.4 |
0.2 |
1.7 |
| Adapter-dimer (%) |
<1.0 |
<1.0 |
1.7 |
<1.0 |
3.7 |
3.7 |
2.6 |
<1.0 |
11.7* |
* To facilitate comparison between samples, standard conditions were applied and a second 1X post-amplification clean-up was not employed for the duodenum libraries.
Trying to compare library construction metrics for the FFPE-derived RNA samples, libraries made from the lower-quality duodenum sample had the lowest post-ligation yield, required more amplification cycles to reach a final concentration of 10 nM, and had smaller mode fragment sizes and higher adapter–dimer rates. From 25 to 100 ng of input decreased adapter–dimer rates for thyroid and FF tumor libraries.
Regardless of sample quality or input, as seen in Figure 9A, mapping rates surpassed 90% for all sample categories. Duodenum-derived libraries had the greatest duplication rates (Figure 9B), which was consistent with having the lowest post-ligation yield (Table 1). The duplication rate for thyroid, tumor, and UHR libraries was significantly reduced when inputs were increased from 25 to 100 ng (up to a 3.1-fold improvement).
The mean CV, or the coefficient of variation in base coverage over transcript length, is used in Figure 9C to illustrate coverage uniformity. A lower value for this statistic indicates better coverage uniformity since base coverage varies less. In comparison to UHR, samples of inferior quality showed a larger mean CV (less uniform coverage). This statistic was somewhat improved by increasing input volume.
The total number of distinct transcripts found for each sample type is displayed in Figure 9D. Although there seems to be a correlation between worse sample quality and fewer transcripts found, it is crucial to keep in mind that these samples were taken from a range of tissue types, and the predicted number of transcripts from each tissue source may not be constant.
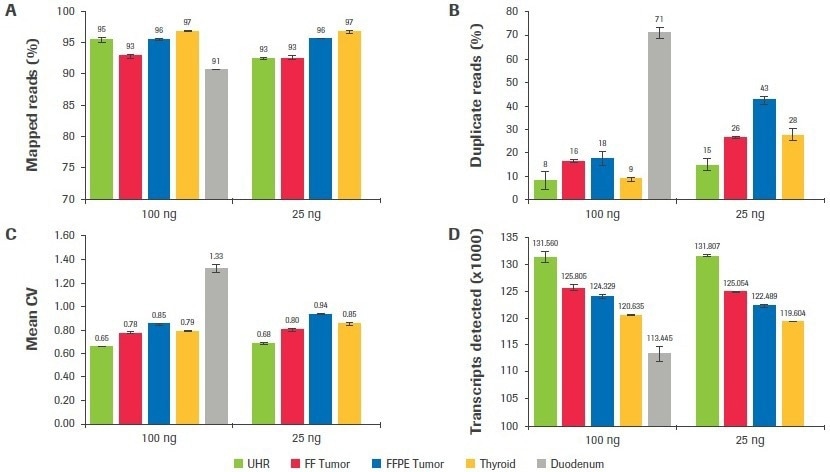
Figure 9. Effect of RNA input on sequencing metrics. After subsampling, data was analyzed to quantify, the (A) percent mapped reads, (B) percent duplicate reads, (C) mean CV, and (D) number of unique transcripts identified. Image Credit: Roche Diagnostics Limited
When the number of distinct transcripts for each sample is compared across input amounts, a significant resemblance is seen between the results obtained at 25 and 100 ng. The maximum consistency is shown in the high-quality UHR samples, where there is just a 0.18% change in the number of transcripts discovered at 25 and 100 ng inputs. For the FF tumor, thyroid, and FFPE tumor, respectively, there is a difference between inputs of 0.5%, 0.8%, and 1.5%.
The impact of sample quality on gene expression measurement repeatability was then looked at. Despite the less favorable library building metrics, the duodenal sample had high consistency between replicates and was as robust as the thyroid sample (Figures 10A–C).
Additionally, for gene expression data acquired from 25 and 100 ng inputs, a significant connection was seen (Figure 10D). Finally, the matched FF and FFPE tumor samples’ gene expression data were compared. For inputs of 25 and 100 ng, there was significant agreement between these samples (Figures 10E–F).
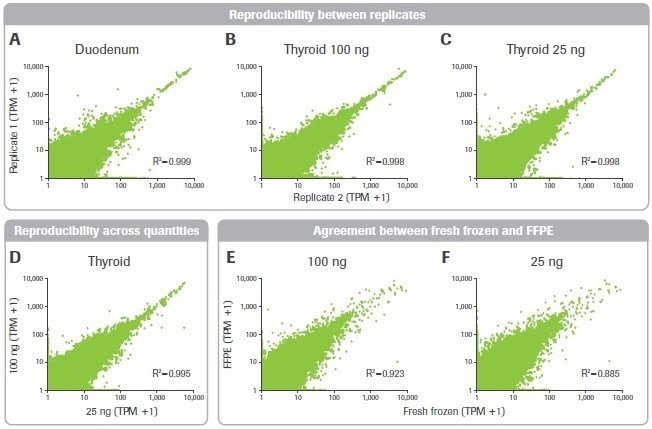
Figure 10. Effect of RNA input on reproducibility and accuracy. Pearson correlation plots are shown for gene expression transcripts per million (TPM) counts across (A–C) replicates and (D) input quantities. (E–F) Agreement between FFPE and matched fresh frozen breast tumor tissue is shown. Image Credit: Roche Diagnostics Limited
In conclusion, the KAPA RNA HyperPrep method is effective for building RNA-seq libraries from RNA extracts of varying quality from tissue samples. Except for coverage balance, sequencing metrics from libraries made from higher-quality FFPE or partly degraded samples are comparable to those from high-quality intact RNA.
For partially degraded or FFPE-derived samples, increasing the input volume enhances library variety, reduces adapter–dimer formation, and slightly enhances coverage uniformity. It is more difficult to analyze very poor-quality FFPE samples, especially in terms of adapter-dimer formation, duplication rate, and coverage balance. If at all feasible, it is advised to increase input (up to 1 µg) for very poor quality samples.
Regardless of the input quality, there is robust reproducibility across input quantities and across duplicates. Additionally, there is good agreement between matched fresh-frozen and FFPE tissue, which gives confidence in the accuracy of gene expression profiling utilizing RNA from FFPE tissue.
Summary
The quick reference tables below provide the quality control measures for library preparation, optimization techniques, and troubleshooting tips.
Table 2. Library preparation QC points. Source: Roche Diagnostics Limited
| QC |
Priority |
Assay information |
Application |
| QC1: Quantity assessment of input RNA sample |
Required |
- Fluorometric methods, such as Qubit, are highly preferred
- Concentration information from Nanodrop or electrophoretic methods is acceptable
|
Provides quantitative information regarding the amount of total RNA available for library construction |
| QC2: Quality assessment of input RNA sample |
Strongly recommended |
Electrophoretic methods, such as Agilent® Bioanalyzer RNA assays |
- Determines if the sample is likely to support successful library construction
- Helps to identify appropriate fragmentation conditions and adapter input concentration
|
| QC3: rRNA depletion efficiency |
Optional |
qRT-PCR, such as the KAPA SYBR® FAST One-Step qRT-PCR Kit |
Confirms successful depletion of rRNA prior to sequencing |
| QC4: Post-ligation yield |
Recommended |
qPCR, such as the KAPA Library Quantification Kit (only for full-length adapters where P5 and P7 are added during ligation) |
- Helps minimize over-amplification
- Useful for optimization during the establishment of new workflows and pipelines, or when working with new sample types and input amounts
- May also predict library complexity issues (such as high duplication rates) prior to sequencing
|
| QC5: Final library size distribution assessment |
Strongly recommended |
Electrophoretic methods: LabChip® GX, GXII, or GX Touch (PerkinElmer), Bioanalyzer or TapeStation (Agilent Technologies), Fragment Analyzer (Advanced Analytical), or similar instrument is recommended over conventional gels |
Confirms successful library preparation by measuring the final library size distribution and the presence of undesirable products, such as adapter-dimer |
| QC6: Final library yield |
Recommended |
qPCR, such as the KAPA Library Quantification Kit |
Most accurate method for quantification of NGS libraries prior to sequencing |
Table 3. Library preparation optimization strategies. Source: Roche Diagnostics Limited
| Sample type |
Optimization |
Standard condition* |
Notes |
| FFPE |
Input quantity |
25 ng – 1 μg |
Increased input amounts, up to 1 μg, can decrease adapter-dimer formation and increase complexity, as well as improve success rates with extremely degraded samples. |
| Adapter concentration |
1.5 μM |
For inputs that are low-quality and low-quantity, decreasing adapter concentration may lower adapter-dimer rates at the expense of post-ligation yield (i.e., library complexity). There may be an optimal balance between adapter concentration and post-ligation cleanup ratios that can reduce adapter-dimer carryover without sacrificing library yield (Figure 7). |
| Post-ligation cleanup ratios |
0.63X/0.7X |
| Partially degraded |
Fragmentation |
Variable, depending on desired insert size |
Increased fragmentation time and temperature results in shorter, more tightly distributed library fragments. Decreased fragmentation time and temperature results in increased yields of longer, more broadly distributed library fragments. Sample quality has a stronger impact on size distribution at decreased times and temperatures (Figure 8). |
* From KAPA RNA HyperPrep Kit with RiboErase (HMR) Technical Data Sheet.
Table 4. Recommendations for troubleshooting. Source: Roche Diagnostics Limited
| Category |
Metric |
Effect of sample quality |
Solution |
| Library preparation metrics |
QC3: rRNA depletion efficiency |
None observed in this study |
No troubleshooting needed in this study |
| QC4: Post-ligation yield |
Decreases as sample quality declines |
Increase input quantity |
| QC5: Adapter-dimer formation |
Increases as sample quality declines |
To prevent:
- Increase input quantity
- Decrease adapter concentration and/or modify post-ligation cleanup ratios (Figure 7)
To mitigate in a final library:
- Implement a second 1X cleanup post-amplification
|
| QC6: Final library yield |
Decreases as sample quality decreases (for a set number of amplification cycles) |
- Increase input quantity
- Increase the number of amplification cycles, if necessary, but note that this may impact sequencing metrics such as duplication rate
|
| Sequencing metrics |
Mapping rate |
None observed in this study |
No troubleshooting needed in this study |
| Reproducibility |
None observed in this study |
No troubleshooting needed in this study |
| Duplication rate |
Increases as sample quality declines |
Increase input quantity |
| Coverage balance |
Decreases as sample quality declines |
Increasing sample input quantity partially improves coverage balance. For very highly degraded samples, coverage balance will likely remain lower than observed for higher-quality samples. |
Appendix A: Materials and methods
Experimental design
The KAPA RNA HyperPrep Kit with RiboErase was used to treat UHR RNA from fresh frozen and FFPE tissues that were of high quality partially degraded UHR RNA and RNA of varying quality (HMR). For rRNA depletion effectiveness, library yield, and adapter–dimer formation, library construction quality control data were compared. The percentages of mapped reads, rRNA reads, duplicate reads, coverage balance, and the number of distinct transcripts found were compared while comparing sequencing data.
RNA preparation
Both sample types’ RNA extraction processes included on-column DNase treatment. The best UHR RNA was bought (Agilent Technologies). UHR RNA was chemically fragmented by heat and Mg2+ to prepare partly degraded samples (Figure 8). A 2100 Bioanalyzer device and an Agilent® RNA 6000 Pico Kit were used to measure the quantity of RNA samples using the Qubit® RNA HS Assay and to evaluate their quality.
Library construction and QC
Each sample was used to create duplicate libraries using the KAPA RNA HyperPrep Kit with RiboErase (HMR). Table 1 lists the number of PCR cycles, input amounts, and fragmentation conditions. During PCR, negative (no template) control reactions were added. Following rRNA depletion using RiboErase, RNA aliquots were kept, and depletion efficiency was assessed. The KAPA Library Quantification Kit was used to gauge the post-ligation and post-amplification library concentrations.
Sequencing and data analysis
Prior to sequencing, libraries were quantified and pooled using the qPCR-based KAPA Library Quantification Kit. According to the manufacturer’s instructions, each pool was denatured, diluted, and put into an Illumina® HiSeq®2500 instrument. Using a HiSeq v4 chemical kit, paired-end sequencing (2 × 100 bp) was carried out (Illumina). Cutadapt and trimmomatic were used, respectively, for adapter and quality trimming.
Reads were down-sampled to the lowest common number of paired reads after being filtered to eliminate rRNA reads and aligned to a hard-masked version of the human reference GRCh38 (14 M). Using Kallisto (0.42.4), gene expression was normalized and measured.
Appendix B: Calculate DV200 value using Agilent Expert software
To determine a sample’s DV200 value using Agilent® Expert software:
- Switch from Normal to Advanced under the Global tab
- Check the Smear Analysis box
- Add a region, double-click Table, and type 200–10,000 nt in the popup box. If an error is noticed regarding selecting the proper higher limit appears, adjust the upper limit as necessary
- The Region Table tab displays the findings
- The findings are shown as a percent of the total in the trace window for the region chosen
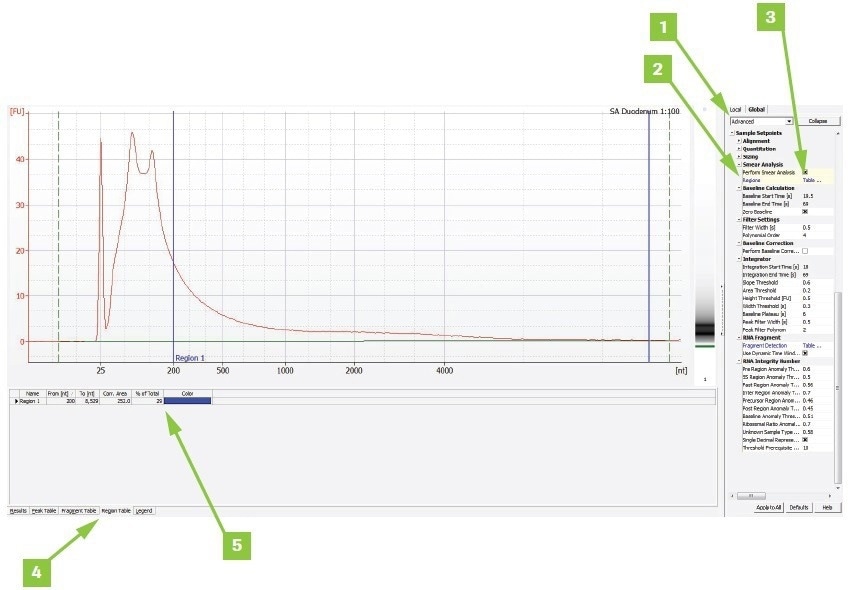
Image Credit: Roche Diagnostics Limited
Appendix C: Confirm successful rRNA depletion using qRT-PCR
Materials
- KAPA SYBR® FAST One-Step qRT-PCR Kit, for starters
- Primer set directed at a housekeeping gene, such as GAPDH (shown below)
- GAPDH_RNA_1F 5'- ACCATCTTCCAGGAGCGAGA
- GAPDH_RNA_1R 5'- ATGGTGGTGAAGACGCCAGT
- Primer set (shown below) that targets a ribosomal region, such as
- 28S_RNA_1F 5'- TACCGGCACGAGACCGATAG
- 28S_RNA_1R 5'- TTAACGGTTTCACGCCCTCTT
Note: The primers have not been tested against mouse and rat RNA and were created with a human target reference in mind. Primer-BLAST results show that mouse and rat 28S primer sequences are completely conserved. Although the reverse GAPDH primer has a 1 nt mismatch with the mouse reference, the GAPDH primer sequences are 100% preserved in the rat.
Procedure
By altering the procedures listed in the KAPA RNA HyperPrep Kit with RiboErase (HMR) Technical Data Sheet, take a 2 µL sample aliquot after rRNA-depletion
Step 6.2: Beads should be resuspended in 24 µL of 1X Fragment/Prime/Elute (FPE) Buffer.
Step 6.5: Gently pour 22 µL of supernatant into a brand-new tube.
The obtained sample should have 2 µL taken out and stored at −20 °C for QC3 at a later time.
When users are ready to do the qRT-PCR analysis,
- Thaw and quickly spin the aliquots of depleted RNA samples from step 6.5
- Add 3 µL of RNase-free water to the tube and gently pipette up and down several times to completely mix the rRNA-depleted samples. Do not vortex RNA samples ever.
- Assuming there was no RNA enrichment, determine the concentrations of the 5 µL RNA-depleted samples. Please check the example below for a sample that was created using 100 ng of total RNA:
- 100 ng into 24 μL of FPE buffer = 4.17 ng/μL
- 4.17 ng/μL x 2 μL (initial aliquot volume) = 8.34 ng
- 8.34 ng into 5 μL (diluted volume) = 1.67 ng/μL
Note: This dilution amount allows for the single measurement of each sample for two experiments (i.e., no technical duplicates) (28S and GAPDH). Do not dilute samples to less than < 50 pg/µL; instead, adjust quantities and calculations appropriately if adding technical duplicates or additional tests.
- To get the same concentrations as the depleted samples to be tested on the same plate, dilute any leftover total RNA (i.e., material that has not had rRNA depleted)
- Create a unique master mix for each primer set (28S and GAPDH) in accordance with the KAPA SYBR FAST One-Step qRT-PCR Kit Technical Data Sheet, assuming 2 µL of the sample (either depleted or total RNA) would be added to each well
- Adhere to the thermocycling instructions included in the Technical Data Sheet for the KAPA SYBR FAST One-Step qRT-PCR Kit
Note: To confirm primer specificity, dissociation/melt curve analysis is advised.
Data analysis
- Plot the Ct values for total and depleted RNA for both primer sets for comparison
- Ideally, the control (total RNA) and sample GAPDH Ct scores will be comparable (depleted RNA). This suggests that GAPDH was not lost and that the loss of non-specific material during rRNA depletion was limited.
- Ideally, the depleted samples’ 28S Ct values will be much higher than the control samples. This shows that the rRNA concentration in the depleted sample is lower than the total RNA concentration.
- To determine the delta Ct (dCt) score, subtract the Ct scores for each sample and assay (Ct depleting sample−Ct control sample)
- The GAPDH dCt value should ideally be near 0. This number may vary from −1 to 1 for RNA of excellent quality. When using FFPE-extracted RNA, this figure can go as high as 3.
- The 28S dCt value should ideally be under ≥10. For samples with dCt ≥7, efficient depletion (>95%) has been noted. Samples having a 28S dCt of less than <7 may have rRNA carryover of more than >5%.
About Roche Sequencing and Life Science
 Roche Sequencing & Life Science is part of Roche Diagnostics, which, along with Roche Pharmaceuticals, plays an important role in modern healthcare. Roche Diagnostics’ broad range of innovative diagnostic tests and systems play a pivotal role in the groundbreaking area of integrated healthcare solutions and cover the early detection, targeted screening, evaluation and monitoring of disease. Roche Diagnostics is active in all market segments, from scientific research and clinical laboratory systems to patient self-monitoring.
Sponsored Content Policy: News-Medical.net publishes articles and related content that may be derived from sources where we have existing commercial relationships, provided such content adds value to the core editorial ethos of News-Medical.Net which is to educate and inform site visitors interested in medical research, science, medical devices and treatments.