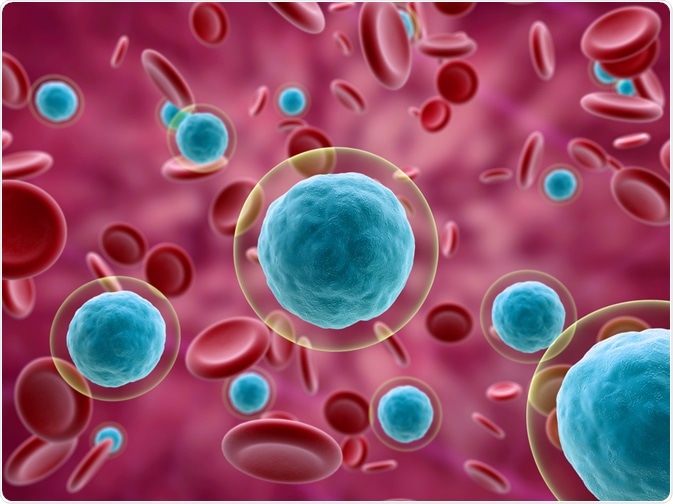
Flow cytometry is a widely-used laser-based technique that can be used to measure and quantify cell size, cell granularity, cellular markers, and intracellular components such as proteins and nucleotides. This analytical technique provides simultaneous multi-parameter analysis that can be used to support conclusions in scientific publications.
 Peeradach R | Shutterstock
Essential factors to consider before publishing flow cytometry data
Experimental set up and sample preparation
Prior to submitting a publication, it is crucial that the authors include a detailed description of the experimental design. This description should include the number of independent experiments that were performed during the course of the study and number of samples analyzed during each experiment. Preparation of the samples or cells suspensions analyzed by flow cytometry must also be explained.
Flow cytometry preparation methods include the use of specific proteases for the isolation, filtration and lysis of any particular cell type, as well as permeabilization and fixation reagents. This information ensures reproducibility and assists other researchers in future experiments.
Data acquisition
The methodology and parameters used for flow cytometry data acquisition should include the equipment’s manufacturer, model, software, lasers and laser power settings, as well as the optical emission filters that were used for each fluorescent reagent.
Compensation or mathematical correction processes to eliminate spectral overlap between the fluorochromes must also be described. Furthermore, the exact masking strategies, such as use of certain software features also improve reproducibility of experiments.
Sample size or number of cells counted in the population of interest and the minimum number of events for a target population must also be indicated.
Analysis of the data obtained and presentation
Careful data analysis of the vast amount of information obtained from flow cytometry is a crucial part of any publication.
Gating schemes
When describing gating schemes, aspects such as light scatter gates, live-dead gates, doublet gates and fluorescence-detecting gates must be addressed.
Defining thresholds
It is critical that authors include all information regarding controls that were used. These include unstained, biological, isotype, fluorescence minus-one or negative controls present within the cell suspension.
Statistical analysis
Statistical analysis, including whether the data represents a comparison among a mean, median or percentage, should also be included.
Presenting data
Authors may choose various presentation styles, such as dot or density plots, to highlight the cell population of interest. When considering dot plots, it is important to label both axes and include whether a linear or logarithmic scale is being used.
It also recommended that the antibodies or fluorophores are directly labeled in the plot. Percentages should be listed in gates, whereas the number of total events in a plot should be indicated in the plot or figure legend.
Standardization in flow cytometry data
Despite the wide range of flow cytometry applications, this technique has been scrutinized on its reproducibility due to lack of standard methods to accurately compare flow cytometry data.
The complexity of the data warrants the need for minimum standards. Flow cytometry researchers would also benefit from a more formalized framework for this technique, including guidelines on experimental and sample information, acquisition, analysis, and presentation of data.
Conclusion
To improve the reproducibility of data obtained from flow cytometric analysis and make it easy to understand for readers, it is essential to include detailed explanations of how the analysis was performed. By including this information, researchers can easily validate the quality of data and conclusion drawn.
Further Reading
Last Updated: Apr 3, 2019