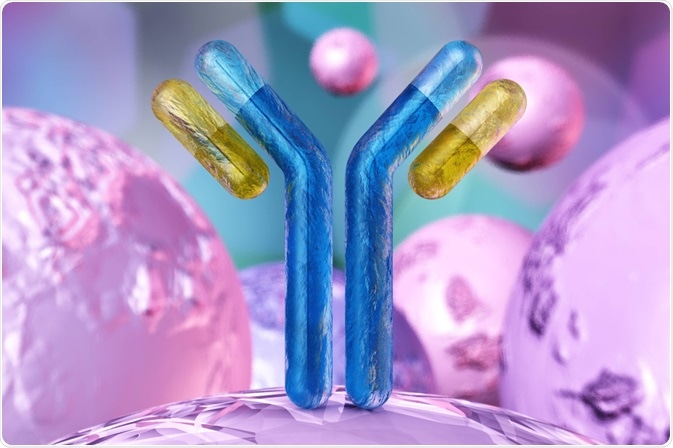
A research group from the University of Bath have used a sensitive approach to protein structure stability, with immediate use in the biopharmaceutical industry. The method, fluorescence red edge excitation shift (REES) demonstrated high sensitivity in predicting monoclonal antibody (mAb) stability in the short, medium, and long term.
 Image Credits: ustas7777777 / Shutterstock.com
REES data could consistently distinguish between structurally identical monoclonal antibodies across the micro to milligram/ml range. As such, Pudney et al. promises immediate use in quality assurance, formulation, and development procedures in the biopharmaceutical industry
The challenge of developing stable protein formulations
A major challenge in the development of therapeutic monoclonal antibodies (mAb) is the structural heterogeneity and aggregation. Stable biomolecules are essential to the commercial viability and efficacy of mAb and other biopharmaceuticals. Methods of tracking stability is a challenge.
REES: a potential approach to capturing changes in a proteins profile
Several techniques have been developed to address the issue of stability; of them, fluorescence red edge excitation shift (REES) is most sensitive to a range of protein structure changes and dynamics. It exploits the properties of tryptophan (Trp) property of excitation-emission.
Shifts in the maximum emission, along with decreasing energy or excitation are seen; this occurs as lower energy photons excite the discrete conformational state of the Trp-solvent system. Named the REES effect, its typical application is in distinguishing between the folded or unfolded state of a protein
The team demonstrates that direct quantification of REES data instead can reveal the dynamism of protein structures – their conformational states, characterized as the free energy landscape (FEL) of a protein.
This approach works for multi-Trp proteins, where differences in flexibility of molecules can be seen in structurally identical X-ray structures.
Improving REES: quantifying the data
Pudney et al. termed their method of quantifying REES data, QUBES (quantitative understanding of bimolecular edge shift), to distinguish it from other treatments of REES data.
The group measured change in the center of spectral mass (CSM) variance with respect to the amplitude, A, of an exponential with a curvature determined by R. The plot produces a three-dimensional data point.
Previously, Pudney et al. found that the measured ratio A/R changes with protein flexibility. Large A/R values reflect more flexible proteins and small A/R values reflect a more rigid protein. However, the ratio alone is inadequate to capture the full information content. Hence an exponential function must be fitted to capture all information
The antibodies for which QUBES data was measured represented different classes and tested in buffer systems not used in commercial formulations so more valid comparisons could be made.
Fluorescence measurements were performed on therapeutic antibodies subject to unfolding and aggregation. Structure-based calculations were made using Fab regions of X-ray structures and the rigidity using a score termed sum value of rigid clusters, SVRC. The higher the value of SVRC, the more rigid the structure.
QUBES data are sensitive to mAb flexibility
The group extracted a parameter termed sum value of rigid clusters (SVRC), that vary significantly despite the high structural similarity. This quantifying of the REES effect for multi-Trp proteins gives a unique ‘fingerprint’ for different monoclonal antibodies, demonstrating its sensitivity.
The QUBES data is sensitive to monoclonal antibody flexibility over a range of time and length scales – from small internal shifts in configuration to more rapid conformational sampling motions by the hypervariable loop (HVL) regions of the Fab.
The information and sensitivity revealed by QUBES
The information of QUBES data included an ability to determine between native and denatured, and folded and unfolded proteins.
The sensitivity of this method was assessed by studying the response of the antibodies to a range of physical and chemical perturbations that mimic those experienced by monoclonal antibodies during the process of manufacture.
QUBES predicts protein stability
Extracted QUBES A/R data values were compared to the fractional loss of protein monomer as assessed by DLS dynamic light scattering. The similarity between these indicates that their quantification methods can be used to predict the thermodynamic stability of a sample.
A summary of the detection capability of QUBES data
The group summarized the detection capability of their QUBES data, showing the 3D plot generated can be used to predict the state (unfolded, destabilized, stabilized, and aggregated). Using their approach, accurate detection, separation, and quantification of protein unfolding, and early stage of soluble aggregation (as a predictor for stability) can be made.
The group stressed that the data can be simplistically interpreted using the A/R alone. As such, all QUBES must be used to assess a protein’s stability.
QUBES also offers the following advantages; rapid (<5 minutes) data acquisition facilitating large screening requirements; multi-Trp protein analysis, enabling analysis of most proteins; broad sample concentrations (μg - mg)to minimize consumption; and, ability to monitor the stability of proteins of any size across a range of solvent or buffer environments.
These findings indicate a potential means to fingerprint protein structure and stability, improving the discovery and development of mAbs and biopharmaceuticals at large.
Source
Pudney, CR et al. (2020) Monoclonal antibody stability can be usefully monitored using the excitation-energy-dependent fluorescence edge-shift. DOI: 10.1101/2020.03.23.003608.
Further Reading
Last Updated: Jun 23, 2020