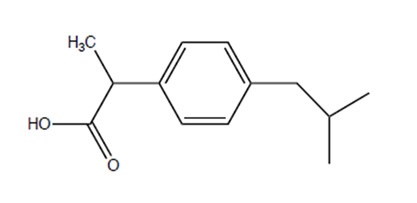
Ibuprofen (C13H18O2), previously named (RS)-2-(4-(2-methylpropyl)phenyl)propanoic acid, contains the molecular fragments propionic, iso-butyl and phenyl.
It is a non-steroidal, anti-inflammatory drug (NSAID) that is used to alleviate swelling and pain. The Boots Drug Company patented the use of ibuprofen in 1961 and now it is widely available and marketed under numerous different generic and trade names.
Permanent magnet-based NMR instruments use 2M ibuprofen in CDCl3 as the demonstration sample of choice as there is no significant signal overlap and the signals demonstrate interesting spectral phenomenon. One- and two-dimensional spectra of 1H and 13C, along with their interesting features, are demonstrated in this article.
The resolution possible with the EFT-90 spectrometers is shown by the proton spectrum seen in Figure 1. In all the peaks, 1H-1H proton coupling is resolved, even in the CH at the position ‘8’, which is split by the methylene (H7) and the two methyl's (H9, H10). Normalization of the carboxyl resonance integral at 12.25 ppm was performed to 1.00.
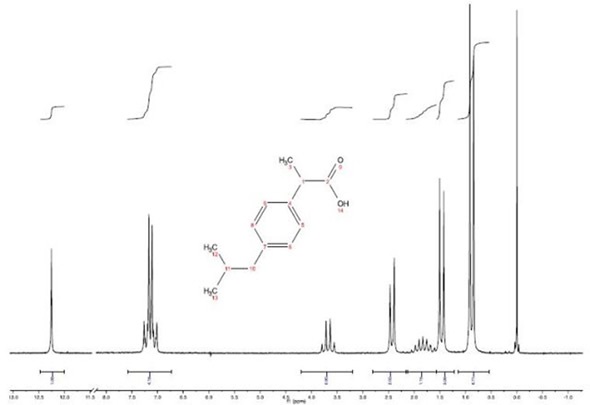
Figure 1. H NMR spectrum of 2M Ibuprofen taken with a single scan
C Spectrum of Ibuprofen
It took one minute (12 scans) to obtain the 13C spectrum, which has nine resonance signals, all of differing intensity. The spectrum is shown in figure 2.
The weak signals (181.5, 140.7, and 137.0 ppm) represent the carbons that are missing a directly attached proton (C2, C4, and C7), which are usually significantly smaller then carbons that do have a proton attached. It is possible to improve non-protonated carbon signals by using a pulse width of 30˚ rather than 90˚ and by increasing the relaxation delay (RD) by a factor of 2 to 3.
On examining the chemical structure, it can be seen that carbons 12 and 13 are magnetically and chemically equivalent, as are each of the aromatic protonated carbons in the phenyl ring – carbons 5, 9 and carbons 6, 8 are equivalent. This is due to a line of symmetry from carbon 4 to 7, which explains the approximate 2:1 intensity variation for the resonances at 20, 127 and 130 ppm. The 45 ppm resonance needs to be analysed further.
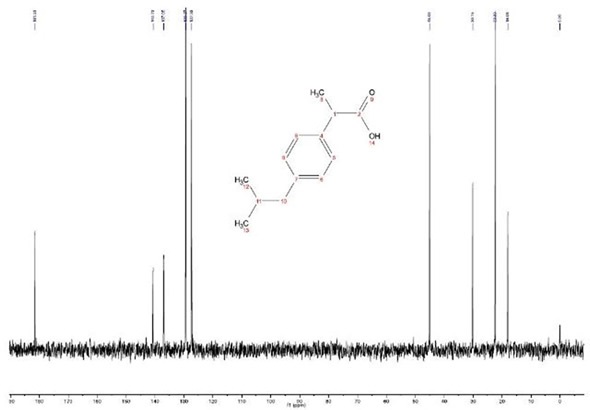
Figure 2. 13C Spectrum of 2M Ibuprofen recorded with 12 scans with a total acquisition time of 1 minute
Distortion-less Enhancement via Polarization Transfer (DEPT)
The 13C DEPT experiment is an exceptional technique for determining whether each carbon signal is a CH, CH2, or CH3. An alternative name for this experiment is spectral editing, as it is possible to manipulate these signals using the pulse sequence in order to obtain more data about the chemical structure.
Using a combination of three DEPT experiments, this experiment differentiates between methylene, methine, quarternary and methyl groups. The spectra obtained through the 13C DEPT experiment used in the EFT spectrometers include DEPT45, DEPT90 and DEPT135.
The NUTS processing software collects the spectra as a single data array and processes them automatically. Single experiments such as the attached proton test (APT) and the DEPT135 are also possible.
In the example shown in Figure 2, there is clearly an issue with the 45 ppm peak. In the DEPT90 experiment, the polarization transfer is the greatest for CH peaks. The CH peaks in the DEPT90 must therefore be larger than those in the DEPT45 and DEPT135, similar to the peaks at 130 ppm and 30 ppm. Similarly, in the DEPT135, the peak at 45 ppm is hardly pointing down, indicating that it is CH2.
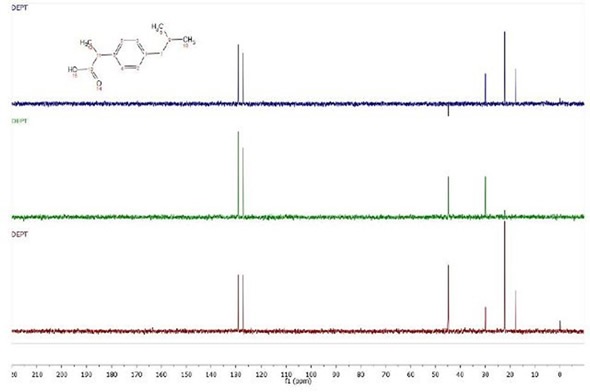
Figure 3. DEPT 45, 90 and 135 (plotted from bottom to top) spectra of ibuprofen.
Heteronuclear Correlation (HETCOR)
The Heteronuclear Correlation (HETCOR) experiment is a two-dimensional experiment showing coupled C-H pairs. The contour plot’s vertical and horizontal axes represent the 1H spectrum and the 13C spectrum, respectively. The experiment can also be carried out for other X-nuclei. In fact, a 19F-13C correlation spectrum can be achieved with the EFT. Additional modifications of the delays in HECTOR can enable long range coupling information to be obtained.
Finally, it can be seen in this experiment (figure 4) that the 13C peak at 45 ppm is actually two distinct 13C peaks, which are assigned to C7 coupled to the doublet resonance at 2.5 ppm and C11, which is bonded to the H falling at 3.7 ppm. This accidental degeneracy can even be seen on high field spectrometers (600 MHz). When ibuprofen is dissolved in DMSO, this degeneracy is eliminated and the resonances show a minimal chemical shift difference, of less than 1 ppm. This explains the interesting results achieved during the DEPT experiment, as well as the absence of 10 peaks in the 13C one-dimensional spectrum.
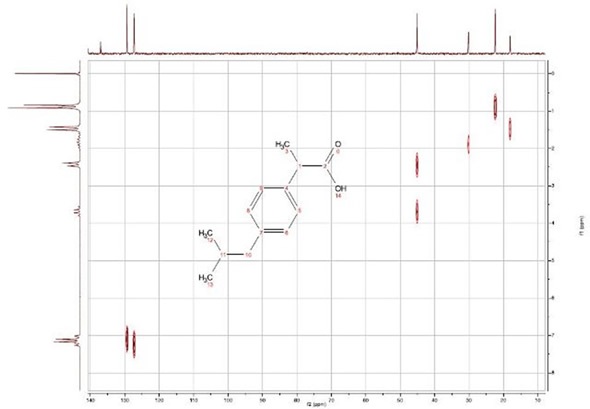
Figure 4. {1H}-13C HETCOR spectrum for 2M ibuprofen at 90 MHz
About Anasazi Instruments
 Anasazi Instruments has been providing high quality, rugged, easy-to-use 60 and 90 MHz NMR spectrometers and upgrades to the educational and industrial markets. These instruments have been successfully implemented at hundreds or institutions ranging from large companies and top-tier universities to community colleges throughout North and South America. In research environments, the Eft is a cost-effective workhorse for synthetic and analytical laboratories.
Sponsored Content Policy: News-Medical.net publishes articles and related content that may be derived from sources where we have existing commercial relationships, provided such content adds value to the core editorial ethos of News-Medical.Net which is to educate and inform site visitors interested in medical research, science, medical devices and treatments.