Introduction
This article shows how the absorbance maxima of Ponceau-S is determined over a wavelength range of 220nm to 800nm using the Eppendorf BioSpectromenter®. The methods of analysis using this BioSpectrometer® are the detection of a maximum at 498nm while utilizing the function, Eppendorf “SpectraZoom”. Using the example of Ponceau-S, the colorimetric measurements were done by generating a standard curve. This standard programmed curve was then utilized to measure the concentration of unknown sample.
Colorimetric tests permit the indirect determination of the concentrations of specific substrates like carbohydrates or proteins and also the measurement of enzyme activity through change in color. Such reactions are usually performed within the spectrophotometer. Principally, all test recordings take place in the wavelength of 380nm to 780nm which is light’s visible range.
Colorimetric Assays for Protein Determination
Using Bradford’s protein determination technique, the dye G-250 Coomassie brilliant blue is first used to stain the protein. During the reaction process, a complex of dye and protein is formed in the acidic environment. While this complex is being formed, the solution changes color to blue. The strength of the color relates to the protein concentration within the solution. Therefore, concentration of protein can be measured indirectly by evaluating the intensity of color through photometry (Figure 1).
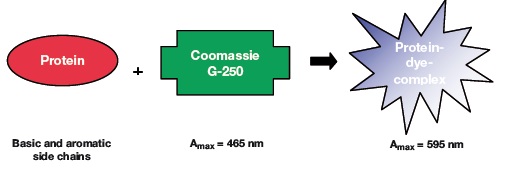
Figure 1. Protein staining principle using the Bradford method
The protein-dye complex, thus formed, alters the dye’s absorbance maximum from 465 to 595nm. After 5 to 10 minutes of incubation period, the complex i.e. protein-dye complex remains stable and it can be evaluated in the spectrophotometer at a wavelength of 595nm.
Colorimetric Assays for the Determination of Enzyme Activity
In enzymatic reaction involving the use of artificial substrate, a chromophore is released after enzyme cleavage. This reaction can be assessed using photometry. Therefore, enzyme activity can be evaluated by the amount of dye released and the time taken for incubation of the enzyme reaction. The example shown in Figure 2 is the reaction between α-glucosidase and para-nitrophenyl-α-D-glucopyranoside.
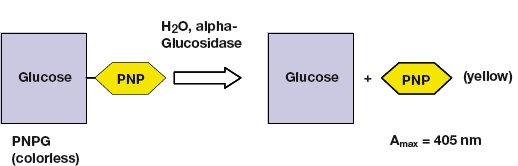
Figure 2. Reaction of an α-glucosidase with paranitrophenyl-α-D-glucopyranoside.
When para-nitrophenol (PNP) is released, the solution changes to a yellow color which can be detected easily. This reaction is eventually arrested by adding an alkaline solution of sodium carbonate.
Evaluation of Colorimetric Tests in the Spectrophotometer
The common principle in colorimetric methods of detection is that the enzyme activity or concentration of an unknown sample is assessed by a calibration curve. The creation of such a curve involves successive measurement of various known standards by a spectrophotometer. This is followed by regression analysis. The generated calibration curves are either linear (Figure 3) or non-linear (Figure 4).
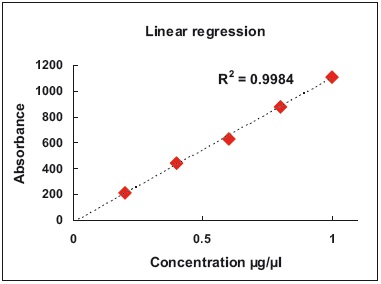
Figure 3. Standard curve with linear shape. Example: Determination of fructose
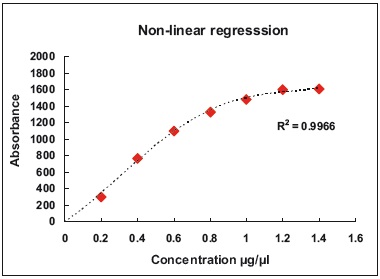
Figure 4. Standard curve with non-linear regression. Possible shape of a Bradford standard curve
Materials
Instruments - Kinetic or basic Eppendorf BioSpectrometer®
Materials - Water; 0.01 % (w/v) Ponceau-S solution; and Eppendorf cuvettes
Execution and Results
Maximum Absorbance Determination of the Dye Ponceau-S
In order to determine the maximum absorbance of the dye Ponceau-S, a primary wavelength scan is done between 220 and 800nm by means of a BioSpectrometer®. In the main menu, “Absorbance” is chosen followed by subgroup “Scan” (Figure 5).
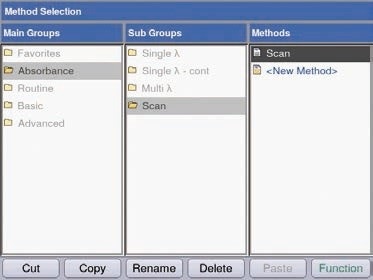
Figure 5. Selection of the method “Scan” for spectroscopic analysis of the dye Ponceau-S using the Eppendorf BioSpectrometer®.
The parameters to be scanned are subsequently determined. The “Edit” soft key in the “Check parameters” area enables adjustment of the range of wavelength and the cuvette’s path length (Figure 6).
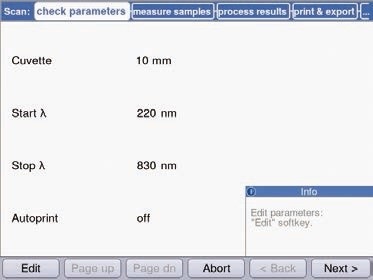
Figure 6. Measurement parameters for the wavelength scan of the dye Ponceau-S.
On selection of all parameters, the “Next” soft key leads to the “Measure samples” area. To scan the wavelength, water is initially blanked followed by the sample solution of 0.01% (w/v) Ponceau-S (Figure 7).
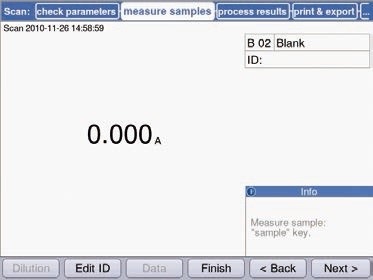
Figure 7A. Blank measurements for the scan.
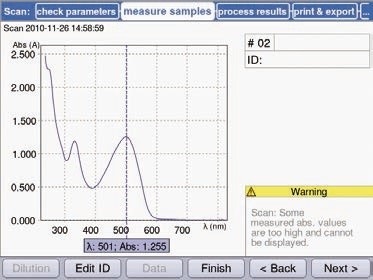
Figure 7B. Wavelength scan of a 0.01% (w/v) Ponceau-S solution between 220 and 800nm.
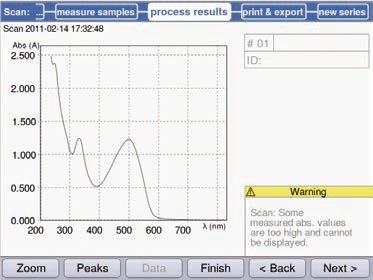
Figure 7C. Process results: Peak detection (“Peaks”) or zoom function (“Zoom”).
Two peaks are visible in this spectral range as portrayed in Figure 7B. The “Next” soft key activation leads to the “Process results” area. The option to identify exact maximum absorbance wavelengths is present here (Figure 7C). Two functions are offered by Eppendorf BioSpectrometer®, fulfilling the “SpectraZoom” function and the “Peak detection” function.
Generation of a Standard Curve for the Purpose of Photometric Analysis of a Colorimetric Assay
The section below shows the way various standards are evaluated using a BioSpectrometer® in order to produce a standard curve. In relation to this, 10 defined concentration standards of Ponceau-S are made. An overview of the standards to be analyzed is represented in Table 1.
Table 1. Concentrations of standard solutions
|
Number
|
Concentration [mg/mL]
|
|
1
|
100
|
|
2
|
200
|
|
3
|
300
|
|
4
|
400
|
|
5
|
500
|
|
6
|
600
|
|
7
|
700
|
|
8
|
800
|
|
9
|
900
|
|
10
|
1000
|
The “Calibration curve” method for evaluation of standards in the BioSpectrometer is activated (Figure 8).
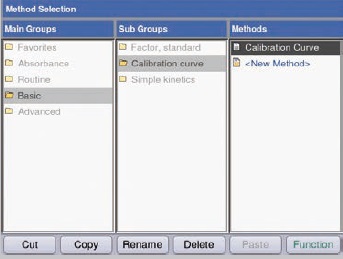
Figure 8. Selection of the method “Calibration curve”
Changes can be made to the parameters with the “Edit” soft key (Figure 9).
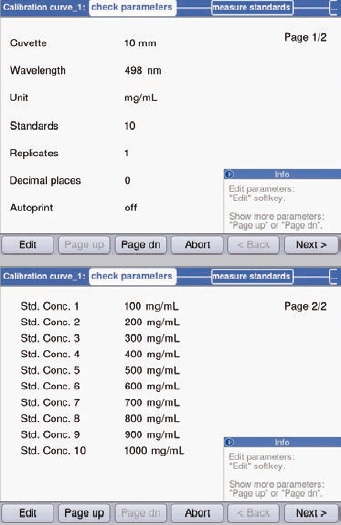
Figure 9. Selection of the method “Calibration curve”
On completion of the standard programming, the “Next” soft key leads to the “Measure standards” area. This facilitates the measurement of all standards in succession or any random order. Measurements are repeated, if required. The “Standards” button is used to measure a standard. The “Curve fit” soft key drafts the type of standard analysis for the obtained values.
This command may be changed when selected at any point of the analysis. If the required values are available, curve analysis calculations are performed automatically. In regression analysis, the determination coefficient is displayed automatically. The change in the determination coefficient following the change in the type of regression is displayed in Figure 10.
When the basic requirement of standards is available for testing, the standard evaluation area may be overlooked with the initiation of determination of concentration of unknown samples. The determination coefficient, as seen in Figure 10, could be made better by alternating to quadratic regression from linear regression. The resultant curves reflect this after measuring all standards (Figure 11).
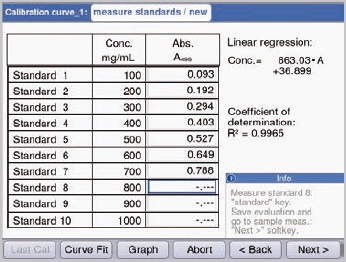
Figure 10A. Programming of the parameters required for the measurement of a standard curve.
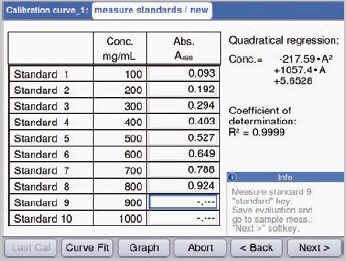
Figure 10B. Definition of the standard concentrations to be measured.
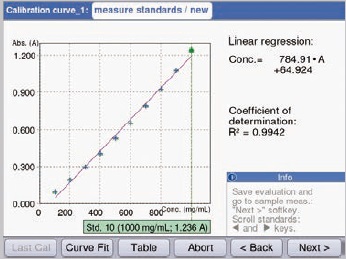
Figure 11A. Change of regression analysis from linear.
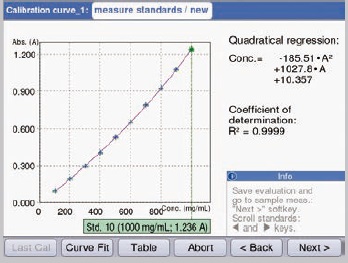
Figure 11B: Change of regression analysis to quadratic.
On establishment of the standard curve, initiation of sample measurement takes place immediately. The “Next” soft key directly leads to the area of measurement. Figure 12 shows an example of a sample measurement. The resulting measurement of the sample is directly displayed within the curve’s standard in Figure 12. This shows the range of standards selected coherently for sample determination.
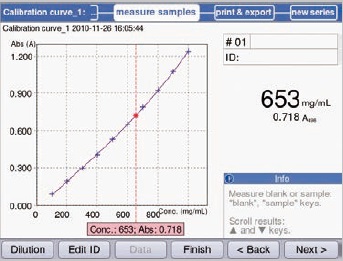
Figure 12. Sample determination via standard curve. The result is directly linked to the generated standard curve.
Conclusion
With the aid of the Eppendorf BioSpectrometer®, simple and quick measurement of the maximum absorbance within a spectral range can be made using the functions of peak detection and zoom. This aids in precise determination of the wavelength at which any chromophore is to be analyzed colorimetrically.
The measurement and programming of standards are simple and quick; repetition of individual standards may be done as and when required, and techniques of curve analysis may be retroactively fitted before saving the method of analysis, initiated by sample measurement switch. The analytical techniques are available in five different ways. The result of the measurement of the sample is directly displayed in the curve’s standard to aid evaluation of the preciseness of the range of standard curve.
Acknowledgements
Produced from materials originally authored by Martin Armbrecht from Eppendorf AG, Hamburg, Germany.
About Eppendorf NA
Eppendorf NA, with headquarters in New York, are a subsidiary of Eppendorf AG (Hamburg, Germany) – manufacturer of laboratory instruments and consumables for the life sciences.
To make it easy for labs in the United States to benefit from Eppendorf quality, they provide total customer support and service: taking/tracking orders; product installation and training; application support; calibration services; general product maintenance and repair, and more!
Eppendorf's products
Eppendorf products are used in all types of life science research and testing settings – from basic laboratory applications to highly specialized cell and molecular biology applications. They are highly regarded for their quality design and performance – beginning with extensive research and development, adding state-of-the-art technology and ending with strict quality-controlled manufacturing are what make their products stand out from the rest. It is what has made them a brand you have been able to rely on for over 70 years.
Over the years Eppendorf has improved upon and added to their flagship products – pipettes and pipette tips, centrifuges and microcentrifuge tubes – to now include the most ergonomic liquid handling devices and automated pipetting stations, quiet centrifuges, fast and fully flexible thermal cyclers, sample-protecting deepwell plates, cell manipulation systems and microcapillaries, ultra-low temperature freezers, shakers, incubators and bioprocessing equipment.
Eppendorf's services
Customer Support Representatives are available M–F, 8:30 AM – 8:00 PM (EST).
Local Sales Representatives cover the entire US to give you the fastest best possible attention. They know their products – and better yet, they know your applications. Feel confident in their abilities to assess your needs and determine the best products and systems to give you the best results.
Field Specialists also cover the entire US to provide post-sales installation and training on their specialty systems and automation.
The Applications Hotline is manned by degreed scientists working in their own fully functional life science laboratory. They are on call and email-accessible to help you troubleshoot your application or answer any technical question you may have. The Eppendorf Services group provides a wide variety of support services such as pipette calibration, instrument maintenance programs, and expedited repair.
Sponsored Content Policy: News-Medical.net publishes articles and related content that may be derived from sources where we have existing commercial relationships, provided such content adds value to the core editorial ethos of News-Medical.Net which is to educate and inform site visitors interested in medical research, science, medical devices and treatments.