Substantial interest has been shown towards the testing of solid dosage samples more often than the ten per batch recommendation by the US Pharmacopeia monograph on content uniformity (CU). The European Union has expressed concern over the need for improved statistical sampling methods and the FDA has stepped up focus on the process analytical technology (PAT) initiative for improving the understanding and monitoring of production. Consequently, the near-infrared spectroscopy (NIRS) has gained increasing interest for tablet assay and content uniformity testing. For tableting campaigns, real-time processing feedback can be obtained with NIRS as it allows rapid at-line analysis.
Transmission NIRS is preferred over reflectance NIRS because of the heterogeneous composition of tablets, yielding more reliable results for bulk tablet analysis. However, coating analysis may be performed with the reflection NIRS method. HPLC-based laboratory tests for tablet assay and content uniformity are time-intensive processes due to the involvement of steps, such as buffer mixing, volatile solvent procurement, disposal, and extended calibration runs, thus taking several hours to provide content uniformity results for just 10 tablets. Consequently, the availability of results for batch release or to tablet press operators may run into days or even weeks after the compression of tablets.
Assay and CU issues can be prevented from exceeding the acceptable limits by applying statistical process control (SPC) techniques while measuring the tablets real time with NIRS during the tableting stage itself. In this article, the percent label claim, pass/fail indication, and percent relative standard deviation (RSD) were calculated for a content uniformity study using the Dedicated Routine Analysis software for tablet content uniformity determination.
Experimental Procedure
The analysis was conducted on five batches of tablets with a diameter of 0.25-inches and weight of 100mg. Each tablet of a batch was formulated with 0mg placebo tablets, and 0.1, 0.5, 1.0 and 2.0mg of chlorpheniramine maleate (CPM), and subsequently compressed into tablets on an Elizabeth-Hata HT-AP 18 SS-U/I rotary tablet press. For this experiment, NIRS XDS MasterLab was used for NIR measurements. This instrument can automatically measure multiple tablets once they are placed in a special tray (Figure 1).
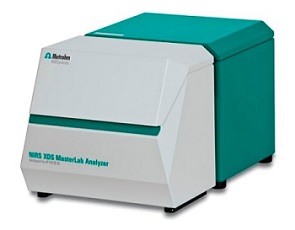
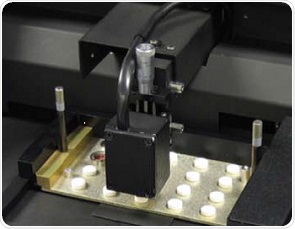
Figure 1. The NIRS XDS MasterLab and tablets in transmission mode
Figure 1 shows that the tablet tray is placed on the left side and the NIST traceable standards tray on the right side for wavelength and photometric accuracy and precision. There were 20 positions available on the tray for accommodating tablets of four different sizes, and 5 positions for 0.25-inch diameter tablets of interest. Loading the tray for two times allowed all 10 tablets to be scanned within 5 minutes. A reference spectrum was taken prior to the scanning of each set of 5 tablets. Recording of the spectra was done in the transmission mode between 800 and 1650nm with data intervals of 0.5nm. A single spectrum was then produced by co-adding 32 scans.
Results and Discussion
The raw NIR spectra obtained from the calibration set and the spectrum of pure CPM (green color) are shown in Figure 2.
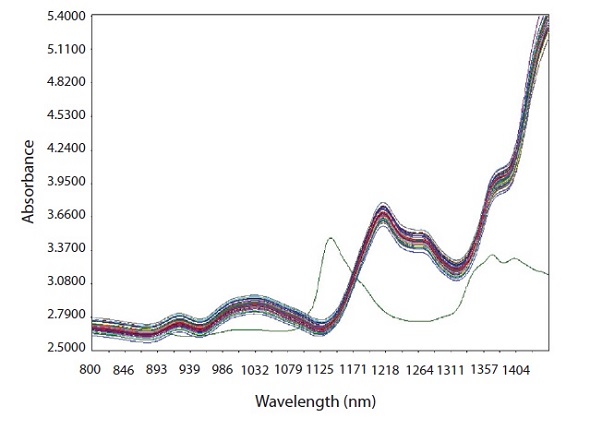
Figure 2. Raw spectra of calibration samples with spectrum of pure CPM
Normalizing the baseline and improving the spectral features by taking the spectra’s second derivative allowed observing the “fanning out” of the analytical region for CPM at 1138nm (Figure 3).
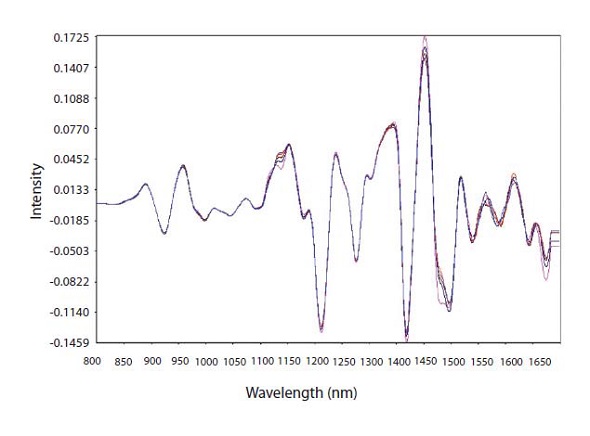
Figure 3. Second derivative math pretreatment of calibration spectra
The derivative was smoothed with a segment of 10 and gap of 0. Tablet thickness and density difference were corrected by applying a thickness correction as a math pre-treatment. The expanded analytical band that illustrates the linear response from 0.1 to 2.0mg CPM is shown in Figure 4.
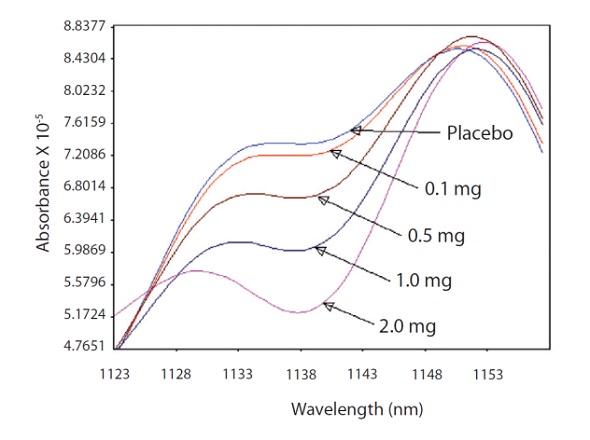
Figure 4. The fanning out of the analytical region of the spectra where the CPM has a strong absorption band at 1138nm.
A prediction model was developed using the partial least squares (PLS) regression, which is different from the principle component regression (PCR) and is based on principal component analysis. The Vision® software that is provided along with the instrument determined the exact number of principal components or factors at the point where the predicted residual error sum of squares (PRESS) is minimum. A plot of the PRESS that leads to a model having eight factors is shown in Figure 5.
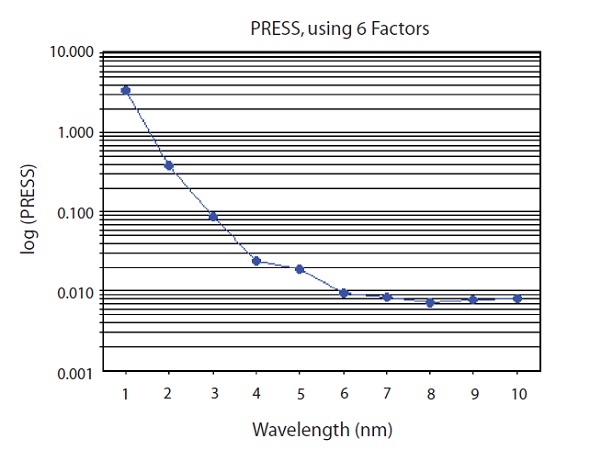
Figure 5. PRESS plot of PLS factors used to predict CPM concentration. 6 factors used
Out of the eight factors, only six were used by the chosen model, thus compromising on robustness for the sake of decreased error. For the chosen six factors, the PRESS was 0.0095. A plot of the principle component loadings around the absorption band of 1138nm for CPM is shown in Figure 6.
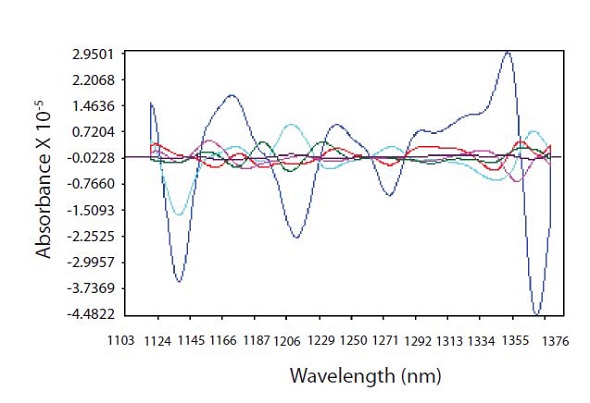
Figure 6. PLS loadings spectra showing where CPM is highly correlated with spectral data at 1138 nm and regions used for thickness correction
The spectra-like loadings are not noisy, which demonstrates good modeling characteristics for the selected factors. The R2 value was 0.9998 for the resulting model with a standard error of calibration (SEC) of 0.0119 and a standard error of prediction (SEP) of 0.01. Good predictability of the model was shown by the one-left-out cross validation with a standard error of cross validation (SECV) of 0.0148. The CPM amounts predicted by NIR were plotted against the HPLC results for each tablet belonging to the calibration set (Figure 7). At each level for validation of prediction model, one tablet was excluded out of the calibration set.
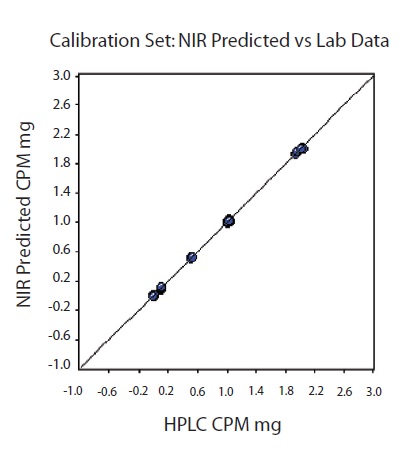
Figure 7. Calibration set. NIR predicted versus CPM value. R2 = 0.9998, SEC=0.0119, SECV=0.0148
The NIR predictions of the validation set were plotted against the HPLC results for each CPM tablet (Figure 8).
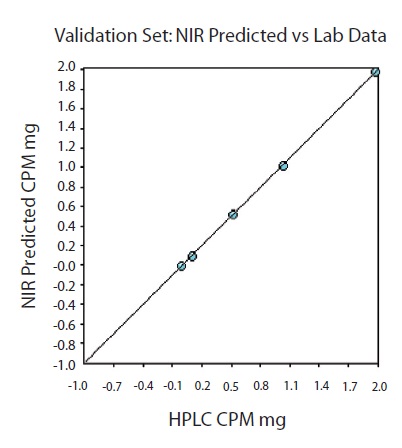
Figure 8. Validation set. One tablet was left out of the calibration set at each level for model validation. SEP=0.01
For tablets composed of 0.1mg CPM, the repeatability results are shown in Table1.
Table 1. Repeatability results for 0.1mg CPM
|
Tray Tab #
|
NIR
|
HPLC
|
Residual
|
|
Tablet #1a
|
0.099
|
0.103
|
-0.004
|
|
Tablet #1a
|
0.102
|
0.103
|
-0.001
|
|
Tablet #1a
|
0.107
|
0.103
|
0.004
|
|
Tablet #1a
|
0.104
|
0.103
|
0.001
|
|
Tablet #1a
|
0.109
|
0.103
|
0.006
|
|
Tablet #1a
|
0.107
|
0.103
|
0.004
|
|
Tablet #1a
|
0.114
|
0.103
|
0.011
|
|
Tablet #1a
|
0.107
|
0.103
|
0.004
|
|
Tablet #1a
|
0.101
|
0.103
|
-0.002
|
|
Tablet #1a
|
0.114
|
0.103
|
0.011
|
|
Residual for Tab#1a Precision:
|
0.0051
|
|
Bias:
|
0.0034
|
|
Avg. for 5 tabs: Precision:
|
0.0039
|
|
Bias:
|
0.0018
|
The values of the average precision and bias for the five tablets were 0.0039 and 0.0018, respectively. For the five-tablet set composed of 0.5mg CPM, the average precision and bias were 0.0055 and 0.0057, respectively. The simple routine analysis method in the Vision software enables automated calculation of the content uniformity and production of a report in compliance with 21 CFR part 11 (Table 2).
Table 2. Content Uniformity results for 0.1mg CPM
|
Sample
|
Target
|
Test Result
|
% Target
|
P/F
|
|
1
|
0.100
|
0.091
|
91.491
|
Pass
|
|
2
|
0.100
|
0.099
|
98.655
|
Pass
|
|
3
|
0.100
|
0.103
|
103.421
|
Pass
|
|
4
|
0.100
|
0.101
|
101.487
|
Pass
|
|
5
|
0.100
|
0.100
|
99.782
|
Pass
|
|
6
|
0.100
|
0.099
|
98.910
|
Pass
|
|
7
|
0.100
|
0.101
|
101.139
|
Pass
|
|
8
|
0.100
|
0.100
|
99.987
|
Pass
|
|
9
|
0.100
|
0.100
|
99.649
|
Pass
|
|
10
|
0.100
|
0.102
|
101.616
|
Pass
|
|
Relative Standard Deviation:
|
3.2%
|
Pass
|
The corresponding X control chart for the 0.1mg CPM tablet CU test is shown in Figure 9, since X control charts are for SPC, they can be suitably altered to plot target “label claim” with ±15% control limits.
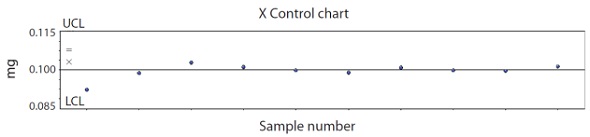
Figure 9. X control chart for SPC monitoring of content uniformity on 0.1mg CPM tablets
A training set with minor increments around the target label claim provides enhanced accuracy and precision. During the development of a calibration model, it is possible to scan the tablets obtained from on-line press processing, send them for HPLC analysis, and select them as calibration samples to encompass the range with a few additional pilot batch samples required for extending the range to ±15% of the label claim.
Conclusions
This article has demonstrated the effectiveness of using the NIR assay for tablet content uniformity determination to rapidly and accurately monitor tablet production in line with the FDA’s PAT initiatives. It is evident from the results that this method could reduce the laboratory workload involved with HPLC analysis and also enable near “real-time” analysis for effective monitoring of the process. The analysis of ten tablets could be completed in less than 5 minutes, and the average repeatability was 0.0039 with a bias of 0.0018 for the 10-fold measurement of five different tablets composed of 0.1mg of CPM. It was observed that the use of a training set with minor increments around the target label claim might improve the precision and accuracy.
About Metrohm
At Metrohm is one of the world’s most trusted manufacturers of high-precision instruments for chemical analysis. Metrohm was founded in 1943 by engineer Bertold Suhner in Herisau, Switzerland. Today, Metrohm is represented in 120 countries by subsidiaries and exclusive distributors. The global Metrohm Group also includes the Dutch companies Metrohm Applikon and Metrohm Autolab, manufacturers of online analyzers and instruments for electrochemical research, respectively. Recently, the Metrohm Group was joined by Metrohm Raman, a leading manufacturer of handheld Raman spectrometers.
Metrohm is the global market leader in analytical instruments for titration. Instruments for ion chromatography, voltammetry, conductivity, and stability measurement make the Metrohm portfolio for ion analysis complete. Instruments for Near-infrared and Raman spectroscopy are another, strongly growing segment of the Metrohm portfolio.
Metrohm is a problem solver, both in the laboratory and within the industrial process. To this end, the company offers their customers complete solutions, including dedicated analytical instrumentation as well as comprehensive application know-how. More than 30% of the company’s employees at the Metrohm international headquarters in Herisau work in R&D.
Metrohm has been owned 100% by the non-profit Metrohm Foundation since 1982. The Metrohm Foundation, which does not exert any influence on the company’s business operations, sponsors gifted students in the natural sciences, supports charitable and philanthropic purposes and, above all, ensures the independence of the company.
Sponsored Content Policy: News-Medical.net publishes articles and related content that may be derived from sources where we have existing commercial relationships, provided such content adds value to the core editorial ethos of News-Medical.Net which is to educate and inform site visitors interested in medical research, science, medical devices and treatments.