In this article, it is demonstrated that visible near-infrared spectroscopy (Vis-NIRS) can be employed to calculate the quantities of a variety of active substances (sodium laureth sulfate (SLES), cocamidopropyl betaine (CABP), cocamidopropylamine oxide (CAW), cocamide diethanolamine (DEA), Carbopol, Polyquaternium-7) in shampoo.
Introduction
Shampoo is a product used to cleanse and improve the appearance of hair, and is generally produced in a viscous liquid state. It is intended to eliminate undesirable build-up in the hair, while maintaining enough sebum to ensure hair remains manageable.
The production of shampoo typically involves the combination of a surfactant, usually sodium laureth sulfate (SLES), with a co-surfactant, frequently cocamidopropyl betaine (CABP), in water. [1]
Additional agents, such as Cocamidopropylamine oxide (CAW), Cocamide diethanolamine (DEA), Carbopol or Polyquaternium-7, are incorporated to accomplish particular textures, foaming behavior or to offer distinctive treatment for hair that is thin, colored or suffering from dandruff.
As is the case with food and drugs, there are guidelines in place for the production of cosmetics which regulate the concentration levels of ingredients that may result in detrimental side-effects. Titration is the most commonly employed method through which to determine the concentration of surfactants in shampoo, but this has a number of downsides.
Titration is slow, requires the use of toxic solvents and must be carried out by a well-trained operator, meaning it is a costly way to carry out routine analysis. This article highlights Vis-NIRS as an effective alternative to routine titration of the listed ingredients (Tab. 1), resulting in a quicker and more cost-effective process.
Table 1. Ingredients of interest and their effect in shampoo and the risk assessment to human body.
| Ingredient |
Effect / Risk assessment |
| SLES (sodium laureth sulfate) |
- degreasing foaming agent
- might cause cancer and skin/eye irritations
|
| CAPB (Cocamidopropyl betaine) |
- foam booster and serves as an antistatic agent
- Claimed to cause allergic reactions.
|
| CAW (Cocamidopropylamine oxide) |
- conditioning agent and surfactant
- in very high concentrations might cause skin irritations
|
| Carbopol |
- Polymer that acts as thickener and stabilizer in shampoos.
- micro polymer that can be ingested and incorporated into and accumulated in the bodies and tissues
|
| DEA (Cocamide diethanolamine) |
- wetting, foaming and softening agent
- might form toxic nitrosamines
|
| Polyquaternium-7 |
- antistatic agent and film former
- low level of hazardless
|
Experimental
This study examined shampoo samples to identify their levels of SLES, CAPB, CAW, DEA, Carbopol and Polyquaternium-7. In order to analyze the relationship between changes in spectral data and reference values, 11-20 samples with varying concentrations of the selected ingredients were prepared.
As such, shampoo pre-mix free from any active ingredient was combined with the pure substances of SLES, CAPB, CAW, DEA, Carbopol and Polyquaternium-7. Tab. 2 demonstrates the exact sample number and the concentration ranges. Different targets are in place for the concentration range of each substance.
Table 2. Sample number and concentration range of the six ingredients of interest.
| Ingredient |
No. of sample |
Concentration range [wt-%] |
| SLES |
20 |
2.0 – 13.0 |
| CAPB |
11 |
0.2 – 1.7 |
| CAW |
14 |
0.2 – 2.0 |
| Carbopol |
16 |
0.2 – 2.5 |
| DEA |
16 |
0.2 – 2.5 |
| Polyquaternium-7 |
12 |
0.2 – 1.9 |
The spectra were collected in transflection on a NIRS DS2500 Analyzer over the full wavelength range (400– 2500 nm), and the samples were filled in quartz glass transflection vessels. A gold reflector with a total path length of 1.0 mm was delicately positioned on the sample, avoiding air bubbles.
For acquisition and management of data, as well as development of the quantification method, the software package Vision Air 2.0 Complete was employed (see Tab. 3 / Fig. 1.).
Table 3. Used equipment and software.
| Equipment |
Metrohm code |
| NIRS DS2500 Analyzer |
2.922.0010 |
| NIRS Liquid Sample Kit Transflection |
6.7400.010 |
| Vision Air 2.0 Complete |
6.6072.208 |
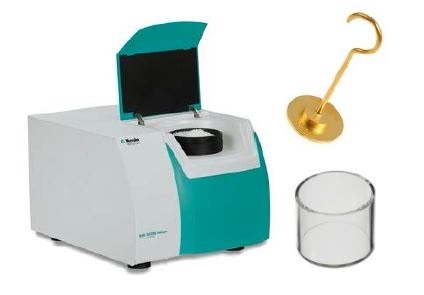
Figure 1. The NIRS DS2500 Analyzer was used for spectral data acquisition over the full range from 400 nm to 2500 nm.
Results
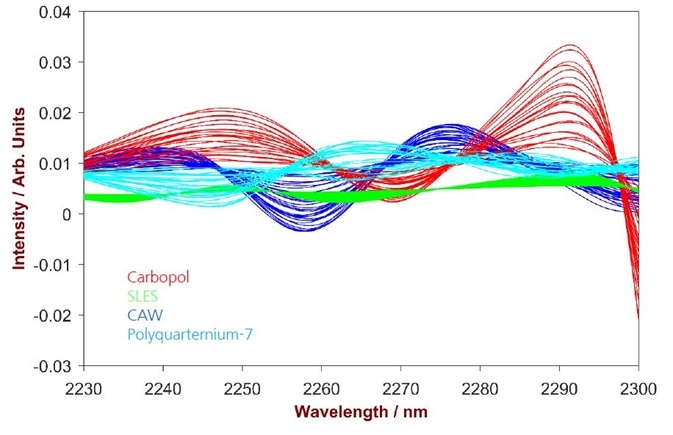
A number of differing spectral areas were chosen, depending on the ingredient (Fig.2). A partial least square regression (PLS) was carried out for each ingredient, using 2nd derivative as data pre-treatment to account for spectral baseline shifts. Internal cross-validation (leave-one-out) was used to substantiate the performance of the derived quantitative models during method development.
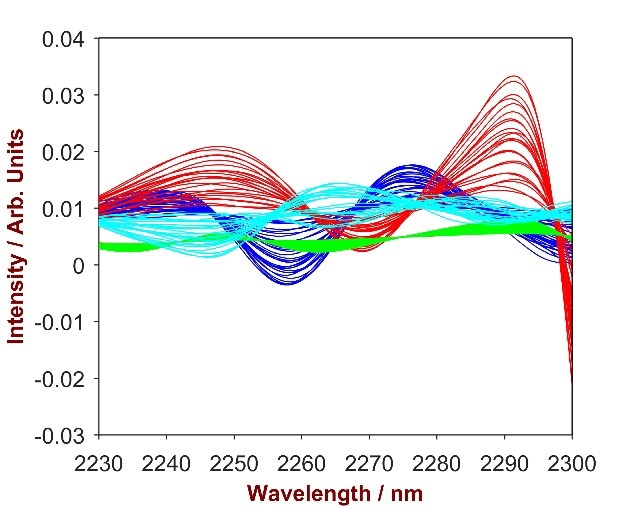
Figure 2. 2nd derivative spectra of 16 Carbopol samples (blue), 20 SLES samples (green), 14 CAW samples (blue) and 12 Polyquarternium-7 samples (turquoise). The overlay identifies the significant wavelength region for every substance.
SLES
The overlay of pure SLES with the SLES-shampoo mixtures (Fig.3) highlights two key wavelength areas (1350–1800 nm and 2200–2420 nm) which were then used to develop a vigorous prediction model.
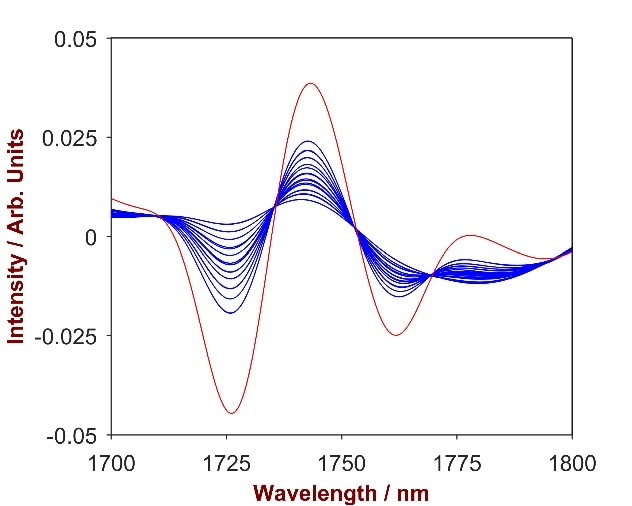
Figure 3. 2nd derivative spectra of 20 SLES-shampoo mixtures with SLES concentration differing from 2.0 – 13.0% (blue). The overlay with pure SLES (red) identifies the significant wavelength region of 1700-1800 nm.
A 1-factor-model with a Standard Error of Calibration (SEC) of 0.34% and a Standard Error of Cross Validation (SECV) of 0.44% was established in order to calculate the concentration of SLES in shampoo.
As shown in Fig.4, a strong correlation was attained between the provided reference values and the calculated values (R2 = 0.9908). Parameters employed for method development and the figures of merit are itemized in Tab. 4
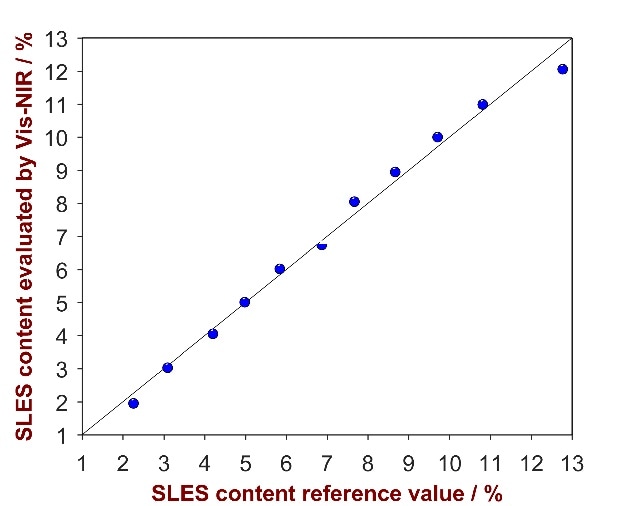
Figure 4. Correlation plot of the predicted SLES content by Vis-NIRS versus the reference values.
Table 4. Results of the quantitative method development for SLES content.
| . |
. |
| Regression model |
PLS with 1 factor |
| Pre-treatment |
2nd derivative |
| Wavelength range |
1350 – 1800 nm
2220 – 2420 nm |
| R2 |
0.9908 |
| SEC |
0.34% |
| SECV |
0.44% |
Method Description
The overlay of pure CAPB with the CAPB-shampoo mixtures (Fig.5) highlights a key wavelength area (2195 – 2265 nm) that was used to develop a vigorous prediction model. A 1-factor-model with a Standard Error of Calibration (SEC) of 0.03% and a Standard Error of Cross Validation (SECV) of 0.05% was established in order to calculate the concentration of CAPB in shampoo.
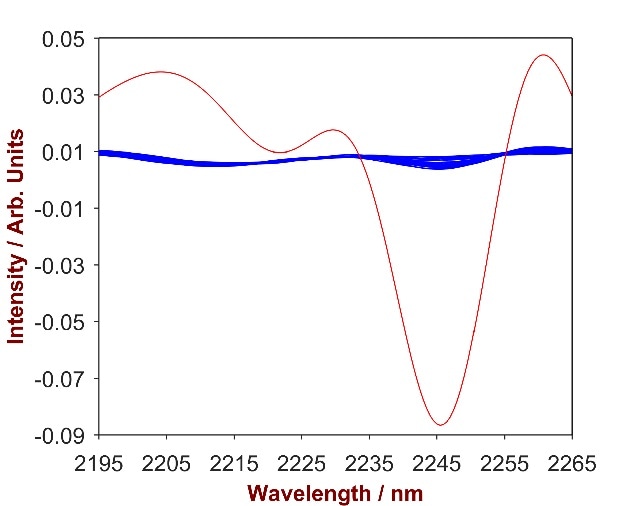
Figure 5. 2nd derivative spectra of 11 CAPB-shampoo mixtures with CAPB concentration differing from 0.2%-1.7% (blue). The overlay with pure CAPB (red) identifies the significant wavelength region of 2195 – 2265 nm.
As shown in Fig. 6, a strong correlation was attained between the provided reference values and the calculated values (R2 = 0.9933). Parameters employed for method development and the figures of merit are itemized in Tab. 5.
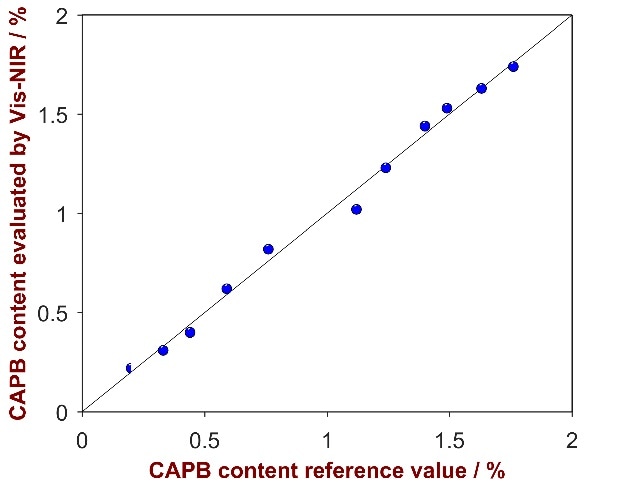
Figure 6. Correlation plot of the predicted CAPB content by Vis-NIRS versus the reference values.
Table 5. Results of the quantitative method development for CAPB content.
| . |
. |
| Regression model |
PLS with 1 factor |
| Pre-treatment |
2nd derivative |
| Wavelength range |
2195 – 2265 nm |
| R2 |
0.9933 |
| SEC |
0.03% |
| SECV |
0.05% |
CAW
The overlay of pure CAW with the CAW-shampoo mixtures (Fig.7) highlights two key wavelength areas (1620–1800 nm and 2185–2400 nm) that were used to develop a vigorous prediction model.
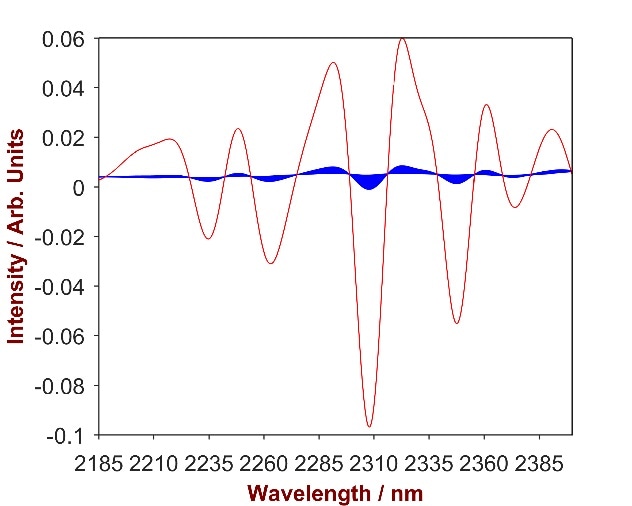
Figure 7. 2nd derivative spectra of 14 CAW-shampoo mixtures with CAW concentration differing from 0.2-2.0% (blue). The overlay with pure CAW (red) identifies the significant wavelength region of 2185-2400 nm.
A 2-factor-model with a Standard Error of Calibration (SEC) of 0.07% and a Standard Error of Cross Validation (SECV) of 0.12% was established in order to calculate the concentration of SLES in shampoo.
As shown in Fig. 8, a strong correlation was attained between the provided reference values and the calculated values (R2 = 0.9914). Parameters employed for method development and the figures of merit are itemized Tab. 6.
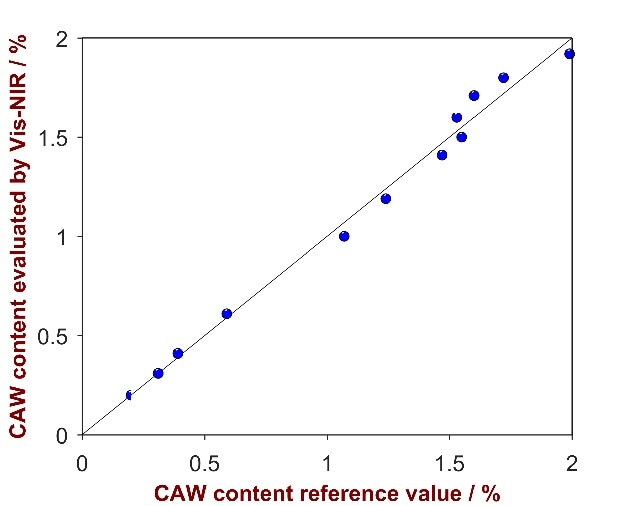
Figure 8. Correlation plot of the predicted CAW content by Vis-NIRS versus the reference values.
Table 6. Results of the quantitative method development for CAW content.
| . |
. |
| Regression model |
PLS with 2 factor |
| Pre-treatment |
2nd derivative |
| Wavelength range |
1620 – 1800 nm
2185 – 2400 nm |
| R2 |
0.9914 |
| SEC |
0.07% |
| SECV |
0.12% |
Carbopol
The overlay of pure Carbopol with the Carbopol-shampoo mixtures (Fig.9) highlights a key wavelength area (1650 – 1740 nm) that was used to develop a strong prediction model. A 1-factor-model with a Standard Error of Calibration (SEC) of 0.04% and a Standard Error of Cross Validation (SECV) of 0.04% was developed in order to calculate the concentration of Carbopol in shampoo.
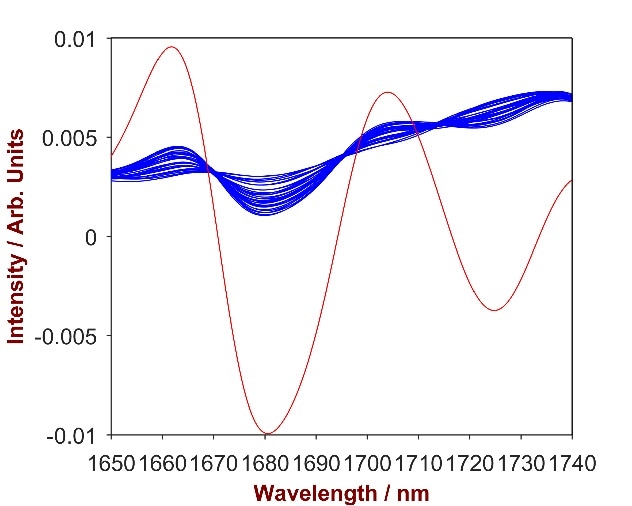
Figure 9. 2nd derivative spectra of 16 Carbopol-shampoo mixtures with Carbopol concentration differing from 0.2-2.5% (blue). The overlay with pure Carbopol (red) identifies the significant wavelength region of 1650 – 1740 nm.
As shown in Fig. 10, a high correlation was attained between the provided reference values and the calculated values (R2 = 0.9914). Parameters employed for method development and the figures of merit are itemized in Tab. 7.
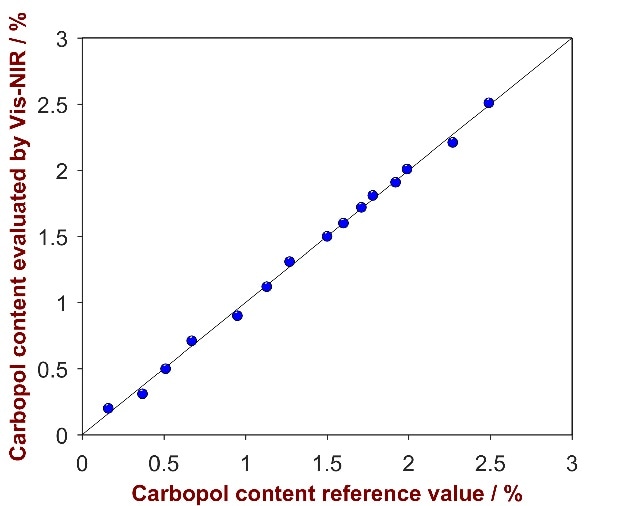
Figure 10. Correlation plot of the predicted Carbopol content by Vis-NIRS versus the reference values.
Table 7. Results of the quantitative method development for Carbopol content.
| . |
. |
| Regression model |
PLS with 1 factor |
| Pre-treatment |
2nd derivative |
| Wavelength range |
1650 – 1740 nm |
| R2 |
0.9977 |
| SEC |
0.04% |
| SECV |
0.04% |
DEA
A 1-factor model with a Standard Error of Calibration (SEC) of 0.04% and a Standard Error of Cross Validation (SECV) of 0.04% was developed in order to calculate the concentration of DEA in shampoo.
As shown in Fig. 12, a high correlation was attained between the provided reference values and the calculated values (R2 = 0.9914). Parameters employed for method development and the figures of merit are itemized in Tab. 8.
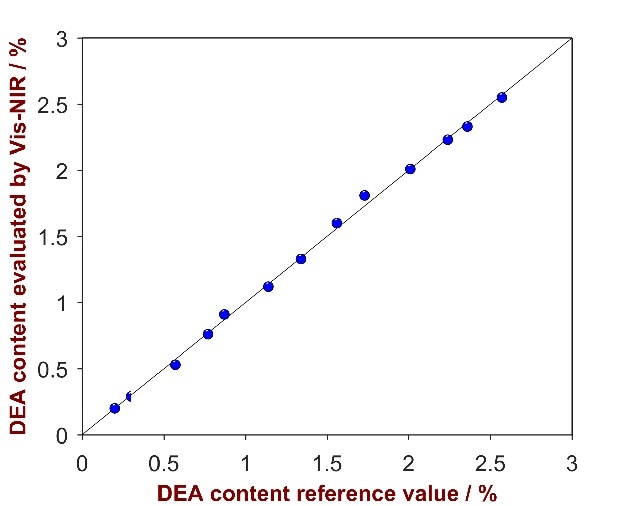
Figure 12. Correlation plot of the predicted DEA content by Vis-NIRS versus the reference values.
Table 8. Results of the quantitative method development for DEA content.
| . |
. |
| Regression model |
PLS with 1 factor |
| Pre-treatment |
2nd derivative |
| Wavelength range |
1700 – 1800 nm |
| R2 |
0.9981 |
| SEC |
0.04% |
| SECV |
0.04% |
Polyquaternium-7
The overlay of pure Polyquaternium-7 with the Polyquaternium-7-shampoo mixtures (Fig.13) highlights a key wavelength area (2215-2250 nm) that was used to develop a strong prediction model. A 2-factor-model with a Standard Error of Calibration (SEC) of 0.06% and a Standard Error of Cross Validation (SECV) of 0.07% was developed in order to calculate the concentration of SLES in shampoo.
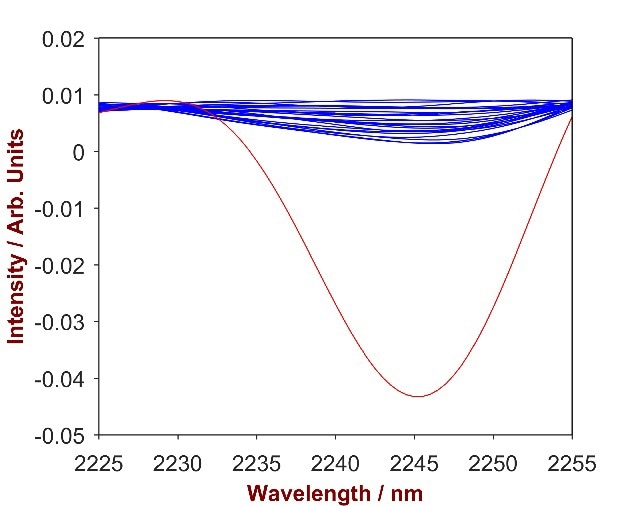
Figure 13. 2nd derivative spectra of 12 Polyquaternium-7-shampoo mixtures with Polyquaternium-7concentration differing from 0.2-1.9% (blue). The overlay with pure Polyquaternium-7 (red) identifies the significant wavelength region of 2225-2250 nm.
As shown in Fig. 14, a high correlation was attained between the provided reference values and the calculated values (R2 = 0.9914). Parameters employed for method development and the figures of merit are itemized in Tab. 9.
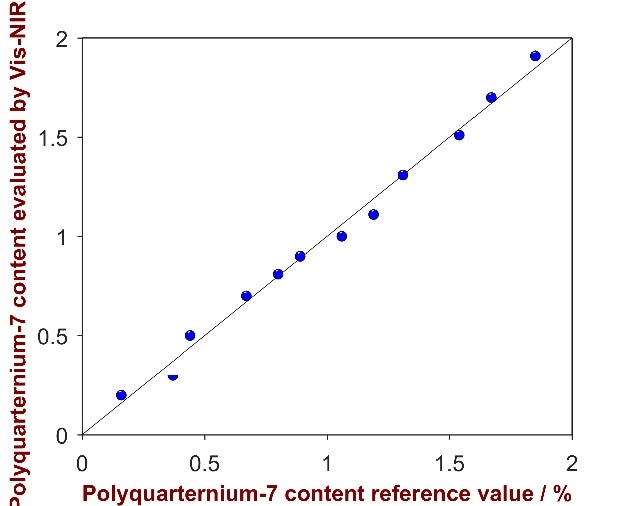
Figure 14. Correlation plot of the predicted Polyquaternium-7 content by Vis-NIRS versus the reference values.
Table 9. Results of the quantitative method development for Polyquaternium-7 content.
| . |
. |
| Regression model |
PLS with 2 factor |
| Pre-treatment |
2nd derivative |
| Wavelength range |
2225 – 2255 nm |
| R2 |
0.9915 |
| SEC |
0.06% |
| SECV |
0.07% |
Summary
In this article, it is demonstrated that with Vis-NOR spectroscopy, it is possible to efficiently determine the concentrations of SLES, CAPB, CAW, Carbopol, DEA and Polyquaternium-7 in a shampoo matrix.
Calculated standard errors for all tests are comparable with the standard errors of the reference model, confirming Vis-NIR spectroscopy’s position as an effective quality control technique in shampoo manufacture, offering a speedier and more dependable process.
This analysis was carried out using a DS2500 instrument in transflection mode, with a gold transflection kit.
One downside of this otherwise highly appropriate method is that it is necessary to clean the sample window following each measurement. Where users wish to avoid this step, it is also possible to measure samples in disposable glass vials in transmission mode, with the use of a Metrohm XDS Rapidliquid Analyzer.
Each instrument has provided reliable and comparable results, thus the precise choice of which to employ becomes a matter of user preference.
About Metrohm
At Metrohm is one of the world’s most trusted manufacturers of high-precision instruments for chemical analysis. Metrohm was founded in 1943 by engineer Bertold Suhner in Herisau, Switzerland. Today, Metrohm is represented in 120 countries by subsidiaries and exclusive distributors. The global Metrohm Group also includes the Dutch companies Metrohm Applikon and Metrohm Autolab, manufacturers of online analyzers and instruments for electrochemical research, respectively. Recently, the Metrohm Group was joined by Metrohm Raman, a leading manufacturer of handheld Raman spectrometers.
Metrohm is the global market leader in analytical instruments for titration. Instruments for ion chromatography, voltammetry, conductivity, and stability measurement make the Metrohm portfolio for ion analysis complete. Instruments for Near-infrared and Raman spectroscopy are another, strongly growing segment of the Metrohm portfolio.
Metrohm is a problem solver, both in the laboratory and within the industrial process. To this end, the company offers their customers complete solutions, including dedicated analytical instrumentation as well as comprehensive application know-how. More than 30% of the company’s employees at the Metrohm international headquarters in Herisau work in R&D.
Metrohm has been owned 100% by the non-profit Metrohm Foundation since 1982. The Metrohm Foundation, which does not exert any influence on the company’s business operations, sponsors gifted students in the natural sciences, supports charitable and philanthropic purposes and, above all, ensures the independence of the company.
Sponsored Content Policy: News-Medical.net publishes articles and related content that may be derived from sources where we have existing commercial relationships, provided such content adds value to the core editorial ethos of News-Medical.Net which is to educate and inform site visitors interested in medical research, science, medical devices and treatments.