Raman spectroscopy provides a distinct spectral profile, which makes it a powerful tool. The characteristic peak positions and intensities obtained for each compound are compared with spectral libraries for identifying the particular compound. Since the introduction of handheld and portable Raman systems, this relatively unknown analytical technique has been increasingly used in mainstream applications.
Drawbacks of Existing Technologies
The spectral intensity varies in proportion to the sample concentration, and it is possible to build multiplex models for determining the sample concentration. However, closely related sampling designs are used in most of the commercially available handheld and portable systems, posing difficulty in sample identification and measurement in most field applications. Compact size, low power requirements, and the resolution required for identification of a large number of compounds are some of the advantages of this fundamental design.
Very small fixed volume that is adequate for pure material analysis can be examined with this basic design. A large sample analysis area and high spectral resolution are required capabilities for a majority of the handheld and portable applications due to the heterogeneity of most samples and compounds. Moreover, samples experience localized heat buildup caused by the increased laser power density due to the tight laser focus, and eventually get damaged. This can be noticed in delicate surface-enhanced Raman scattering (SERS) substrates or dark materials.
The Orbital-Raster-Scan Technique
These drawbacks have been overcome in Metrohm’s handheld Raman system “Mira” by equipping it with the optical focus technique called the Orbital-Raster-Scan (ORS) sampling (Figure 1). This article discusses the advantage of applying the ORS technique for determination and measurement of drug formulations.
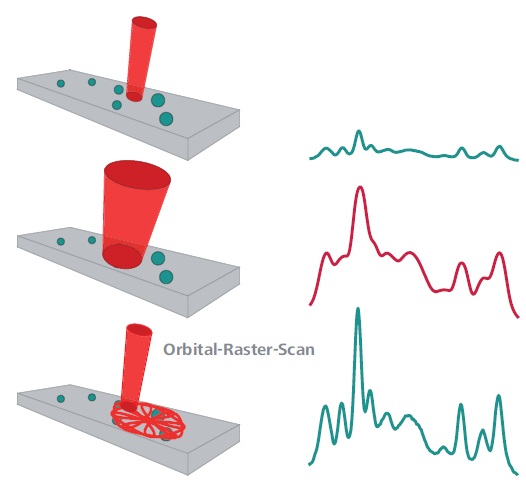
Figure 1. Dispersive spectrometers use a tightly focused beam (top). This results in a high spectral resolution, but components in heterogeneous samples can be missed completely. Simple broadening of the beam would result in a loss of spectral resolution (center). The ORS technique (bottom) scans a larger sample area and is therefore more likely to capture dispersed sample components. Meanwhile, it maintains the high spectral resolution that is required for analyte identification.
A large aperture is required for designing traditional spectrometer with large analysis areas or large laser spot and high optical throughput. This contradicts the requirement of high spectral resolution necessary for spectral matching. This is the so-called etendue. This key spectral concept controls the resolution, sensitivity or light collection, and interrogation area of a spectrometer. Figure 1 also illustrates the ORS benefit of identifying a disperse analyte on a solid substrate.
High spectral resolution can be produced by a tightly focused beam in a dispersive spectrometer, but there is also possibility for completely missing the analyte. A larger aperture is necessary for a large beam in a dispersive spectrometer for collection of all of the scattered light, thus resulting in a loss of spectral resolution. The unique ORS sampling system allows observation of a multitude of dispersed analytes and at the same time, maintenance of high spectral resolution for identification of analytes.
Heterogeneous, complex, or dark colored homogeneous samples can be effectively identified when the analysis area is large. One example is the analysis of drugs, which are heterogeneous mixtures consisting of controlled proportions of active pharmaceutical ingredients (APIs) and excipients. For instance, APIs present in effervescent cold medicines include chlorpheniramine maleate as an antihistamine, aspirin for pain relief, and phenylephrine bitartrate as a decongestant. The tablet formulation allows the APIs to be distributed homogenously, with the size of roughly 25μm for an API particle.
The API distribution can be rapidly and effectively determined using Raman spectroscopy. However, analyzing a drug formulation is laborious and time intensive because most Raman systems have small spot size and APIs have small particle size. Sample movement and an automated XYZ stage can help obtain large area data, providing an effective Raman analysis of drug formulation but at a higher cost. A Raman instrument equipped with the ORS sampling technology provides the fastest, most convenient, and lowest means of large area analysis for drug formulation.
Advantages of the ORS Technique
Reproducibility
The improved reproducibility of Raman signals from the APIs of interest in an effervescent cold medicine is demonstrated here by using the Mira DS equipped with the ORS technique (Figure 2), which analyzed the sample tablets without any preparations after placing them on the laboratory bench top. The Mira DS handheld system analyzed 15 random locations without ORS, using 75mW laser power and 1 second integration time. The large variation of peak intensities is illustrated by plotting the resulting spectra in a 3D plot (Figure 3).
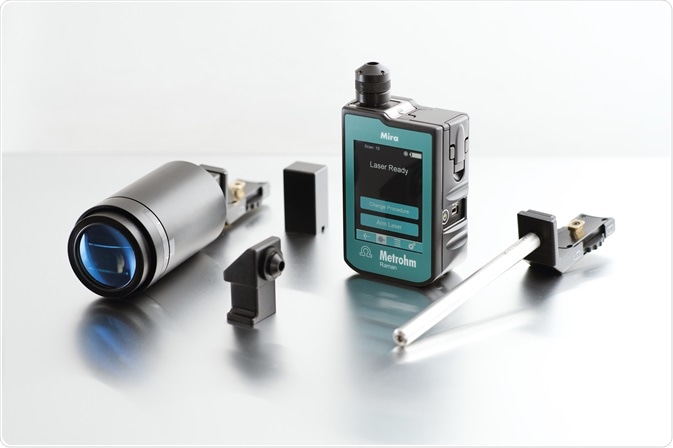
Figure 2. Mira DS handheld Raman spectrometer
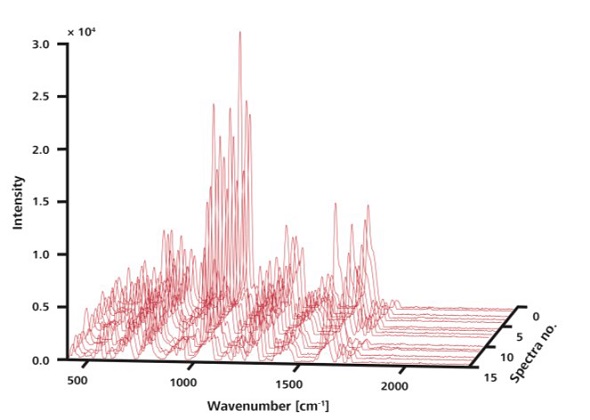
Figure 3. The 15 Raman spectra shown here were recorded at random locations on a single sample without ORS. Although peaks are observed at the same positions, intensities vary.
Further analysis of the samples was performed by the Mira DS system equipped with the ORS method of spatial averaging, acquiring 15 spectra using the same parameters. Plotting the resulting data in a 3D plot demonstrates the improved reproducibility of the Raman spectra owing to scanning over large areas (Figure 4).
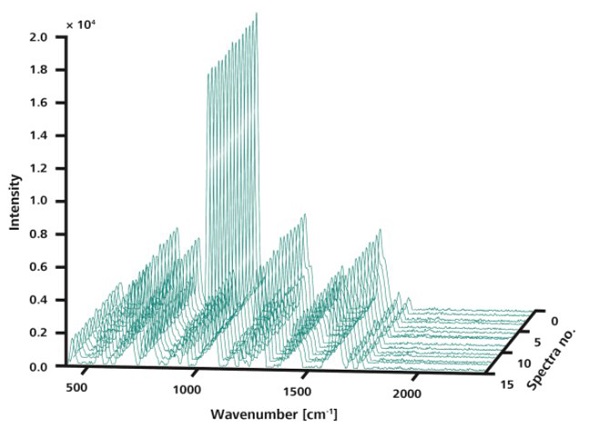
Figure 4. Like in Figure 3, the 15 spectra shown here were measured at random locations on a single sample. However, in this measurement, ORS was used sampling an area of 3mm diameter. The spectra are visibly congruent.
Quantitative Analysis
This experiment used three samples of the effervescent cold medicine with known aspirin levels, namely Severe Cold and Flu (0mg), Original (325mg), and Extra Strength (500mg). The Mira DS handheld system was used to acquire five spectra for each sample with raster off, using 75mW laser power and 1 second integration time.
Grams AI was used for data compilation, and the resulting data was subjected to a partial least squares regression (PLS) analysis with no other data treatment, yielding an ORS OFF cross validation plot with R2 of 0.9263. Then, the Mira DS was used to perform the same experiment using the same parameters but with raster on. Grams AI was employed for data compilation, and the resulting data was subjected to a PLS regression analysis with no other data processing, yielding an ORS ON cross validation plot with R2 of 1.0. Figure 5 depicts these results.
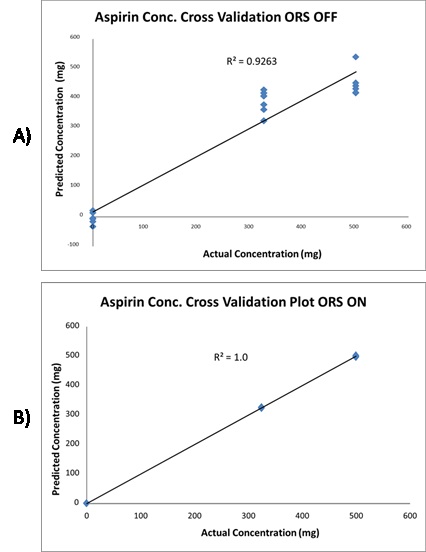
Figure 5. Cross validation plot of aspirin conc. with the ORS off. B) The same cross validation plot of aspirin conc. with ORS on. ORS increases the reproducibility of the data resulting in more precise quantification.
Confident Matching
Analysis time advantages of ORS when comparing spectra to known drug formulations against library spectra are demonstrated by averaging 15 spectra acquired without ORS. This average value was then compared against a single spectrum obtained with ORS (Figure 6), both showing excellent agreement with a hit quality index (HQI) of 0.99.
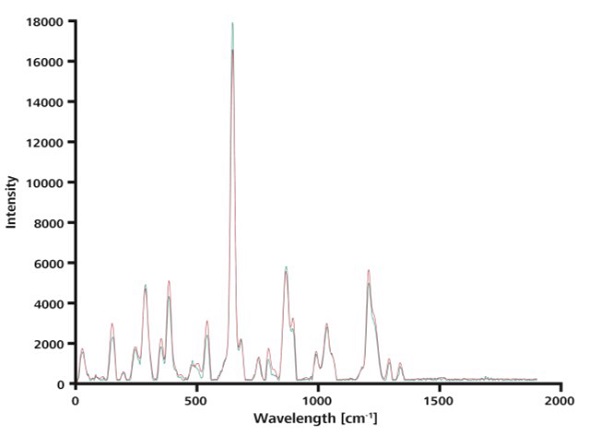
Figure 6. This overlay of a single spectrum taken with ORS (blue) and the average over 15 spectra measured without ORS (red) shows that the curves match nearly perfectly.
The results of the comparison of the four samples captured with and without ORS against the known averaged spectrum are summarized in Table 1.
Table 1. Matching correlation scores
|
Matching correlation scores
|
|
Sample
|
Matching ORS ON
|
Matching ORS OFF
|
|
Sample 1
|
0.993298
|
0.987448
|
|
Sample 2
|
0.993080
|
0.987290
|
|
Sample 3
|
0.992688
|
0.95454
|
Conclusion
The results have shown the advantage of employing the ORS method to match and quantify drug formulations. Only a limited sample volume can be integrated when the raster is off, leading to a set of diverse spectra. Conversely, the movement of the laser beam when the raster is on allows collect data points as an average over a larger area of the formulation.
Since each API has its own spectra, heterogeneous distribution of material identifications is produced. Due to these differences, multiple spectra need to be captured to get an average of cold medicine formulations, eventually increasing the analysis time. The experiment discussed in this article illustrated the incapability of other Raman systems to perform adequate material characterization for chemical, industrial and pharmaceutical markets. However, reproducible and reliable results can be obtained rapidly using the Mira DS equipped with the ORS technique, enabling considerable savings in terms of money and time.
For each of the four sampled areas, the HQI for the ORS ON was constant at 0.99, whereas for the ORS OFF, it varies between 0.94 and 0.98, illustrating the robustness of the ORS technique for comparison of a known drug formulation. The integration of more robust analysis tools such as PCA enables the ability to satisfy the regulatory prerequisites of most pharmaceutical applications. The comparison of the time taken for collection of 15 scans without ORS and that of a single scan with ORS showed a 95% saving in analysis time, thus clearly demonstrating the advantage of using the ORS method over multiple scans.
About Metrohm
At Metrohm is one of the world’s most trusted manufacturers of high-precision instruments for chemical analysis. Metrohm was founded in 1943 by engineer Bertold Suhner in Herisau, Switzerland. Today, Metrohm is represented in 120 countries by subsidiaries and exclusive distributors. The global Metrohm Group also includes the Dutch companies Metrohm Applikon and Metrohm Autolab, manufacturers of online analyzers and instruments for electrochemical research, respectively. Recently, the Metrohm Group was joined by Metrohm Raman, a leading manufacturer of handheld Raman spectrometers.
Metrohm is the global market leader in analytical instruments for titration. Instruments for ion chromatography, voltammetry, conductivity, and stability measurement make the Metrohm portfolio for ion analysis complete. Instruments for Near-infrared and Raman spectroscopy are another, strongly growing segment of the Metrohm portfolio.
Metrohm is a problem solver, both in the laboratory and within the industrial process. To this end, the company offers their customers complete solutions, including dedicated analytical instrumentation as well as comprehensive application know-how. More than 30% of the company’s employees at the Metrohm international headquarters in Herisau work in R&D.
Metrohm has been owned 100% by the non-profit Metrohm Foundation since 1982. The Metrohm Foundation, which does not exert any influence on the company’s business operations, sponsors gifted students in the natural sciences, supports charitable and philanthropic purposes and, above all, ensures the independence of the company.
Sponsored Content Policy: News-Medical.net publishes articles and related content that may be derived from sources where we have existing commercial relationships, provided such content adds value to the core editorial ethos of News-Medical.Net which is to educate and inform site visitors interested in medical research, science, medical devices and treatments.