Summary
Several quality attributes (QAs) must be monitored to ensure an effective and safe final product when developing adeno-associated virus (AAV) vectors as drug products. Thermal stability, aggregate content and total AAV particle concentration are three of these QAs.
The DynaPro® Plate Reader and the DynaPro® NanoStar® facilitate the simple and efficient quantification of these QAs in batch mode with a combination of static light scattering (SLS) and dynamic light scattering (DLS).
Introduction
Belonging to the Parvoviridae family, the adeno-associated virus (AAV) is a class of virus that consists of a non-enveloped protein capsid with a diameter of approximately 25 nm, filled with single stranded DNA.
AAV has become one of the most well-characterized and popular gene-delivery vectors for clinical applications with a history of more than fifty years of research.1,2
Multiple quality attributes should be measured during the manufacturing procedure, including final drug products and in-process. The most popular QAs relate to purity and potency of the AAV product and stability.3
A range of analytical techniques are employed to observe the QAs of AAV vectors, such as real-time PCR and analytical ultracentrifugation (AUC). These methods can be expensive, destructive to the sample and labor-intensive, making them inappropriate for high-throughput, early-stage screening.
Utilizing SEC-MALS with a DAWN® multi-angle light scattering detector to measure AAV QAs such as empty:full ratio, concentration, aggregation and size is outlined in the application note AN1617: AAV critical quality attribute analysis by SEC-MALS.
SEC-MALS is simpler than other techniques and is non-destructive. It delivers complex characterization but requires around 30 minutes per sample to complete and may not be suitable for the screening of formulations and processes.
Conversely, batch light-scattering methods deliver an easy, high-throughput and fast measurement of AAV solutions. In this study, batch dynamic and static light scattering (DLS and SLS) were employed to measure three AAV quality attributes (QAs):
- Thermal Stability
- Total viral particle concentration
- Aggregate content
This article reviews all three measurements performed using the DynaPro® Plate Reader and DynaPro® NanoStar® DLS/SLS instruments.
Materials and methods
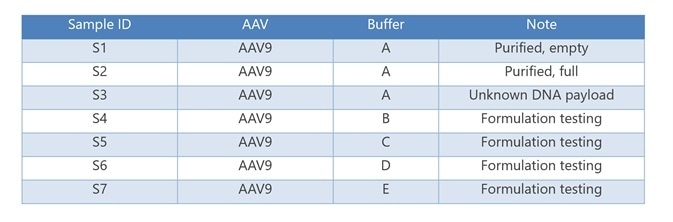
Virovek, Inc. (https://www.virovek.com/), specialists in the large-scale production of AAVs (Table 1), kindly provided the AAV9 samples. Respectively, samples S1 and S2 represented purified ‘empty’ (with no DNA payload) and ‘full’ (including single stranded, full-length DNA) AAV samples.
Samples S3 to S6 signify investigations of different buffer conditions on the aggregate content and stability of the AAVs.
Batch SLS and DLS measurements were carried out using the DynaPro Plate Reader and DynaPro NanoStar as outlined below. DYNAMICS® software was used to perform data analysis and acquisition.
Table 1. AAV sample description. Source: Wyatt Technology
DynaPro NanoStar
The DynaPro NanoStar was used to perform low-volume SLS and DLS measurements to evaluate the size and size distribution of aggregation. 1.25 µL of diluted and neat AAV solutions were dispensed into the quartz cuvette for samples S1 and S2.
Five 5-second acquisitions were used to perform each measurement. SLS and DLS data were acquired to establish the hydrodynamic radius (Rh), molar mass, viral particle concentration and aggregate content.
DynaPro Plate Reader
The DynaPro Plate Reader was used to perform high-throughput measurements. A 384-well microtiter plate (Aurora) was used to perform all measurements and every well was filled with 30 µL solution. Prior to loading into the plate reader, the plate was centrifuged at 400 g for 1 minute.
The AAV samples S1 and S2 were diluted 1:10 in buffer. Along with this, three combinations of S1 and S2 were produced with ratios of full:empty AAV relating to 1:1, 1:10 and 1:50 (v/v).
Each AAV solution was dispensed into the microtiter plate in triplicate and 1-2 drops of silicone oil were used to cap each well to stop evaporation. SLS and DLS data were acquired to calculate Rh, viral particle concentration and viral aggregate content at 25 °C.
The temperature was consistently ramped from 25 °C to 85 °C at a rate of 0.1 °C/min for thermal stability measurements and Rh was calculated during the temperature ramp.
AAV samples S3 to S6 were dispensed into single wells with no dilution. Tape (Nunc) was used to seal the wells to stop evaporation. For two hours, the plate was incubated at 37 °C and the Rh distribution was calculated across time to establish the impact of the formulation buffer.
Results and discussion
Size and size distribution
Calculating the size distribution and size with batch DLS offers a fast technique for evaluating the gross aggregation amount in AAV solutions. DLS offered distinct differences in aggregate content and particle size among the six AAV samples investigated.
Autocorrelation functions (ACF) were exhibited by the purified AAVs (S1 and S2) with fast, smooth decays, typical of monodisperse samples of the anticipated size (Figure 1, left).
Conversely, the autocorrelation functions for additional AAVs (S3 to S6) decay at a slower rate, suggesting the presence of larger aggregates in the solution. A regularization algorithm was used to fit the ACFs, which created the size distribution plots on the right of Figure 1.

Figure 1. Autocorrelation functions (left) and size distribution via regularization (right) of AAVs for formulation screening. S1 and S2, S3 from DynaPro NanoStar, S4 through S7 from DynaPro Plate Reader. Image Credit: Wyatt Technology
Samples S1 and S2, which are purified AAVs, were observed to be uniform solutions with Rh = 14.7 ± 0.7 nm and 15.6 ± 0.1 nm, respectively. As calculated by SLS from NanoStar, the weight-average molar mass (Mw) are 3.67 ± 0.01 MDa for S1 and 6.78 ± 0.03 MDa for S2.
The molar mass increase is in line with the inclusion of the DNA into the viral capsid and corresponds well with the molar mass calculations by SEC-MALS.4
High aggregation is noted in samples S3 to S6 (Figure 1) and the dominant species has an average Rh of 30 nm. A secondary peak with a radius of approximately 550 nm is seen in the size distribution, despite the existence of aggregate. This likely relates to AAV monomer or a combination of dimer, small oligomers and monomers.
The different buffer conditions were thought to promote or mitigate various aggregate content. In this experiment, those variations were not observed at 25 °C. They could only be observed after incubation at 37 °C (detailed in the Thermal Stability section).
Thermal stability
In this experiment, two measures of thermal stability were carried out. The hydrodynamic radii of samples S1, S2 and their mixtures were quantified during a consistent temperature ramp to measure aggregation temperature.
S3 to S6 were incubated at a consistent temperature of 37 °C to monitor variations in size distribution and size as a result of the higher temperature.
The same aggregation temperature was observed in both empty and full AAVs, indicating that the DNA payload does not alter the thermal stability. Rh as a function of temperature is shown in Figure 2 for empty AAV (S1), full AAV (S2) and three separate mixtures.
For all the samples, the size remains consistent until the temperature is changed to greater than 60 °C. A significant increase in Rh was then noted, rising from 14 nm to 300 nm, suggesting the creation of aggregates.
Onset analysis in DYNAMICS was employed to calculate the radius and onset temperature for each sample. The onset temperature was relatively consistent at 62.5 ± 0.5 °C and its related onset Rh was 18.3 ± 1.1 nm.

Figure 2. Aggregation screening of AAVs upon thermal ramping. Image Credit: Wyatt Technology
The reaction of aggregated AAV samples (S3 to S6) to thermal settings was evaluated across time at a set incubation temperature of 37 °C. As demonstrated in Figure 3, a decrease in Rh is exhibited by all four AAV solutions as a function of incubation time.

Image Credit: Wyatt Technology
The mean size of all four samples at t = 0 varied from 450 nm to 530 nm, with S3 being the smallest and S4 being the biggest. Depending on the additives in the formulation buffer, the rate of aggregate dissolution differed for each sample.

Figure 3. Hydrodynamic radius as a function of time of AAVs upon thermal incubation at 37 °C (left). An example of distribution difference between incubation at t = 0 and 2 hours (right). Image Credit: Wyatt Technology
S5 experienced the largest decrease in Rh, which was produced with the highest concentration of a specific buffer ingredient. It was theorized that this ingredient may prevent the aggregation of AAVs and could also help aggregates to be recovered as separate particles.
Particle concentration
Batch DLS and SLS measurements with the NanoStar and Plate Reader deliver fast measurement of the particle concentration. Knowledge of the shape of the particle shape, which in this case was a sphere, is required to determine particle concentration. Along with this, the refractive index (RI) of the buffer and particles should be identified.
A library of RI values for popular materials is included in DYNAMICS and customers can choose customized RI values for complicated materials, such as AAV.
With these inputs, the static light scattering intensity and the Rh calculated by DLS are used in combination to identify the particle concentration. For standard AAV samples, the concentration that can be measured by this method varies from ~6x10¹⁰ mL-1 to ~1015 mL-1.
For samples S1 and S2, the total AAV concentration was measured. RI values of 1.43 and 1.48 were ascribed to S1 and S2 AAV, respectively, for the analysis.
Figure 4 presents the particle concentrations for S1 and S2 AAVs analyzed through batch SLS/DLS and determined by DYNAMICS, in comparison to the high-resolution measurements performed by SEC-MALS.
High-throughput measurements taken in microtiter plates correspond well with the SLS measurements performed in the NanoStar quartz cuvette, proving a similar quality of data.
Average particle concentrations of (8.2 ± 0.6) × 1013 mL-1 for S1 and (2.7 ± 0.1) × 1013 mL-1 for S2, respectively are reported by DYNAMICS. These samples had previously been measured by SEC-MALS to calculate the dimer and aggregate content, concentration of each species and the molar mass.4
Comparable values are provided by batch measurements with the NanoStar and DynaPro Plate Reader, within 22% of the SEC-MALS high-accuracy measurement.
This superior level of agreement shows that batch measurements can be employed as high throughput, efficient screening for particle concentration with no requirement for lengthy, labor intensive experiments.
In batch concentration measurements, two key challenges are encountered. Firstly, while SEC-MALS delivers the separation of the aggregates and monomer and separately measures these particles, in batch mode, the average measured Rh includes contributions from all the components in the solution.
The average Rh by DLS is normally greater than the monomer radius calculated by SEC-MALS, producing an underestimation of the particle concentration in batch. Secondly, the calculated concentration is significantly affected by the choice of refractive index.
In these studies, RI values of 1.48 and 1.43 were empirically calculated for full and empty AAV, respectively and correspond with more lengthy measurements by SECMALS where a model of a coated sphere and protein conjugate analysis are used.4
An average RI of 1.46 can be selected when the DNA loading is unknown, in agreement with the literature.5 However, a 1.5× difference in measured concentration can be produced by this ~2% difference in refractive index.
This discrepancy is normally minor for screening purposes and additional analysis with high-resolution methods such as SEC-MALS can be utilized to correct the value.
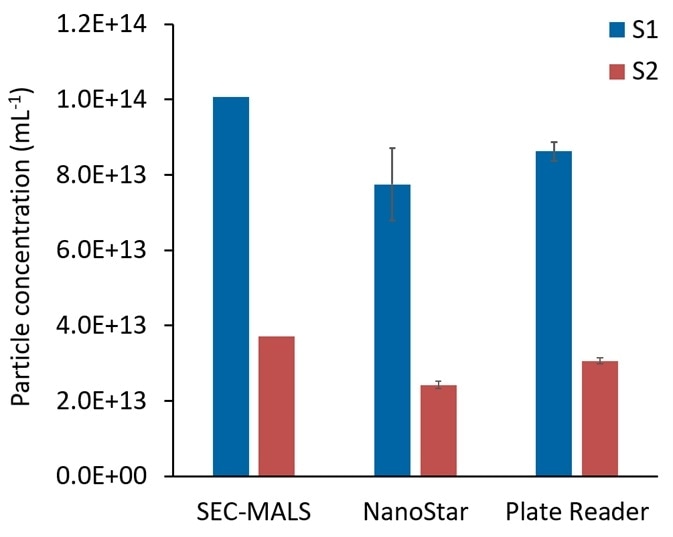
Figure 4. Comparison of viral particle concentration determined in DYNAMICS with those determined by number density in ASTRA. S2, 3.06E+13 (avg); 6.46692E+12 (stdev); 21% (%stdev). S1, 8.81E+13 (avg); 1.16613E+13 (stdev); 13% (%stdev). Image Credit: Wyatt Technology
Conclusions
Batch dynamic and static light scattering measurements deliver efficient, low volume screening techniques for the measurement of AAV quality attributes. Both the DynaPro Plate Reader and the DynaPro NanoStar provide the characterization of size distribution and particle size, total particle concentration and thermal and colloidal stability.
These techniques require no method development and are non-destructive, which makes them suitable for integration in several areas of AAV drug development.

Image Credit: Wyatt Technology
References and further reading
- Hastie, E. & Samulski, R. J. Adeno-Associated Virus at 50: A Golden Anniversary of Discovery, Research and Gene Therapy Success—A Personal Perspective. Hum. Gene Ther. 26, 257–265 (2015).
- Naso, M. F., Tomkowicz, B., Perry, W. L. & Strohl, W. R. Adeno-Associated Virus (AAV) as a Vector for Gene Therapy. BioDrugs 31, 317–334 (2017).
- Wright, J. F. Manufacturing and characterizing AAV-based vectors for use in clinical studies. Gene Ther. 15, 840–848 (2008).
- Chen, M. & Purchel, A. Quantifying quality attributes of AAV gene therapy vectors by SEC-UV-MALS-dRI. (2019). Available at: https://www.wyatt.com/
- Steppert, P. et al. Quantification and characterization of virus-like particles by size-exclusion chromatography and nanoparticle tracking analysis. J. Chromatogr. A 1487, 89–99 (2017).
Acknowledgments
Produced from materials originally authored by Xujun Zhang, Wade Wang and Sophia Kenrick from Wyatt Technology. Wyatt Technology thank Virovek Inc. for kindly supplying the AAV samples used in this study.
About Wyatt

With a long history of excellence in scientific instrumentation,Wyatt Technology is the recognized leader in innovative light scattering instruments, accessories, software and services for determining the properties of macromolecules and nanoparticles in solution. Wyatt provides cutting-edge solutions for in-line multi-angle static light scattering (SEC-MALS), field-flow fractionation (FFF-MALS), composition gradients (CG-MALS), high-throughput and traditional dynamic light scattering (DLS), electrophoretic mobility via phase-analysis light scattering (MP-PALS), differential refractometry and differential viscosity. With a staff composed of 20% Ph.D. scientists and many more dedicated and experienced support personnel, Wyatt's aim is to delight the customer with the best products, training, customer support and service available in the industry.
Sponsored Content Policy: News-Medical.net publishes articles and related content that may be derived from sources where we have existing commercial relationships, provided such content adds value to the core editorial ethos of News-Medical.Net which is to educate and inform site visitors interested in medical research, science, medical devices and treatments.