Summary
Stability is one of the main quality characteristics in formulation studies of prospective therapeutic biomolecules. Researchers depend on high-throughput screening techniques to reduce the funds, effort and time involved in stability studies, which can accurately validate hundreds of combinations of excipients, candidates and buffer conditions.
The methods used in these tests must calculate a range of stability-indicating parameters (SIPs). Colloidal stability, thermal stability and short-term aggregation are some of the most practical SIPs to date.
Scientists are able to focus on the most appropriate candidates by screening protein formulations in the early development stages, which saves significant amounts of sample, testing equipment and time.
This experiment shows that colloidal and thermal stability of proteins, two indicators of aggregation propensity, along with actual aggregation states, can all be calculated at the same time during the screening stage with dynamic light scattering (DLS) tools to determine the effectiveness of formulation conditions and candidates.
DLS can additionally determine the average molar mass, chemical stability and the precise volume of molecules in solution. Due to this, HTS-DLS delivers significant amounts of data for the efficient screening of buffer conditions, excipients and candidate molecules, enabling the DynaPro® Plate Reader to optimize productivity in formulation research.

The DynaPro Plate Reader enables reliable testing of thousands of combinations of candidate biotherapeutics, excipients and buffer conditions in formulation studies. Image Credit: Wyatt Technology

The diffusion interaction parameter kD, measured by dynamic light scattering, identifies the onset of protein unfolding and its impact on colloidal stability, before indications apparent in the hydrodynamic radius. Image Credit: Wyatt Technology
Introduction
In therapeutic biomolecules, stability is a main quality attribute that is essential for determining drug-like characteristics and suitability for human use. Calculating the stability of a formulation or candidate molecule can be a tedious and lengthy procedure.
To reduce the effort, time and costs involved in long-term stability studies, biologics developers value high-throughput screening techniques that can accurately rank and test hundreds of combinations of buffer conditions, candidates and excipients.
A range of stability-indicating parameters (SIPs) must be determined by the experimental methods used in these screens as no specific parameter has yet been shown to be the silver bullet that indicates stability under various environmental stresses such as elevated temperatures or freeze-thaw or indicates a long-term shelf life.
Short term aggregation, thermal stability and colloidal stability are some of the most practical SIPs to date. Short term aggregation is the formation of aggregates that are normally small. Thermal stability is the protein’s tendency to aggregate and/or unfold with temperature, normally as a result of hydrophobic core exposure.
Colloidal stability is the tendency of molecules to associate in response to attractive, weak forces that are caused by hydrophobic surface residues, surface changes and similar moieties.
These SIPs do not function independently from one another. As an example, while colloidal stability usually concerns reversible association, the greater proximity in self-attractive conditions can heighten rates of irreversible aggregation.
In contrast, higher surface charge may decrease colloidal attraction and enhance colloidal stability while reducing thermal stability as the tertiary structure of the protein is destabilized by the charges.
A range of methods, for example, intrinsic and extrinsic fluorescence, differential scanning calorimetry, infrared or Raman spectroscopy, circular dichroism and static light scattering, have been used to evaluate SIPs.
Dynamic light scattering (DLS) is one method that particularly stands out for its strong versatility. DLS delivers quantitative information on a wide range of stability-related processes.
The technique can simultaneously measure the distribution and aggregation of aggregate sizes, thermal stability where it differentiates between aggregation and pure unfolding through a transition in temperature and colloidal stability through the concentration dependence of diffusion. The same equipment can also simultaneously calculate specific volume and average molar mass using static light scattering (SLS).
A biomolecule’s stability is not an entirely intrinsic attribute but relies on the concentration at which the protein is formulated and the buffer composition. For an effective and optimal formulation, protein stability must be measured as a function of specific ion type, excipient profile, ionic strength and pH.
Luckily, SLS and DLS are ideal for low-volume, high-throughput screening of hundreds of conditions each hour via a plate reader that features industry-standard microwell plates.
The DynaPro Plate Reader is used to achieve high-throughput screening by dynamic and static light scattering (HTS-DLS/SLS), which can house 96, 384 or 1536-well plates, scanning the temperature of all samples in parallel from 4 °C to 85 °C.
The multiplexed technique offered by HTS-DLS/SLS can be applied to a range of alternative formulation conditions for the efficient analysis of protein behavior.
Qualitatively unique data is provided through the simultaneous measurement of colloidal and thermal stability, such as the direct interaction between colloidal and thermal stability mechanisms, evident through the colloidal interaction parameter’s temperature dependence in the vicinity of a thermal transition.
This article shows how HTS-DLS measurements uncover the effect of thermally induced protein unfolding on colloidal interactions, yet another quantitative parameter for the efficient ranking of protein formulations.
The interaction parameter
Variations in scattering intensity caused by Brownian motion are directly measured by DLS. These are studied to establish the translational diffusion coefficient Dt and hence an accurate quantification of molecular size, the hydrodynamic radius Rh.
DLS can additionally deliver a general estimate of size distributions to evaluate populations of aggregates and monomers1.
While not as accurate as a separation method like size exclusion chromatography coupled to light scattering detectors (SEC-MALS), this is generally suitable for the purpose of screening and can even determine the existence of size populations that vary by 3 to 5x in radius.
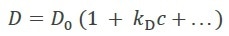
Dt is a function of concentration, c, as a result of non-specific protein-protein interactions mainly arising from hydrophobic and charged residues. Analyzing Dt vs. c results in the first-order diffusion interaction parameter kD (which should not be confused with the equilibrium dissociation constant Kd), as per equation 1:
 |
Equation 1 |
Negative values for kD indicate attraction, while positive values are indicative of repulsive intermolecular interactions.
The diffusion interaction parameter directly corresponds to the second virial coefficient A2, a widely accepted thermodynamic measure of aggregation propensity and colloidal stability2,3.
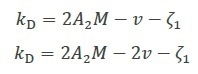
Early theoretical studies outlined the relationship between the specific volume v, kD, A2 and the first-order concentration coefficient of friction ζ1 as Equation 2a, or as Equation 2b with some further refinement4.
 |
Equation 2a
Equation 2b |
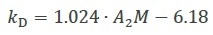
Recently, a complex study of the various hydrodynamic and thermodynamic contributions to kD for monoclonal antibodies enabled the creation of a more accurate relationship that corresponds very well with empirical results5, as shown in Equation 3.
 |
Equation 3 |
Due to this, kD can be used to efficiently contrast various protein formulations and inform the engineering or selection of biomolecules with a higher stability6–11.
Materials and methods
HTS-DLS measurements were executed by a DynaPro Plate Reader for simultaneous colloidal, mixed stability and thermal analyses, which also evaluated the size distribution and degree of aggregation.
The ability to directly measure the sample in the well is a crucial advantage of this instrument. This eliminates concerns of carry-over that are widespread in microfluidic platforms while enhancing throughput.
50 mM bis-tris-propane buffer (BTP) was used to dissolve a monoclonal antibody (mAb1) at pH values of 6.5, 7.5, 8.5 and 9.5 to an end concentration of 15 mg/mL.
This stock solution was filtered to 0.1 µm and was then arrayed and diluted in a 384-well microtiter plate (Aurora) at five replicates of six unique concentrations of protein between 0.47 mg/mL and 15 mg/mL, for each of the four pH values, where 20 µL of solution was loaded into every well.
The plate was centrifuged at 400 x g for 1 minute and to prevent evaporation; each well was then capped with one to two drops of paraffin oil. The plate was centrifuged once more at 400 x g for 1 minute before measurement.
At 25 °C, the first measurements involved control samples of lysozyme and bovine serum albumin in the same plate, not outlined here (while the measurements are included in certain figures).
A broader sequence of measurements was then performed as a function of temperature, ramping from 25 °C to 85 °C at a speed of 0.1 °C per minute. The mAb1 solutions were measured in sequence during the ramp, where five 2-second acquisitions for three replicate wells were completed at every pH and concentration, for every 0.5 °C.
Analysis, instrument control and data acquisition were performed using Microsoft Excel and the DYNAMICS software. Autocorrelation analysis was used to determine Dt and Rh and the linear regression of Dt vs. c calculated kD. Aggregation onset temperature Tonset was calculated for each pH and concentration by fitting the plot of Rh vs. temperature to a suitable model.
Results and discussion
Interaction parameter as a function of pH
MAb1 revealed increasing Rh (decreasing Dt) as a function of concentration (Figure 1), which corresponds to a negative kD and, therefore, protein-protein attraction. For all pH values tested (Figure 2), this antibody displays kD < 0, which highlights an inclination to form into oligomeric species.


Figure 1. Measured hydrodynamic radius as a function of concentration and pH for three proteins. Image Credit: Wyatt Technology
Thermally induced aggregation
mAb1 quickly aggregates into significant complexes at pH 8.5, after the thermal transition at approximately 55 °C, with Rh at 75 °C varying from 80 nm to 800 nm (Figure 3). Tonset declines with concentration, varying from 55.0 to 56.8 °C (Figure 3, inset).
The final state of aggregation heavily depends on the concentration, differing by over two orders of magnitude in average particle size between the highest and lowest concentrations.
At 70 to 75 °C, a second transition arises, which may be connected to the unfolding of an additional IgG domain, which produces largescale aggregation in particles >1 µm. The high amount of aggregation indicates that the concentration dependence noted beyond the thermal transition is mainly caused by higher rates of molecular collision. Changing the temperature ramp rate confirms this observation.

Figure 2. Interaction parameter, kD, as a function of pH for three proteins. Image Credit: Wyatt Technology
Inversely, mAb1 displays a variation from a standard IgG monomer size of Rh = ~4.8 nm to a stable value between 15 and 22 nm at pH 9.5, for temperatures greater than 62 °C (Figure 4) and reliant on concentration.
The high stability and small size of the aggregates at this pH indicate reversible oligomerization. This can be validated by changing the ramp rate and/or by reversing the temperature ramp.
The antibody seems to undergo a second unfolding transition at approximately 75 °C. This is similar to pH 8.5 but with little effect at the lower concentrations and at a much smaller aggregation magnitude.
![Hydrodynamic radius as a function of temperature and concentration for an antibody formulation at pH 8.5. High order aggregate formation is evident for temperatures]() 56 °C." src="/image.axd?picture=2021%2f2%2f3-1.jpg" style="width: 673px; height: 408px;" title="">
56 °C." src="/image.axd?picture=2021%2f2%2f3-1.jpg" style="width: 673px; height: 408px;" title="">
Figure 3. Hydrodynamic radius as a function of temperature and concentration for an antibody formulation at pH 8.5. High order aggregate formation is evident for temperatures > 56 °C. Image Credit: Wyatt Technology

Figure 4. The hydrodynamic radius exhibits a sigmoid relationship as a function of temperature for all antibody concentrations at pH 9.5, showing little change in the midpoint with concentration. Image Credit: Wyatt Technology
The qualitative difference in aggregation processes in the two conditions is further revealed through the size distributions acquired with DLS regularization analysis.
The pH 8.5 sample with 1.88 mg/mL concentration at 80 °C displays a bimodal distribution with populations between 30- 100 nm and 300- 3000 nm, whereas the pH 9.5 sample at an equal concentration exhibits a single distribution at 80- 300 nm, as displayed in Figure 5.

Figure 5. Size distributions obtained at 80 °C via regularization. Left: pH 8.5; right: pH 9.5. Image Credit: Wyatt Technology
Interaction parameter through the thermal transition
kD is negative below the thermal transition and is approximately constant with temperature incline for each pH value. At pH 8.5, the magnitude of kD is around double that of pH 9.5, suggesting higher intermolecular attraction, which corresponds to the highly different aggregation behavior.
kD manifests unique transition behavior versus pH in the vicinity of the folding-unfolding transition and the emergence of aggregation.
kD at pH 8.5 exhibits a substantial step-change varying between 53 °C and 59 °C (Figure 6 and inset). The shift occurs many degrees before any appreciable aggregation can be noted and indicates greater protein-protein attraction as a result of pure unfolding.
kD is constant beyond 59 °C but is noisy as a result of the numerical complexity of assigning a single average radius in a bimodal population.
The extent of aggregation is reliant on concentration, as shown in Figure 3, but this appears to be mainly caused by increased collision rates. Therefore, the calculated value of kD beyond ~ 56 °C likely does not indicate a true thermodynamic interaction but instead demonstrates the kinetics and history of the process of aggregation.
The unfolding transition at pH 9.5 is signaled by a similar change in kD. As before, kD becomes more negative (more attractive) multiple degrees before aggregation. However, instead of a step-change, a local minimum is observed, which occurs just as the quantified hydrodynamic radius starts to exhibit aggregation (Figure 7).
The magnitude of kD declines and becomes less negative during aggregation. This trend in kD shows once again that attractive interactions are more prevalent during the initial unfolding transition when the hydrophobic core is exposed.
In this state, once a stable structure has been realized, these interactions are slightly weakened as the exposed areas are now concealed from the solution.
At approximately 75 °C, a secondary unfolding transition is clearly shown in kD.
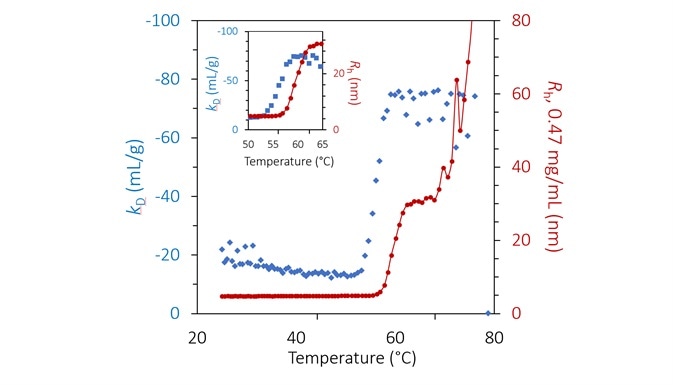
Figure 6. Diffusion interaction parameter (blue diamonds, left axis) and radius (red circles and solid line, right inverted axis) at lowest concentration as a function of temperature at pH 8.5. Inset: same, highlighting the transition region. Image Credit: Wyatt Technology
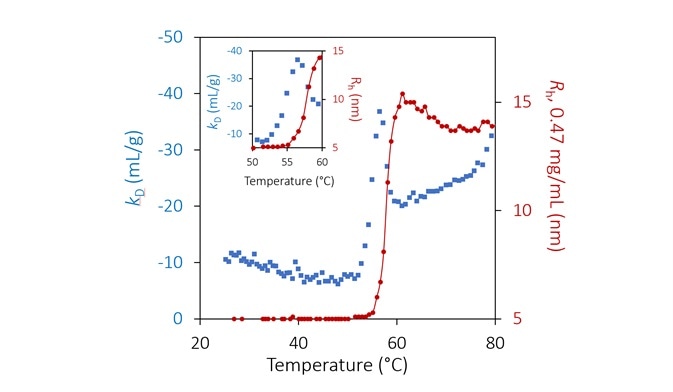
Figure 7. Diffusion interaction parameter (blue diamonds, left axis) and radius (red circles and solid line, right inverted axis) at lowest concentration as a function of temperature at pH 9.5. Inset: same, highlighting the transition region. Image Credit: Wyatt Technology
Conclusions
Scientists are able to focus on the most effective candidates when protein formulations can be screened at the initial development stages, which saves significant amounts of testing equipment, time and sample.
This study shows that the colloidal and thermal stability of proteins, two indicators of aggregation propensity, along with actual aggregation states, can be calculated at the same time during the process of screening with the DynaPro Plate Reader III to rank the suitability of formulation conditions and candidates.
Colloidal stability is quantified as kD, while thermal stability is quantified as Tonset. The temperature dependence of kD offers novel information concerning the impact of unfolding on colloidal interactions because the unfolding process uncovers moieties previously ‘hidden’ from the buffer and additional proteins.
DLS can also determine the average molar mass, the specific volume and chemical stability of molecules in solution as a function of temperature, along with the solution viscosity12, which is another crucial factor in the formulation of high concentration biotherapeutics.
HTS-DLS delivers a significant amount of data for the efficient screening of excipients, candidate molecules and buffer conditions to implement greater productivity.
References and further reading
1. Jocks, T. & Roessner, D. Performing Automated Dynamic Light Scattering Using Plate Reader Technology. Int. Pharm. Ind. 2, 22–25 (2009).
2. Some, D. & Hitchner, E. Characterizing protein-protein interactions via static light scattering: Nonspecific interactions. ResearchGate https://www.researchgate.net/publication/291838630_Characterizing_protein-protein_interactions_via_static_light_scattering_Nonspecific_interactions.
3. Kuehner, D. E. et al. Interactions of lysozyme in concentrated electrolyte solutions from dynamic light scattering measurements. Biophys. J. 73, 3211–3224 (1997).
4. Teraoka, I. Polymer Solutions: An Introduction to Physical Properties | Wiley. Wiley.com https://www.wiley.com/en-gb/Polymer+Solutions%3A+An+Introduction+to+Physical+Properties-p-9780471389293
5. Roberts, D. et al. The Role of Electrostatics in Protein– Protein Interactions of a Monoclonal Antibody. Mol. Pharm. 11, 2475–2489 (2014).
6. He, F., Woods, C. E., Becker, G. W., Narhi, L. O. & Razinkov, V. I. High-throughput assessment of thermal and colloidal stability parameters for monoclonal antibody formulations. J. Pharm. Sci. 100, 5126–5141 (2011).
7. Lehermayr, C., Mahler, H.-C., Mäder, K. & Fischer, S. Assessment of net charge and protein-protein interactions of different monoclonal antibodies. J. Pharm. Sci. 100, 2551–2562 (2011).
8. Saito, S. et al. Effects of ionic strength and sugars on the aggregation propensity of monoclonal antibodies: influence of colloidal and conformational stabilities. Pharm. Res. 30, 1263–1280 (2013).
9. Menzen, T. & Friess, W. Temperature-Ramped Studies on the Aggregation, Unfolding and Interaction of a Therapeutic Monoclonal Antibody. J. Pharm. Sci. 103, 445–455 (2014).
10. Zidar, M., Šušterič, A., Ravnik, M. & Kuzman, D. High Throughput Prediction Approach for Monoclonal Antibody Aggregation at High Concentration. Pharm. Res. 34, 1831–1839 (2017).
11. Esfandiary, R., Parupudi, A., Casas-Finet, J., Gadre, D. & Sathish, H. Mechanism of reversible self-association of a monoclonal antibody: role of electrostatic and hydrophobic interactions. J. Pharm. Sci. 104, 577–586 (2015).
12. He, F. et al. High-throughput dynamic light scattering method for measuring viscosity of concentrated protein solutions. Anal. Biochem. 399, 141–143 (2010).
Acknowledgments
Produced by materials originally authored by Sophia Kenrick and Daniel Some from Wyatt Technology.
About Wyatt
 With a long history of excellence in scientific instrumentation, Wyatt Technology is the recognized leader in innovative light scattering instruments, accessories, software and services for determining the properties of macromolecules and nanoparticles in solution. Wyatt provides cutting-edge solutions for in-line multi-angle static light scattering (SEC-MALS), field-flow fractionation (FFF-MALS), composition gradients (CG-MALS), high-throughput and traditional dynamic light scattering (DLS), electrophoretic mobility via phase-analysis light scattering (MP-PALS), differential refractometry and differential viscosity. With a staff composed of 20% Ph.D. scientists and many more dedicated and experienced support personnel, Wyatt's aim is to delight the customer with the best products, training, customer support and service available in the industry.
Sponsored Content Policy: News-Medical.net publishes articles and related content that may be derived from sources where we have existing commercial relationships, provided such content adds value to the core editorial ethos of News-Medical.Net which is to educate and inform site visitors interested in medical research, science, medical devices and treatments.