Dynamic light scattering (DLS) is generally utilized to determine the particle size distribution of protein therapeutic formulations and other similar bioformulations. This analytical technique has not only become a primary technology within the spheres of screening and development of bioformulations, but is also utilized to predict and monitor the colloidal stability of such formulations. This article explores common issues with regard to the principles, analysis, and measurements of DLS data and shows how to reduce the required time and improve the way DLS data is acquired and understood throughout the biotherapeutic development process.
Brownian Diffusion
Defined as the arbitrary motion of particles in solution, Brownian motion is the result of thermally-driven collisions of dispersant or solvent molecules with the relevant particles. When a solution of particles diffuses under the effect of Brownian motion, the light scattered from this phenomenon will vary with time, as shown in Figure 1, left.
Across long time scales, the scattering trace seems to be representative of haphazard variations regarding a mean. However, when observed on smaller time scales it is apparent that the intensity trace is not arbitrary, but contains a sequence of continuous data points. This continuity is the outcome of particle confinement in positions proximal to those the particles occupied a short time ago, as shown in Figure 1, right. This means, over short time intervals, the particles lack adequate time to shift far from their first positions, and hence the intensity signals are correlated.
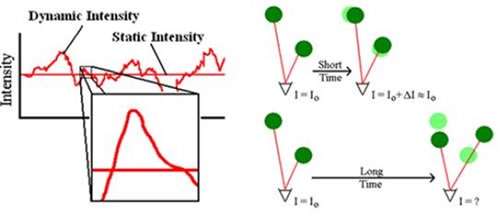
Figure 1. Intensity fluctuations for a solution of diffusing particles (left) and position dependent correlation of the scattering intensity (right).
Intensity Correlation
Intensity correlation is a statistical method used to determine the extent of non-randomness in a random data set. When this technique is applied to an intensity trace dependant on time, the correlation coefficients (Gτ) are measured as follows:
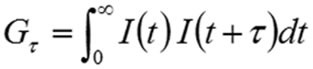
Where τ is the delay time.
Intensity autocorrelation coefficients are usually normalized, such that G(∞) = 1. In case of monochromatic laser light, this normalization induces a lower baseline limit of 1 for G(∞) and an upper correlation limit of 2 for G(τ0), However, in reality, the empirical upper limit for DLS autocorrelation is approximately 1.9. In any dynamic light scattering instrument, a digital correlator constantly adds and multiplies short time scale variations in the quantified scattering intensity to produce the correlation curve for the sample. Figure 2 shows some examples of correlation curves measured by the DLS technique for two solutions containing sub-micron particles. In case of ovalbumin, the faster and smaller diffusing protein, the calculated correlation curve has decomposed to baseline, which denotes a total loss of correlation within 100μs, while silicon dioxide, the slower and larger diffusing particle, needs 1000μs before complete loss of correlation.
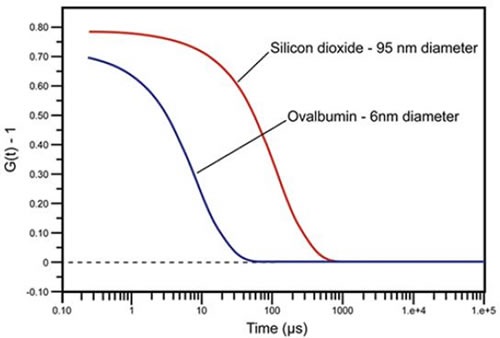
Figure 2. DLS measured correlation curves for 6nm ovalbumin and 95nm silicon dioxide.
Deconvolution (Fitting) Algorithms
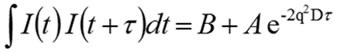
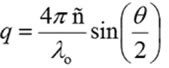
In case of monodisperse samples containing one group of particle size, it is possible to accommodate the correlation curve into a single exponential form as specified in the expression shown below, where A is the amplitude, B is the baseline, and D is the diffusion coefficient. The scattering vector (q) is described by the second expression, where λ0 is the vacuum wavelength of the laser, ñ is the solvent refractive index and θ is the scattering angle.
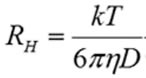
In DLS, the hydrodynamic radius (RH) is measured from the quantified diffusion coefficient by applying the Stokes-Einstein equation shown below:
Where T is the temperature, k is the Boltzmann constant, and η is the dispersant viscosity.
An appropriate procedure proposed by ISO was a single or cumulant exponential type fit of the correlation curve. The hydrodynamic size obtained through this technique is an intensity weighted average referred to as the Z average size. Although the Z average and cumulant algorithm are effective for illustrating the characteristics of general solutions, the Z average can be ineffective for multimodal solutions containing different groups of particle size. For such samples, multi-exponential fitting algorithms can give a better understanding of particle size distribution; for instance, in Figure 3 the correlogram for a 10mg/mL lysozyme sample in 100mM sodium chloride (NaCl) at 69°C temperature shows two exponential decays, one for the slow-moving aggregate and one for the fast-moving monomer at 388nm and 3.5nm, respectively. By means of the CONTIN algorithm, the size distribution was obtained by accommodating the quantified correlogram to a multi-exponential. A Z average of 12.4nm is specified when one exponential cumulant algorithm is utilized. Although the Z average is useful for citing an average value, it cannot suitably describe the distribution results.
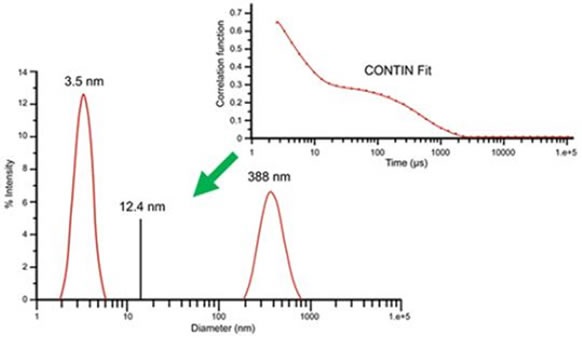
Figure 3. DLS measurement results for 10mg/mL lysozyme in 100mM NaCl at 69°C, derived using multi-exponential CONTIN algorithm.
Intensity to Mass Transform
The region within each peak of the intensity particle size distribution determined by the DLS technique is proportional to the relative scattering intensity of each group of particles. The scattering intensity is relative to the square of the molecular weight, and per se the intensity distribution will be skewed towards larger sizes of particles. Although anticipated, this behavior may confuse new DLS users. Providentially, a change of the intensity to a mass or volume distribution can be achieved by means of the Mie theory, in which the analyte’s optical properties are utilized to standardize the impacts of the R6 reliance of the scattering intensity. The assumptions needed for the intensity to volume transformation are as follows:
- All particles exhibit an equal and uniform density
- The particles can be shaped as spheres
- There is no inaccuracy in the intensity particle size distribution
For applications applicable to the biopharmaceutical industry, the first two assumptions are practical; however, the third assumption will not work because of the ineffective nature of the correlogram fitting in the DLS method. This means, irrespective of how monodisperse the sample is, the particle size distribution measured by the DLS technique will always exhibit some amount of inherent polydispersity, that is, it will not be possible to obtain a single band distribution as is possible with TEM measurements. Therefore, the mass transformation should be utilized to report the relative mass composition, and not the particle size.
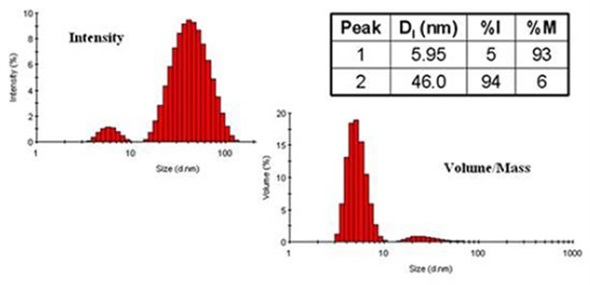
Figure 4. Comparison of DLS derived intensity and mass distributions for ovalbumin in PBS at 79°C.
A comparison of the DLS-derived mass distributions and intensity for ovalbumin in PBS at 79°C temperature is shown in Figure 4. From this example, two size populations are very clear: one at 46nm and the other at 6.0nm. By intensity, the group of larger size of particle governs the distribution, although it denotes just 6% of the entire mass of the sample. When measurement results are reported, the proper peak mean sizes to report would be those obtained from the intensity distribution, with the %mass values utilized to report composition data, for instance 46.0nm and 5.95nm with a relative mass composition of 6% and 93%, respectively.
Conclusion
The application of the dynamic light scattering technique within the biopharmaceutical industry can be attributed to its extensive sample concentration ranges, broad working size, and low volume requirements. However, the application of DLS to protein formulations is focused around data interpretation, which presents a challenging prospect. This article gives a brief description of the main principles of DLS, i.e., theory, deconvolution (fitting) algorithms, correlation statistics, and the intensity to mass transformation.
About Malvern Panalytical

Malvern Panalytical provides the materials and biophysical characterization technology and expertise that enable scientists and engineers to understand and control the properties of dispersed systems.
These systems range from proteins and polymers in solution, particle and nanoparticle suspensions and emulsions, through to sprays and aerosols, industrial bulk powders and high concentration slurries.
Used at all stages of research, development and manufacturing, Malvern Panalytical’s materials characterization instruments provide critical information that helps accelerate research and product development, enhance and maintain product quality and optimize process efficiency.
Sponsored Content Policy: News-Medical.net publishes articles and related content that may be derived from sources where we have existing commercial relationships, provided such content adds value to the core editorial ethos of News-Medical.Net which is to educate and inform site visitors interested in medical research, science, medical devices and treatments.