The biopharmaceutical industry faces a continuous pressure to deliver innovative treatments in a safe and appropriate manner, including the rapidly growing area of therapeutic antibodies.
However, the processes involved in the development of new therapeutic antibodies are not only extensive but also complicated as they come with certain analytical challenges, in addition to limited availability of samples at the start of the process.
Therefore, if biophysical parameters are evaluated during the validation of candidates and early formulation development from the outset, this can considerably save both time and costs, and the risk of possible problem candidates can also be reduced by rapid detection.
Issues related to high viscosity present a major challenge throughout bio-processing and also during patient administration. Early-stage formulations and candidates can be screened for any uncharacteristic changes in viscosity. Such measures can aid in detecting monoclonal antibodies, also known as mAbs that might present formulation challenges. mAb degradation often takes place via self-association, and these aggregation processes can also promote changes in the formulation viscosity.
With target profiles of viscosity and concentration set and an automated relative viscosity screen with high reproducibility and resolution at low concentrations of protein, it is possible to detect mAbs with unusually high viscosity increases from just a small quantity of sample. Lavoisier and Schlaeppi reported that mAbs with unusually high viscosity profiles can be differentiated from mAbs with low viscosities at concentrations down to 25mg/mL.
Malvern Panalytical Viscosizer TD uses Taylor Dispersion Analysis to provide an automated biophysical characterization tool that offers low volume, solution-based molecular stability and size measurement capabilities, in conjunction with microcapillary Poiseuille flow for relative viscosity assessment.
Measurements of relative viscosity are carried out by administrating a 6µl sample plug within the capillary under a continuous drive pressure. Next, the edges of the sample plug are identified at two permanent windows set along the capillary by a change in refractive index. The time between windows is then determined (Δts).
Following this, the sample time is referenced versus the time taken for a buffer or solvent of known viscosity, such as water, to pass between the windows (Δtr), allowing the sample’s viscosity to be calculated. Then, automatic processes are used to cleanse the microcapillary and perform the measurements again. Before the measurements are taken, samples are kept in an autosampler, which is temperature-controlled.
The experimental work in the following section describes mAb measurements in different formulation buffers and with the inclusion of standard excipients. The experiment shows how slight differences in viscosity with excipient and concentration changes can be consistently determined using the microcapillary flow method.
Experimental Framework
First, solutions of phosphate, histidine and citrate buffers were prepared for use as stock solutions. The pH of individual stock solutions was then determined using a Mettler-Toledo Seven Easy pH meter, as shown in Table 1. Two standard excipients were also used which included 0.5M sucrose - a protein stabilizer at the concentration of use, and 0.05% Tween 20 - a surfactant utilized to prevent aggregation caused by surface and stress.
Table 1. pH measurements of buffer solutions
|
Buffer
|
Measured pH
|
|
Citrate
|
4.035
|
|
Histidine
|
7.763
|
|
Phosphate
|
7.225
|
Table 2. Sample concentrations for each buffer plus additional excipients
|
mAbs Concentration (mg/mL)
|
Excipient Added
|
|
13.5
|
None
|
|
5
|
None
|
|
1
|
none
|
|
1
|
0.5 M sucrose
|
|
1
|
0.05% Tween 20
|
Through dialysis buttons, samples were prepared to dialyze 13.5mg/mL of mAbs in each buffer and provide the samples (Table 2).
With the help of an uncoated capillary, measurements of relative viscosity were carried out on a Malvern Panalytical Viscosizer TD. Throughout the process, only default measurement settings for viscosity were used. As a reference, a 1mg/mL caffeine solution in water was used. In order to reduce capillary interactions, a 0.1M NaOH wash step was followed. Finally, all the samples were kept in the autosampler at 4°C temperature before testing. For each individual sample, measurement temperatures were 5°C, 25°C and 37°C.
Results and Discussion
Radar charts for the three buffers - phosphate, citrate, and histidine - are shown in Figures 1 to 3, indicating the viscosity changes for varied concentration solutions of mAb, and at 1mg/mL with the inclusion of two common excipients at three measurement temperatures.
The plots clearly show predictable changes in viscosity with respect to temperature - as the temperature decreases, the viscosity of individual sample increases.
Figure 4 shows a bar chart, illustrating variations in mean viscosity for mAbs samples at three concentrations in individual buffer at a temperature of 25°C. Figure 5 shows a bar chart, demonstrating the variations in mean viscosity for mAbs samples at a concentration of 1mg/mL in each buffer, and with the inclusion of excipients (Tween 20 and sucrose) at 25°C.
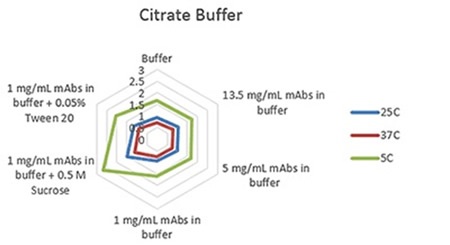
Figure 1. Radar chart of citrate buffer sample viscosity results measured at each run temperature (viscosity units are cP (or mPas)).
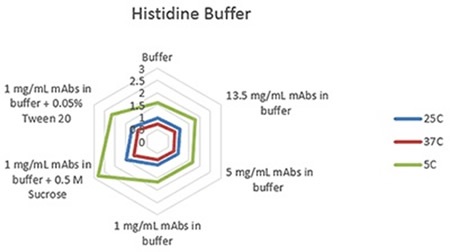
Figure 2. Radar chart of histidine buffer sample viscosity results measured at each run temperature (viscosity units are cP (or mPas)).
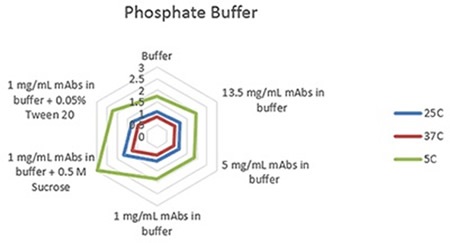
Figure 3. Radar chart of phosphate buffer sample viscosity results measured at each run temperature (viscosity units are cP (or mPas)).
On each chart, the error bars display the standard deviation of the measurements for each sample and thus shows the advantage of using the microcapillary flow method in the Viscosizer TD tool to create highly reproducible and high resolution data for relative viscosity measurements at low concentrations and viscosities.
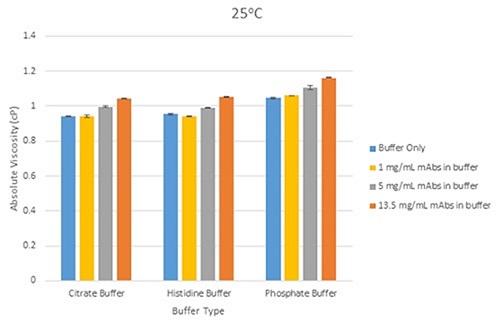
Figure 4. Bar chart showing the differences in mean viscosity for mAbs samples at three different concentrations, grouped by their buffer, at a measurement temperature of 25°C (error bars show the relative standard deviation of the measured viscosities.
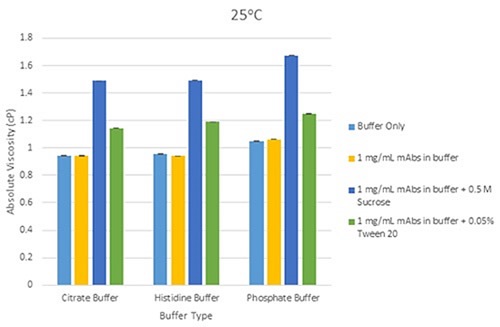
Figure 5. Bar chart showing the differences in mean viscosity for mAbs samples at 1mg/mL concentration, grouped by their buffer and with the addition of sucrose and Tween 20 as excipients, at a measurement temperature of 25°C (error bars show the relative standard deviation of the measured viscosities).
For formulations that include excipients, the same principle of relative viscosity screening can be used so that unusually high viscosity responses can easily be detected. These generally occur due to a change in conformation or self-association of the protein molecule in the solution being assessed, or both.
Conclusion
The relative viscosity screening method used in the Malvern Panalytical Viscosizer TD tool clearly shows its capability to distinguish slight variations between protein formulations of low viscosity, in addition to highly repeatable results.
These variations include the effect of sample concentration in different buffers, the inclusion of excipients, as well as the effect of temperature on the viscosity. These parameters are especially appropriate for early formulation stages of the biopharmaceutical development processes, in view of very low sample volume requirements and the additional advantages of automation.
This rise in viscosity for 1mg/mL mAb solutions containing excipients (Tween 20 and sucrose) is due to the additive viscosity from the excipient. By employing suitable working limits on viscosity-concentration profiles for mAbs systems, relative viscosity screening with a high resolution method with high reproducibility can emphasize deviations from ideal viscosity behavior at low concentrations. The method can therefore be used to detect possible problem candidates as quickly as possible in the biopharmaceutical development pipeline.
References
- S. Goswami, W. Wang, T. Arakawa, S. Ohtake, Antibodies, 2, 452–500 (2013)
- F. He , V.I. Razinkov, C.R. Middaugh, and G.W. Becker, High-Throughput Biophysical Approaches to Therapeutic Protein Development (Chap 2) in L.O. Narhi (ed.) Biophysics for Therapeutic Protein Development, Biophysics for the Life Sciences 4, Springer, New York (2013)
- A. Lavoisier, J-M Schlaeppi, ‘Early developability screen of therapeutic antibody candidates using Taylor Dispersion Analysis and UV area imaging detection’ mAbs 7:1, 77-83 (2015)
- E.Y. Chi, Excipients and their Effects on the Quality of Biologics, AAPS (2012)
- T.J. Kamerzell, R. Esfandiary, S.B. Joshi, C.R. Middaugh, D.B. Volkin, Adv. Drug Deliv. Rev. 63(13); 1118-59 (2011)
About Malvern Panalytical

Malvern Panalytical provides the materials and biophysical characterization technology and expertise that enable scientists and engineers to understand and control the properties of dispersed systems.
These systems range from proteins and polymers in solution, particle and nanoparticle suspensions and emulsions, through to sprays and aerosols, industrial bulk powders and high concentration slurries.
Used at all stages of research, development and manufacturing, Malvern Panalytical’s materials characterization instruments provide critical information that helps accelerate research and product development, enhance and maintain product quality and optimize process efficiency.
Sponsored Content Policy: News-Medical.net publishes articles and related content that may be derived from sources where we have existing commercial relationships, provided such content adds value to the core editorial ethos of News-Medical.Net which is to educate and inform site visitors interested in medical research, science, medical devices and treatments.