Antibodies are a group of naturally occurring molecules that directly neutralize certain structures in harmful agents. As a result, these molecules hold a great deal of interest in the biopharma, biotherapeutic, and pharmaceutical industries.
Today, advances have been made to such an extent that scientists are now able to create antibodies in lab environments. Since most of the function of an antibody is dependent on its molecular integrity and functionality, complete characterization of these materials including molecular size, molecular weight, and purity is important to guarantee efficacy.
Size-exclusion chromatography (SEC), also known as gel permeation chromatography (GPC), is a technique that is extensively used to define a variety of samples, ranging from proteins and bulk manufactured materials to other biological macromolecules, including antibodies.
By using the SEC technique, the molecular weight distribution, molecular weight moments, hydrodynamic size, and intrinsic viscosity of these materials can be measured. A complete setup of Malvern Instruments’ OMNISEC SEC system is shown in Figure 1. This article shows how OMNISEC system can be used to measure the absolute molecular weight (MW) of antibodies, regardless of size and structural changes.
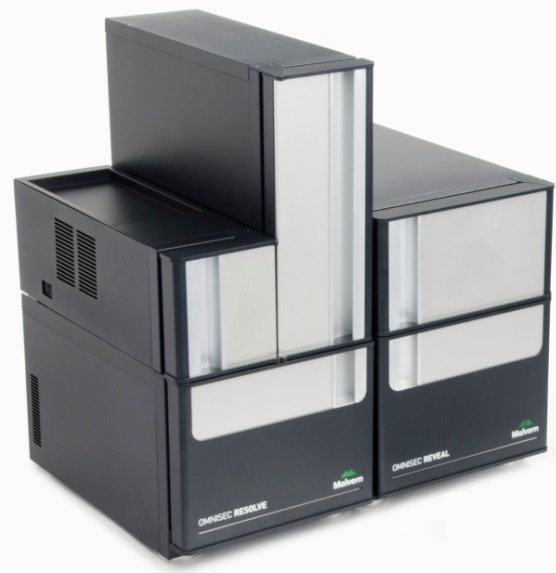
Figure 1. Malvern's OMNISEC tetra-detector SEC system.
How SEC works
First, a liquid mobile phase carries a solvated sample via an analytical column that is filled with porous gel particles, where the macromolecular components are separated in a diffusely controlled manner, and the sample is eventually viewed by using different detectors as each sample slice elutes.
It is the molecular size that controls the elution of samples, and it is the larger molecules that elute first. It must be noted that the elution order is not based on molecular weight, but molecular size.
The strength of the SEC analysis relies on the type of detector connected to the chromatography. Two standard types of SEC configurations are:
- A column calibration SEC setup
- An advanced detection SEC setup
A single concentration detector such as a UV or refractive index (RI) detector is used by a column calibration SEC system to evaluate the retention volume of analyte molecules via a SEC column against a set of standards with known molecular weights.
Using a combination of viscometer, UV/Vis photodiode array (PDA), RI, and light scattering detectors, an advanced detection SEC configuration directly measures the sample molecular sizes, molecular weight, and intrinsic viscosity, regardless of elution order or retention volume.
This article shows how advanced detection SEC and column calibration are used to analyze three samples of antibodies. Comparisons are then drawn between the data obtained from both techniques, underscoring the benefits of advanced detection.
SEC experimental conditions
For SEC analysis, Malvern’s OMNISEC system was used to prepare three antibody samples, 1, 2, and 3, in water at approximately 0.5 mg/mL concentrations. Then, using 2 × P3000 in a mobile phase of PBS (phosphate-buffered saline) at a flow rate of 0.75 mL/minute, all the three antibody samples were examined.
To deliver the sample volume economically, the zero-waste mode was used to administer 100 μL of each sample. Throughout the analyses, the detector compartments and the autosampler were kept at a temperature of 25 °C.
SEC results
Figures 2–4 show the tetra detector chromatograms for the three antibody samples. The UV/Vis PDA signal at 280 nm is presented in purple, the RI signal is indicated in red, the right angle light scattering detector is highlighted in green, the viscometer signal is shown in blue, and LogMW is shown as a gold line.
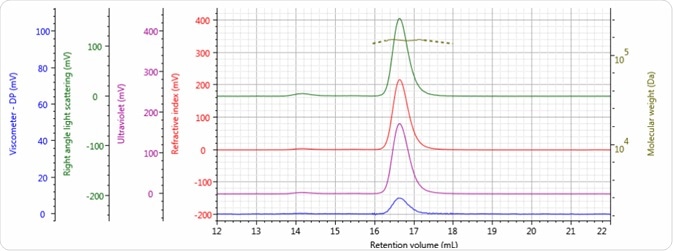
Figure 2. Tetra detector chromatogram of sample 1.
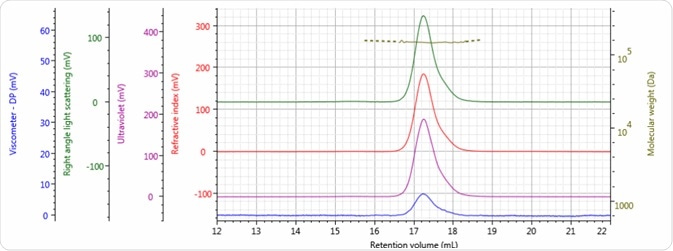
Figure 3. Tetra detector chromatogram of sample 2.
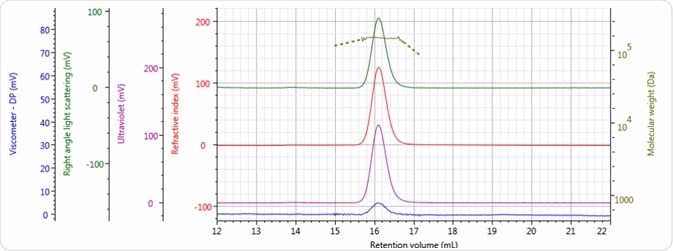
Figure 4. Tetra detector chromatogram of sample 3.
Good chromatography was exhibited by all three antibody samples, as shown by the detector signals that return to baseline. The sample retention volumes were briefly examined which showed that sample 3 eluted at the lowest elution volume, which is the earliest elution time, and this is followed by sample 1 and then by sample 2. This trend is indicated in the overlay of the refractive index chromatograms illustrated in Figure 5.
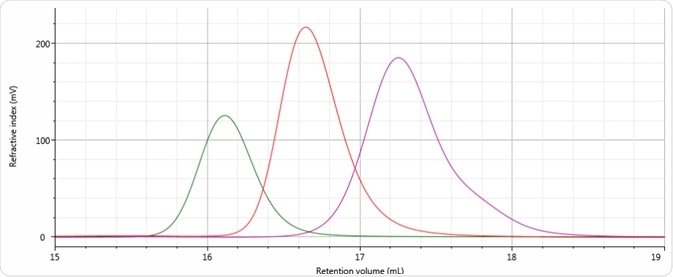
Figure 5. Overlay of refractive index chromatograms of samples 1 (red), 2 (purple) and 3 (green).
Based on this comparison, a conclusion was reached that among all the three samples, sample 2 has the smallest molecular size and sample 3 has the largest molecular size, followed by sample 1. To make the comparisons, the word molecular size was used not based on molecular weight, but on elution order. While the same trends are followed by molecular weight and molecular size in majority of cases, this is not necessarily the case for all samples.
The advanced detection data and column calibration are discussed in the following sections. The same chromatographic data are employed for both sets of calculations to draw a reasonable comparison between the advanced detection and column calibration analysis methods.
Column calibration results
To provide a molecular weight profile for the column set, Sigma Aldrich’s protein molecular weight marker kit containing an exclusion limit marker and six globular proteins was prepared in PBS at about 1-3 mg/mL concentrations.
The protein molecular weights ranged between 29 kDa and 669 kDa. Figure 6 shows the calibration curve produced, and Table 1 presents the dispersity and molecular weight values measured for all three antibody samples depending on the protein calibration curve.
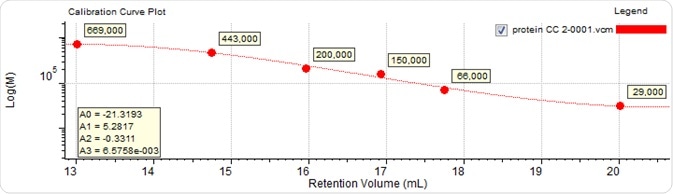
Figure 6. Calibration curve generated from six proteins with established molecular weight values.
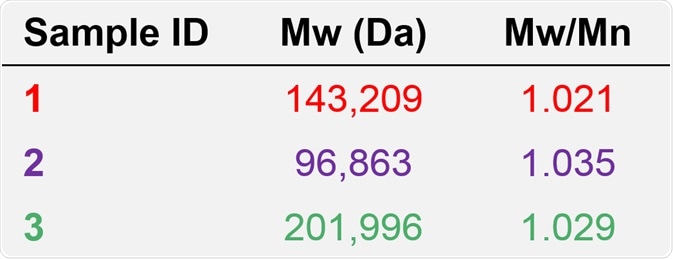
Table 1. Molecular characterization data from column calibration for samples 1, 2, and 3.
As predicted based on the elution volumes depicted in Figure 5, and together with the knowledge that with increasing retention volume the calibration curve (Figure 6) reduces to lower molecular weight, sample 3 was found to have the highest molecular weight, at approximately 202 kDa. This is followed by sample 1 at 143 kDa, and then by sample 2 at approximately 97 kDa.
Considering the calibration curve illustrated in Figure 6, this difference in molecular weights was found to correspond with the difference in retention volume of more than 1 mL (~16.1 to 17.2 mL) starting from the peak of sample 3 through to the peak of sample 2.
When a single detector column calibration SEC method is used, this relative molecular weight — as compared to the protein standards utilized to generate the calibration curve — is the level of the molecular data available.
Advanced detection results
To further analyze these samples, the molecular characterization data derived from advanced detection for all the three samples (Figures 2–4) are presented in Table 2.
More detailed information is obtained, including the dispersity (MW/Mn), absolute molecular weight (MW), hydrodynamic radius (RH), and intrinsic viscosity (IV) by using the combination of concentration, light scattering, and viscometer detectors. 0.185 was the dn/dc used for analysis which is characteristic of proteins in aqueous media.
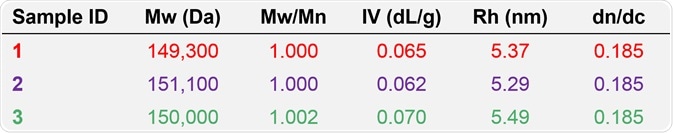
Table 2. Molecular characterization data from advanced detection for samples 1, 2, and 3.
Based on the apparent difference between the data derived from advanced detection and column calibration, the relative molecular weights measured from column calibration offered a series of values for the antibody samples 1, 2, and 3, whereas the absolute Mw data derived from advanced detection, accurately demonstrates that the antibody samples 1, 2, and 3 possess the same molecular weight, at approximately 150 kDa.
In addition, the dispersity values of about 1 match with the flat LogMW trace shown in Figures 3 to 5, indicating that these three antibody samples are indeed discrete species. Also, the advanced detection data supports the trend of molecular size seen from the elution order (Figure 5), since sample 3 has the largest RH value and highest IV, and this is followed by sample 1, and finally by sample 2.
In other words, the three antibody samples possess different molecular shapes, and that it is not the molecular weight differences but the size and shape differences that make the samples to elute at varying retention volumes.
If column calibration data alone had been considered in the analysis of these three samples, this would have resulted in inaccurate molecular weight data. For instance, a scientist may reach a false conclusion that antibody sample 3 had aggregated or had a chemically-bound impurity, or that antibody sample 2 possessed a lower molecular weight because of the loss of its L polypeptide chains.
In effect, neither of these has taken place, and the difference in molecular sizes is the result of unexpected conformation changes or structural differences.
A light scattering detector is used by advanced detection to determine the absolute Mw, regardless of retention volume. The technique provides accurate molecular weight information on sample components and shows structural details that cannot be seen with column calibration methods.
Conclusions
This article shows the advantages of using advanced detection SEC. Although column calibration SEC analysis has been effectively used for a number of years, it depends on the wrong assumption that molecular weight only trends with the molecular size and hence the retention volume.
Whilst this trend is exhibited by many materials, there are several macromolecules including antibodies that also have variable structures.
When these types of materials are subjected to column calibration SEC analysis, it can result in inaccurate quantitative and qualitative data and thus false conclusions. In contrast, advanced detector SEC not only determines the absolute MW, regardless of retention volume and molecular size, but also provides structural data such as RH and IV.
For both manufacturers and researchers, accurate determination of the molecular size and molecular weight of antibodies is very important to preserve the sample integrity and purity needed for particular applications.
This type of disclosure will not only provide a better understanding but also help control the behavior of these useful materials and their ensuing end-application as beneficial drugs, including therapeutics.
About Malvern Panalytical

Malvern Panalytical provides the materials and biophysical characterization technology and expertise that enable scientists and engineers to understand and control the properties of dispersed systems.
These systems range from proteins and polymers in solution, particle and nanoparticle suspensions and emulsions, through to sprays and aerosols, industrial bulk powders and high concentration slurries.
Used at all stages of research, development and manufacturing, Malvern Panalytical’s materials characterization instruments provide critical information that helps accelerate research and product development, enhance and maintain product quality and optimize process efficiency.
Sponsored Content Policy: News-Medical.net publishes articles and related content that may be derived from sources where we have existing commercial relationships, provided such content adds value to the core editorial ethos of News-Medical.Net which is to educate and inform site visitors interested in medical research, science, medical devices and treatments.