This article covers the different ways in which new lab-based PXRD systems can help scientists in the pharmaceutical industry synthesize novel, stable compounds of a high quality and commercialize them faster.
All of the applications covered below can be carried out using one PXRD system.
Detecting the Presence of Trace Polymorphs and Impurities
One of the key uses of PXRD in the pharmaceutical industry is detecting the presence of polymorphs. The increasing requirement for more stringent limits of detection (LOD) is resulting in advances in optical and detector technology.
Conventional PXRD systems tend to have a LOD in the region of 0.5-2%.1,2,3 whereas modern systems have brought this value down to 0.1%, which is 10x less than the standard LOD. This huge drop in LOD is the result of optics that cancel out continuous radiation (Bremsstrahlung) which results in a better signal:noise ratio.
An example of one of these optics is the Malvern Panalytical Bragg- BrentanoHD optic (BBHD). The example below is the diffraction pattern for a mixture of two different crystalline polymorphs of Indomethacin (IMC) in excipient.
The mixture consists of 4.75% gamma-Indomethacin and 0.25 % alpha-Indomethacin with excipients of 1.5% Magnesium stearate and 0.25 % alpha-Indomethacin. The advantage of using a BBHD optic for measurement of the alpha- Indomethacin peak at an LOD of 0.12% (Figure 1a) compared to detection using slit optics (Figure 1b) is shown below.
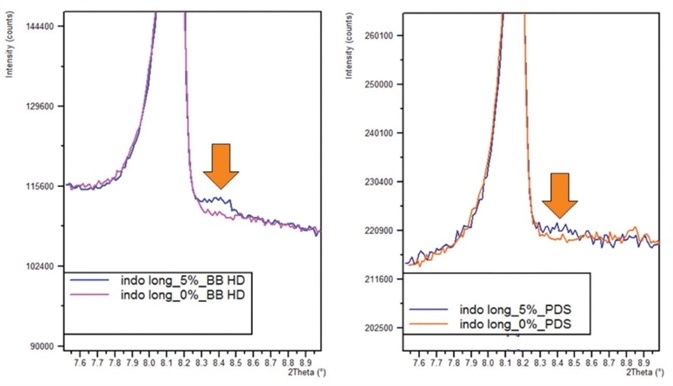
Figure 1a. 0.25% alpha-indomethacin peak measured with BBHD optic. b. 0.25% alpha-indomethacin peak measured with slit optics.
Determining Amorphous Content
PXRD is one of the conventional methods used for the characterization of amorphous content present in 10-90% of the sample.4 As XPRD instrumentation has become increasingly sophisticated and provided richer data, modern systems can now determine to as low as 1% amorphous content.
In this case study 10 different samples of 10 α-lactose were produced with amorphous content ranging between 1 to 10%. The data produced was then analyzed via two different methods to determine the amount of amorphous content:
- Peak to background ratio analysis
- PLS (partial least squares) regression
PLS regression is also used for other analytical techniques (such as infrared analysis) for the analysis of amorphous content in pharmaceuticals and is perfect for data sets where specific peaks for phases are not obvious. “PLS uses the whole spectrum or a selected region of the spectrum to develop calibration models.”5
The confidence limits of the two different analyses are compared in Figure 3. PLS provided a calibration curve with a healthier standard deviation of 0.035%, whereas peak to background provided a standard deviation of 0.26%.
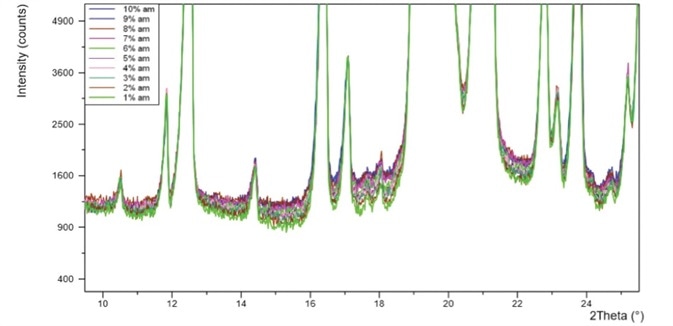
Figure 2. PXRD patterns for ten -lactose monohydrate standards with 1-10% amorphous content.
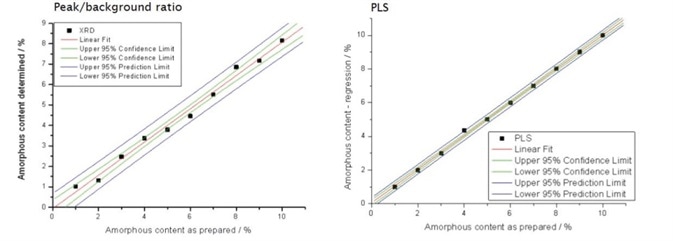
Figure 3. Comparison of con‑ dence limits for two methods of amorphous content determination.
PLS also gave a lower error of intercept (0.024% compared to 0.179%) and a higher R2 (coefficient of determination) value, which signifies a better relationship between expected and measured results. For these reasons PLS should be considered as a better method for the determination of low amorphous content.
Exploring Co-Crystallization Parameters and Polymorphs
A key process in drug development is the determination of polymorphs. Polymorphs are chemically equivalent to the API but present in different crystallographic forms. These different forms can display different dissolution properties and, as a result, different bioavailabilities.
Analysis of polymorphs and salt screening can be used to help select the best form of a solid drug with the optimum properties. Discovering all of the possible polymorphs of a drug, followed by patenting them, allows pharmaceutical developers to protect their intellectual property.
PXRD instruments with an X-Y-Z stage can be used for the high-resolution, high throughput combinatorial screening of pharmaceuticals in a well plate if a transmission configuration is used.
Data processing is assisted by software which can perform automatic analysis of clusters for the comparison, grouping and ID of the different crystalline and amorphous phases formed in the different wells of the plate.
In the given example cimetidine (sourced from Sigma-Aldrich) was dissolved in different solvents in 96 different aliquots, which were then recrystallized under different conditions (temperature and pressure).
PXRD measurements were then taken for each sample. Cluster analysis of all of the samples (Figure 4) found that there were three different clusters for all of the sample, further analysis allowed the clusters to be indexed and fitted.
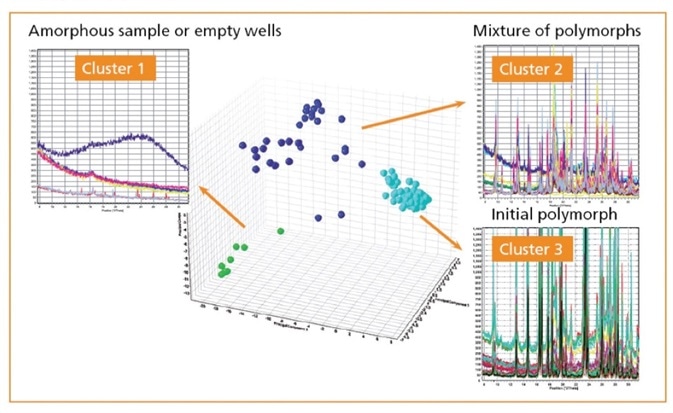
Figure 4. Cluster analysis of PXRD patterns measured on a 96 well plate.
Studying the Crystallization Process
The process of crystallization is a key part of pharmaceutical development and manufacturing due to its influence over process efficiency and profitability. More than 90% of pharmaceuticals possess crystallized APIs and unmonitored changes in the crystallization process can impact crystal structures, which in turn impacts both the safety and bioavailability of the drug.
For these reasons crystallizations during drug development, and the following mass production, must be followed for QbD purposes. Equipping a lab PXRD instrument with a flow cell allows in-situ analysis of crystallization behavior, for example the formation of hemi-hydrates and intermediates during a crystallization and the optimization of conditions such as the solvent and anti-solvent concentrations and the pH.
In this research DL-Alanine underwent crystallization in solutions of differing pH. For the experiment that took place at pH 6.1 (Figure 5) it was observed that after 38 hours of crystallization the formation of acicular crystals were heavily favored.
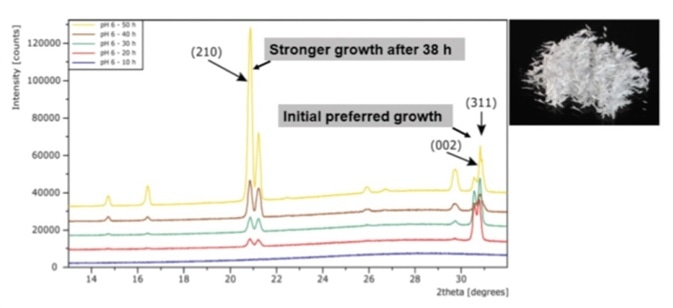
Figure 5. PXRD patterns of the crystallization of DL-Alanine.
Determination of Protein Shape, Compactness, Oligomeric State and Stability with Temperature Changes
The analysis of protein solutions using small-angle X-ray scattering (SAXS) is an established technique in structural biology. In-situ SAXS analysis can be used to determine sample information such as protein, size, structure and shape, aggregation, native and folded states, temperature stability, and molecular weight/oligomeric states.
In the provided case study SAXS was used for size, structure and shape analysis of the protein apoferritin in a dilute solution. The analysis of apoferritin (Figure 6) showed an asymmetric pair distance distribution function p(r), which indicates a hollow structure with a maximum size (Dmax) of 13 nm. This is in agreement with the expected structure calculated by ab inito modeling (Figure 7a).
The ab inito method involved a DAMMIF6 method with bead modeling and simulated annealing. The results gave a spherical protein with a hollow central cavity. Running the SAXS data through a CRYSOL7 model (from the structure of the single crystal, PDB 1IER) was concurrent with the experimental data. This demonstrates that the crystallized structure of the protein (Figure 7b) is similar to its structure in a dilute solution.
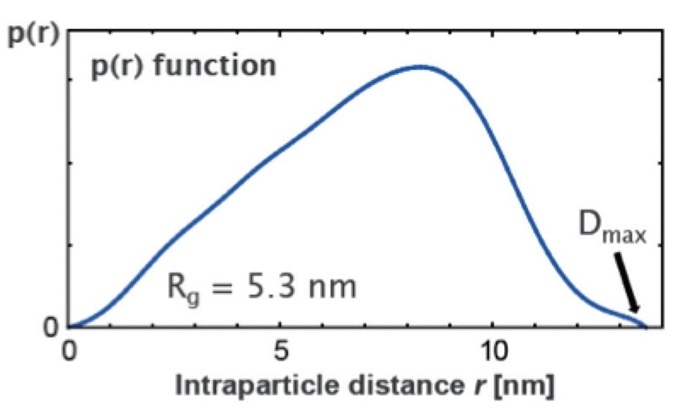
Figure 6. Pair distance distribution function p(r) for the protein apoferritin.
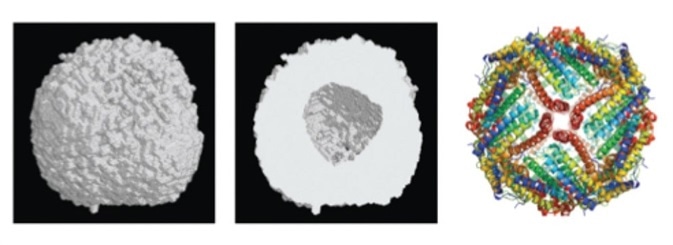
Figure 7a. ab initio shape reconstruction b. protein structure of apoferritin.
Assessing Effect on Materials Subjected to Varying Heat and Humidity
Exposure of pharmaceuticals to high relative humidities (RH) and/or temperatures can result in phase changes, which adversely impact the drugs efficacy. This is important because these environmental changes can occur when pharmaceuticals are stored or transported.
Modern PXRD systems can be set up with advanced temperature control stages which allows PXRD measurements to take place at humidities of 95% (at ambient temperature) and 75% at 60 °C.
In this case study an important cryo-protecting compound used to protect protein-based pharmaceuticals which can lyophilize, crystalline trehalose dehydrate (C12H22O11- 2H2O), was analyzed at different temperature and RH conditions. The PXRD data was used to analyze which phases were present under different conditions, and to use this data to draw a RH-T phase diagram (Figure 8).
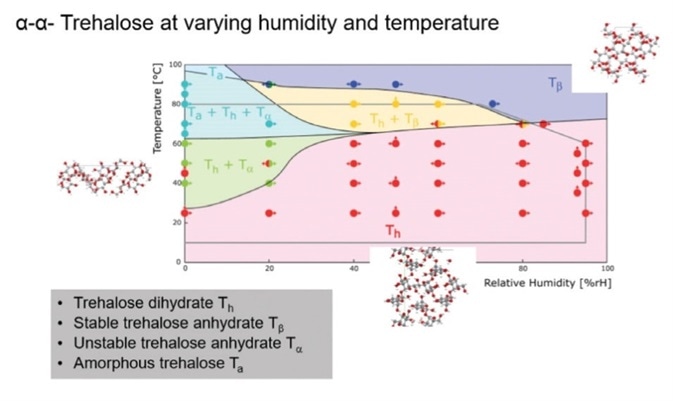
Figure 8. RH-T phase diagram for trehalose.
It was established that Th was stable over a large temperature range. One amorphous form of trehalose (Ta) was observed, and two different polymorphs of trehalose anhydrate were also observed; one unstable (Tα) and another stable (Tβ).
Comparing your Material’s Structure to Literature and Patent XRPD Patterns
Materials produced by pharmaceutical manufacturers should always be compared to diffraction patterns found in the literature and in patents. Malvern Panalytical’s Highscore (Plus) software8 contains a bitmap converter, which can be used to digitize both digital and printed diffraction patterns into XML files for automatic comparisons.
This allows all relevant polymorph patterns to be compared with existing patterns from single crystal solutions and matched with data bases to make sure that ‘novel’ APIs are not overlapping with already patented compounds.
In this case study PXRD patterns in the patent US 8217061 B29 were digitized (Figure 9) and cluster analysis was used to compare them. The seven patterns formed two clusters of different patterns, with three determined to be statistically different from the clusters (Figure 10).
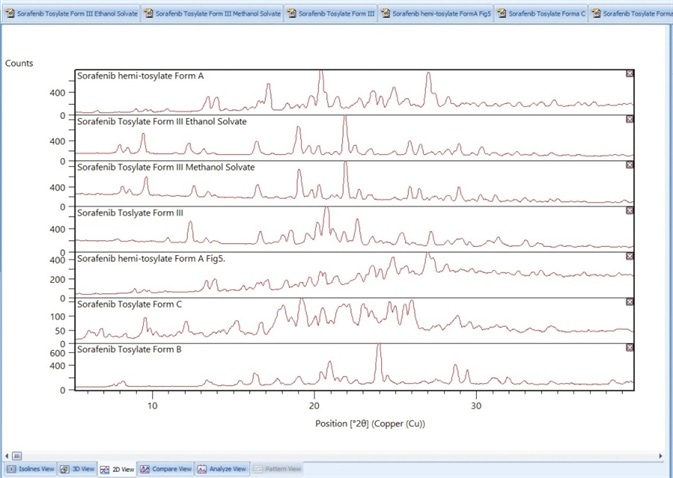
Figure 9. Digitized PXRD patterns from the patent US 8217061 B211.
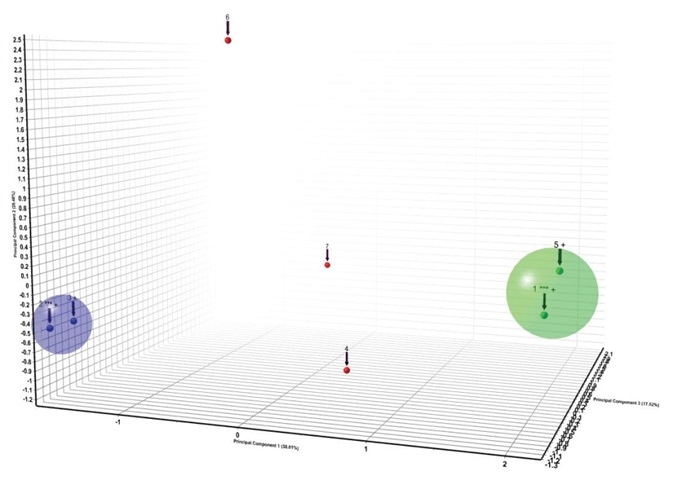
Figure 10. Cluster analysis of the patterns found in US 8217061 B211.
References
- http://www.nf-itwg.org/pdfs/ITWG-INFL-PXRD.pdf, page 6
- http://www.americanpharmaceuticalreview.com/Featured-Articles/36758-Approachesto-Quanti_ cation-of-Amorphous-Content-in-Crystalline-Drug-Substance-by-Powder-Xray-Di_ raction/
- S. Byrn, G. Zogra_ , X. Chen, Solid State Properties of Pharmaceutical Materials, John Wiley and Sons, 2017, p.337
- D. Franke and D.I. Svergun, J. Appl. Cryst. 42 (2009), 342-346.
- D.I. Svergun, C. Barberato, M.H.J. Koch, J. Appl. Cryst. 28 (1995),768-773.
- T. Degen, M. Sadki, E. Bron, U. König & G. Nénert, The HighScore Suite, Powder Di_ r. Vol. 29, (2014), Supplement S2, S13 - S18.
- https://www.google.com/patents/US8217061

About Malvern Panalytical
Malvern Panalytical provides the materials and biophysical characterization technology and expertise that enable scientists and engineers to understand and control the properties of dispersed systems.
These systems range from proteins and polymers in solution, particle and nanoparticle suspensions and emulsions, through to sprays and aerosols, industrial bulk powders and high concentration slurries.
Used at all stages of research, development and manufacturing, Malvern Panalytical’s materials characterization instruments provide critical information that helps accelerate research and product development, enhance and maintain product quality and optimize process efficiency.
Sponsored Content Policy: News-Medical.net publishes articles and related content that may be derived from sources where we have existing commercial relationships, provided such content adds value to the core editorial ethos of News-Medical.Net which is to educate and inform site visitors interested in medical research, science, medical devices and treatments.