Over the last two decades, arginine has been widely used as a biopharmaceutical excipient and in protein refolding experiments. The additive is an effective aggregation suppressor, but has been shown to have little effect on the conformational stability of proteins [1].
Despite extensive research, the mechanism of aggregation-inhibition by arginine is not yet clear. Studies suggest that arginine binds to the surface of a protein and increases intermolecular repulsion, as the guanidinium group on the side-chain of arginine is positively charged at neutral pH.
Most of the studies performed on the influence of arginine on protein stability have involved the use of spectroscopic techniques to investigate the bulk properties of the sample. However, light scattering techniques such as static light scattering (SLS) and dynamic light scattering (DLS) can detect the formation of trace amounts of oligomer, enabling elucidation of the earliest stages of the aggregation process.
This article discusses the characterization of a model protein (lysozyme) in the presence and absence of arginine with a range of techniques offered by the Zetasizer Nano ZSP. The temperature at which the lysozyme begins to aggregate is assessed using SLS, with temperature control provided by the peltier elements of the instrument.
Using DLS, different particle sizes in the two formulations are assessed at different temperatures, whereas zeta potential measurements are used to evaluate the effect of arginine on the charge state of the protein.
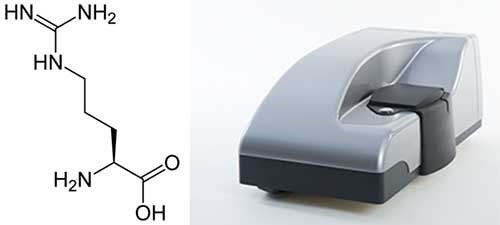
Figure 1. Left: The structure of arginine; Right: The Zetasizer Nano ZSP.
Experiment
This experiment involved heating samples from 20°C to 90°C and acquiring measurements at temperature intervals of 0.5°C. A single DLS measurement consisting of 15 runs, each taking 10 seconds, was carried out at each temperature, following an equilibration period of 30 seconds.
Samples were held at each temperature and, therefore, for 3 minutes in total. These thermal profile experiments were performed in triplicate for each of the two formulations, allowing the repeatability of the DLS measurements and the temperature ramp to be evaluated.
The diffusion barrier method [2,3] was used to measure electrophoretic mobility at 25°C with a disposable folded capillary cell to reduce the potentially denaturing effect of contact between the cell electrodes and the sample. The Zetasizer was set up in such a way that the optimum voltage and attenuation level were automatically selected for the electrophoretic mobility measurements.
One sample comprised of 2mg/mL lysozyme in a 10mM phosphate buffer at pH 7, while the other sample comprised of 2mg/mL lysozyme in a 10mM phosphate buffer containing 50mM arginine at pH 7. A filter with a pore size of 20nm was used with both samples immediately after preparation.
Results
The results of SLS monitored thermal profile experiments are shown in Figure 2, revealing that lysozyme tends to aggregate in the absence of arginine at a lower temperature than it does when arginine is present.
Between 25°C and 50°C, the mean count rate averages 123 kilo counts per second (kcps) for lysozyme in the absence of arginine and 121kcps for lysozyme in the presence of arginine. This value increases beyond 250kcps at 69.5°C ± 0.0°C in the absence of arginine and at 71.5°C ± 0.0°C in the presence of the additive.
Beyond 70°C, the presence of arginine severely inhibits the rise in light scattering intensity, which is a measure of a sample’s average particle size, with temperature. Therefore, the results shown in Figure 2 indicate that arginine suppresses the aggregation of lysozyme.
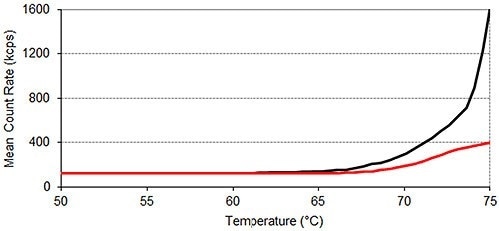
Figure 2. Static light scattering thermal profiles of lysozyme in two different formulations. Each thermal profile performed in triplicate; Black: lysozyme in pH 7.0 10mM phosphate buffer; Red: lysozyme in pH 7.0 10mM phosphate buffer containing 50mM arginine.
Figure 3 presents the intensity-based size distributions in the two samples produced by DLS measurements at three different temperatures during the thermal profile runs depicted in Figure 2. At 25°C, the intensity size distributions of both samples indicate the presence of monomeric lysozyme with 4nm hydrodynamic diameter, no aggregates being detected.
In the absence of arginine, the intensity size distributions of lysozyme become dominated by aggregates with hydrodynamic diameters of 100-200nm when the temperature increases to 71.0°C, but the size distributions for lysozyme are contributed to equally by lysozyme monomers and aggregates in the presence of arginine. This agrees well with arginine being able to suppress the onset of aggregation in protein formulations.
When the temperature is increased to 76.5°C, larger aggregates with a hydrodynamic diameter of 300 - 700nm are formed in the absence of arginine, while the largest particles detected in the presence of arginine are < 300nm hydrodynamic diameter.
Also, a lysozyme aggregation peak with ~20nm hydrodynamic diameter is also detected at 76.5°C in the formulation consisting of arginine. In the absence of arginine, an aggregate of this size is not identified at any point during the aggregation process of lysozyme.
When the temperature increases to 84.0°C, aggregates in the formulation continue to grow in the absence of arginine and particles with > 600nm hydrodynamic diameter are the only species present in the intensity analysis at this point.
However, the maximum aggregate size in the presence of arginine is < 500nm and the aggregates exhibit very little growth in hydrodynamic diameter between 71°C and 84°C. The contribution of the 20nm peak (first detected at 76.5°C) to the intensity size distribution, corresponding to that of the larger peak, decreases when the temperature increases 76.5 to 84.0°C.
This data suggests that 20nm diameter oligomers tend to aggregate over this range. Therefore, it is evident that the presence of arginine in formulation buffers affects the mechanism of aggregation.
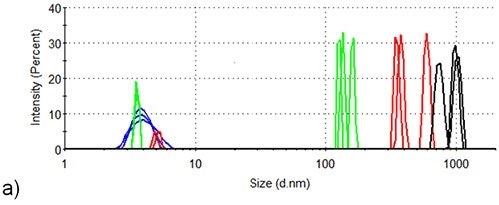
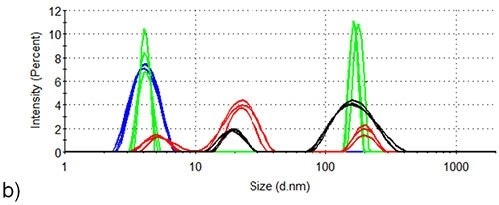
Figure 3. DLS of lysozyme at three different temperature points in the SLS thermal profile. Blue: room temperature; Green: 71.5°C; Red: 76.5°C; Black: 84.0°C. (a) Lysozyme in pH 7.0 10mM phosphate buffer (b) Lysozyme in pH 7.0 10mM phosphate buffer containing 50mM arginine.
The volume size distributions of lysozyme in the presence and absence of arginine at 84.0°C are shown in Figure 4. The distributions are calculated from the corresponding intensity distributions (Figure 3). The statistical description of these volume size distributions are displayed in Table 1.
In the absence of arginine, the hydrodynamic diameter of the particles that make a measurable contribution to the protein-occupied volume of the sample is more than 600nm. Particles of 10-30nm represent the majority of the protein-occupied volume in the presence of arginine, with larger particles of 90 - 200nm diameter occupying a volume < 1/40 of that occupied by the smaller aggregates.
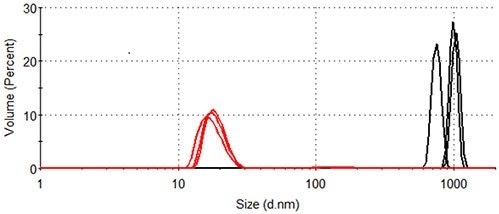
Figure 4. Size distribution by volume of lysozyme at 84.0°C. Black: lysozyme in pH 7.0 10mM phosphate buffer; Red: lysozyme in pH 7.0 10mM phosphate buffer containing 50mM arginine.
Table 1. Statistics generated from the size distribution by volume of lysozyme at 84.0°C (see Figure 4).
|
Formulation
|
Hydrodynamic Diameter (nm)
|
% Contribution to Volume Distribution
|
|
Lysozyme in pH 7.0 10mM phosphate buffer
|
924 ± 153
|
100
|
|
Lysozyme in pH 7.0 10mM phosphate buffer containing 50mM arginine
|
18.1 ± 0.8
|
97.9 ± 0.4
|
|
161 ± 6
|
2.1 ± 0.4
|
The zeta potential of native lysozyme was measured in the absence and presence of arginine to evaluate the hypothesis that the influence of arginine on protein aggregation is because of binding of the amino acid to the protein, causing increased intermolecular repulsion.
Table 2 shows the data from electrophoretic light scattering (ELS) measurements. The zeta potential of native lysozyme is lowered by arginine at 25°C. Such charge-screening by arginine is expected to lower intermolecular repulsion, rather than increase it.
Therefore, the data given in Table 2 suggests that the inhibition of aggregation by arginine is not attributed to its effect on the native protein. This information would support the alternative hypothesis that binding of arginine to the hydrophobic areas of protein that are exposed upon denaturation provides a charged protectant of these aggregation hotspots [4,5].
Table 2. Electrophoretic light scattering of lysozyme at 25°C in two different formulations.
|
Formulation
|
Zeta Potential (mV)
|
|
Lysozyme in phosphate buffer
|
7.0 ± 0.1
|
|
Lysozyme in phosphate buffer containing 50mM arginine
|
4.6 ± 0.5
|
Conclusion
The Zetasizer Nano ZSP can be used to perform the orthogonal analysis of protein aggregation in a rapid and simple manner. The instrument’s sensitivity to trace amounts of aggregate enables the characterization of the early stages of aggregation.
SLS was used to show that the presence of arginine raises the onset temperature of lysozyme aggregation by 2°C, confirming the ability of the additive to inhibit the earliest stages of aggregation.
DLS was used to demonstrate that arginine not only suppresses the onset of aggregation, but also affects the pathway via which aggregation proceeds. In the absence of arginine, lysozyme forms aggregates with increasing hydrodynamic diameter when the temperature rises.
Particles of approximately 1μm are formed by the time the temperature has increased to 84.0°C. Aggregates remain < 500nm across the thermal profile when arginine is present, with a slower lysozyme aggregation process that allows the formation of aggregates with hydrodynamic diameters of 10 – 30nm also detected.
Volume distribution analysis revealed that when arginine is present, the smaller aggregates represent a much larger proportion of the total protein volume compared to the larger aggregates, even at 84.0°C. This data is vital to developers of biopharmaceuticals (arginine is often added to bioformulations) considering the effect of aggregate size and concentration have on the immunogenic potential of protein-based drug products [6].
References
- Arakawa, T. and Tsumoto, K. (2003) The effects of arginine on refolding of aggregated proteins: not facilitate refolding, but suppress aggregation. Biochemical and Biophysical Research Communications 304, 148-152.
- The Diffusion Barrier Technique for Accurate and Reproducible Protein Mobility Measurement. Malvern Panalytical Application Note
- Improving Protein Zeta Potential Measurements Using a Novel Diffusion Barrier Technique. Malvern Panalytical Application Note
- Shiraki, K., Kudou, M., Nishikori, S., Kitagawa, H., Imanaka, T., Takagi, M. (2004) Arginine ethylester prevents thermal inactivation and aggregation of lysozyme. European Journal of Biochemistry 271, 3242-3247.
- Hamada, H., Arakawa, T., Shiraki, K. (2009) Effect of Additives on Protein Aggregation. Current Pharmaceutical Biotechnology 10, 400-407.
- U.S. Food and Drug Administration, Center for Drug Evaluation and Research, Center for Biologics Evaluation and Research (2013). Guidance for Industry: Immunogenicity Assessment For Therapeutic Protein Products. FDA Draft Guidance. http://www.fda.gov/downloads/Drugs/GuidanceComplianceRegulatoryInformation/Guidances/UCM338856.pdf
About Malvern Panalytical

Malvern Panalytical provides the materials and biophysical characterization technology and expertise that enable scientists and engineers to understand and control the properties of dispersed systems.
These systems range from proteins and polymers in solution, particle and nanoparticle suspensions and emulsions, through to sprays and aerosols, industrial bulk powders and high concentration slurries.
Used at all stages of research, development and manufacturing, Malvern Panalytical’s materials characterization instruments provide critical information that helps accelerate research and product development, enhance and maintain product quality and optimize process efficiency.
Sponsored Content Policy: News-Medical.net publishes articles and related content that may be derived from sources where we have existing commercial relationships, provided such content adds value to the core editorial ethos of News-Medical.Net which is to educate and inform site visitors interested in medical research, science, medical devices and treatments.