Molecular imaging is an imaging technique that provides detailed pictures of what is happening within the body at the molecular and cellular level. Compared to ex vivo, cross-sectional methods such as H&E staining or immunohistochemistry, molecular imaging provides a number of advantages, owing to the non-destructive nature of in vivo fluorescence imaging.
It is possible to perform repeated experiments on a specific tissue or animal sample by preserving the target’s native environment. Using a red fluorescent protein (RFP), green fluorescent protein (GFP), or other suitable reporter, molecular imaging is capable of localizing a biological phenomenon to a specific location and monitoring the process over time.
By using a genetic reporter such as fluorescent proteins to target a gene or a fluorophore conjugate to target downstream expression, in vivo fluorescence imaging can provide molecular, functional and anatomical data.
Molecular Imaging
Molecular imaging can be used in a wide range of applications across many therapy areas. One major application in cancer biology is the monitoring of tumor lesions implanted in mice. Tracking the growth of a tumor over time is valuable in terms of observing how effective chemotherapeutic agents are at stabilizing or shrinking tumors.
In a recent experiment, fluorescent protein-expressing cancer cells were implanted in mice and imaged weekly using the Analytik-Jena iBox Scientia imaging system. Using this system, tumor lesions can be monitored and quantified with a high quantum efficiency camera, a powerful excitation light source, quality lenses and interchangeable filter sets to image fluorescence across a broad spectral range, from 450nm to near infrared (NIR).
Materials and Methods
For the experiment, 3x10⁶ human colon HCT-116 double-color cancer cells were injected directly into the peritoneal cavity of four adult nude female mice. Once the transplanted tumor lesions reached a diameter of 1mm, the mice were tracked and GFP and RFP fluorescence images were recorded on a weekly basis for a total of six weeks to monitor growth of the tumor cells.
The tumor growth within the mice was imaged using the GFP and RFP multiplex two color channels. Using Analytik-Jena’s 150W halogen BioLite™ MultiSpectral Light Source and color-specific excitation filters, all the samples were excited.
A blue excitation filter with a peak wavelength of 475nm and a band pass of 40nm (475/40) was used to excite GFP and a green excitation filter (525/45) excited RFP. An emission filter with a bandpass of 44nm (535/44) and a peak wavelength of 535nm was used to select for green fluorescence. The 605/50 filter was used by the red channel. All images were captured by Analytik-Jena’s BioChemi 500, a 4.2 MP cooled monochrome CCD camera.
The multiplex images captured were then composited using Analytik-Jena’s VisionWorks®LS software. Histogram adjustments were made to remove background fluorescence and monochrome images were pseudocolored in line with the emission specifications (GFP/RFP).
The multiplexed monochrome images were used to obtain area density measurements. The size of the tumor was established using the square of the pixel density for each tumor lesion at a given time interval, as shown in Figure 1.
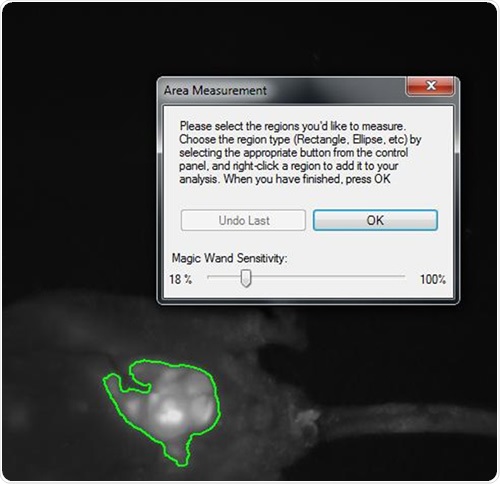
Figure 1. Snapshot of area density measurement of tumor mass within the abdomen of a nude mouse implanted with HCT-116 human colon cancer cells. The highlighted area is a luminescent lesion composed of GFP and RFP-expressing cells roughly 1cm in diameter. VisionWorksLS software automatically selects for the brightest region and, with calibration, can yield quantitative information regarding light density.
Results and Discussion
The development of one tumor lesion over the span of a few weeks is illustrated in Figure 2. In the final image, metastasizing lesions are seen emerging in the peritoneum. This is indicated by smaller regions of fluorescence.
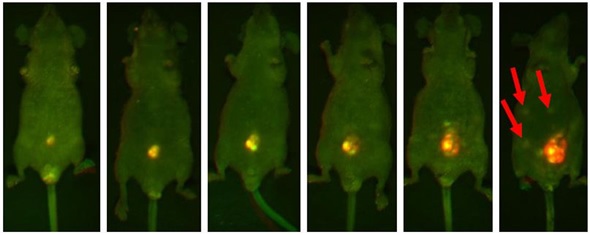
Figure 2. Representative mouse highlighting the progressive increasing luminosity of an implanted lesion in the peritoneum. Each image was captured using both GFP and RFP filters and then multiplexed. The intense fluorescent signal shown in the implanted tumor is significantly brighter than the surrounding tissue. Note the formation of metastatic lesions beginning to develop distal to the site of implantation and becoming visible within the abdomen in the final slide (red arrows).
Figure 3 shows the pooled data for tumor measurements. Monitoring the lesions over time reveals a linear increase in tumor burden, with an average maximum area density of 7.4 X 103 pixels squared.
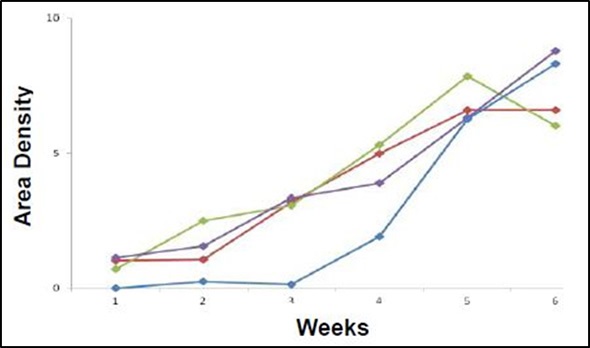
Figure 3. Graphical representation of area density of tumor lesions over time of the implanted mouse population. All four mice show increase in tumor burden over time (weeks along the x-axis) as measured by light density (pixels squared X 103 along the y-axis). Each point represents a single lesion measurement or pooled area density of multiple lesions.
Conclusion
In the above study, HCT-116 human colon cancer cells were implanted inside the peritoneal cavity of four adult nude female mice and monitored over time. The tumor growth showed a linear increase in area density in all four mice and ultimately reached a peak at six weeks. The area density function of Analytik-Jena’s VisionWorksLS software was used to measure this steady growth increase, which strongly correlates with volume.
The non-destructive nature of in vivo fluorescence imaging for non-invasively monitoring functional or molecular changes offers benefits over other cross-sectional techniques such as immunohistochemistry. A disease process can be monitored simply by tagging a downstream molecule with a fluorophore conjugate or by transfecting an organism or cell with a fluorescent protein, and then capturing the changes that occur in real-time.
The iBox Scientia In Vivo Imaging System is designed to image fluorescence-labeled cells by maximizing the signal-to-noise ratio through the use of a high resolution cooled CCD camera, highly sensitive optics, a wide range of emission and excitation filters and a directed illumination source.
With the breadth of fluorescent proteins and fluorophores that are available, the iBox Scientia Imaging System can be applied across a wide variety of pre-clinical in vivo research applications such as immunology, cancer biology and cardiovascular disease.
References
1. J. of Surgical Research, Vol. 113, No. 1, July 2003
About Analytik Jena US
 Analytik Jena is a provider of instruments and products in the areas of analytical measuring technology and life science. Its portfolio includes the most modern analytical technology and complete systems for bioanalytical applications in the life science area.
Comprehensive laboratory software management and information systems (LIMS), service offerings, as well as device-specific consumables and disposables, such as reagents or plastic articles, complete the Group’s extensive range of products.
About Life Science
The Life Science product area demonstrates the biotechnological competence of Analytik Jena AG. We provide a wide product spectrum for automated total, as well as individual solutions for molecular diagnostics. Our products are focused to offer you a quality and the reproducibility of your laboratory results.
This will surely ease your daily work and speed up your work processes in a certain way.
All together we support you through the complete process of the lab work. Besides we offer customized solutions and are able to adapt our products to your needs. Automated high-throughput screening systems for the pharmaceutical sector are also part of this segment’s extensive portfolio.
About Analytical Instrumentation
Analytik Jena has a long tradition in developing high-performance precision analytical systems which dates back to the inventions made by Ernst Abbe and Carl Zeiss. We have grown to become one of the most innovative manufacturers of analytical measuring technology worldwide.
Our business unit Analytical Instrumentation offers excellent competencies in the fields of optical spectroscopy, sum parameters and elemental analysis. Being proud of our core competency we grant all our customers a long-term warranty of 10 years for our high-performance optics.
About Lab Automation
With more than 25 years of market experience, Analytik Jena with its CyBio® Product Line is a leading provider for high quality liquid handling and automation technologies. In the pharmaceutical and life science industries, our products enjoy the highest reputation for precision, reliability, robustness and simplicity.
Moreover, the Automation Team designs, produces and installs fully automated systems tailored to our clients' application, throughput and capacity requirements. From stand-alone CyBio® Well up to fully customized robotic systems we handle your compounds, biomolecules and cells with great care.
Sponsored Content Policy: News-Medical.net publishes articles and related content that may be derived from sources where we have existing commercial relationships, provided such content adds value to the core editorial ethos of News-Medical.Net which is to educate and inform site visitors interested in medical research, science, medical devices and treatments.