Sponsored Content by SartoriusReviewed by Alex SmithJun 30 2022
The main objective of the study outlined below was to determine if continuous sampling (and multisampling point assay) offers effective monitoring for the complete production process (8 hours) by establishing whether trapped organisms can endure long-term drying stress with unaltered recovery.
This study analyzed the recovery and feasibility of microorganisms captured on gelatin filters during 8 hours of filtration with HEPA-filtered air from a laminar flow hood, utilizing the MD8 Airscan® system. Stressed and unstressed filters were contrasted with parallel-run reference filters as controls.
The CFU were counted and the genus of the identified microorganism populations was established to assess if any changes occurred in microbiological flora during continuous long-term sampling. In contrast to the unstressed reference filters, no changes were noted in neither total recovery nor recovered bacterial diversity.
No statistically meaningful differences in CFU/m3 were discovered between test filters and reference filters, and no considerable differences in the microbiological flora between test filters and reference filters.
CFU populations were comparable: 8 hours of continuous air sampling on gelatin filters with the MD8 Airscan® system did not influence total recovery or impact the diverse range of recovered microorganisms when test filters and reference filters were compared.
Observing microbiological contamination of air in production areas is crucial because the aseptic filling is the step in the manufacturing process of the pharmaceutical industry that harbors one of the greatest risks for contamination.2
Aseptic filling lines are being deployed on an increased basis throughout the pharmaceutical industry because an increasing amount of biotechnology products cannot be sterilized after production without the sterilization process having some sort of impact on their quality.
Filling lines are determined by ISO 51, and air actively sampled in these environments must comply by having less than one colony-forming unit per cubic meter (CFU/m3), with a minimum sample volume of one m3 of air taken per sample location, in line with Annex 1 to the EU GMP guide.
Taking an 8-hour work shift into account, one m3 may be too low a sample volume to judge the overall air quality of the manufacturing environment reliably.
Thus, developing a constant production monitoring tool to mitigate the risk of contamination and enhance the standard of quality control is necessary. A method is required that consistently surveys all cycles of the production process and facilitates sampling at multiple points.
To establish if continuous air sampling using gelatin membranes can monitor the entire production process effectively over an eight-hour shift, the feasibility of microorganisms on gelatin filters throughout the sterile air long-term filtration process, i.e., whether trapped organisms can endure long-term drying stress and yield unaltered recovery, was evaluated.
Previous studies and tests had demonstrated that gelatin filters with an inlet velocity of 0.25 m/second had a mean retention rate of around 99.9995% for Bacillus subtilis varniger spores and 99.94% for T3 coliphages.5
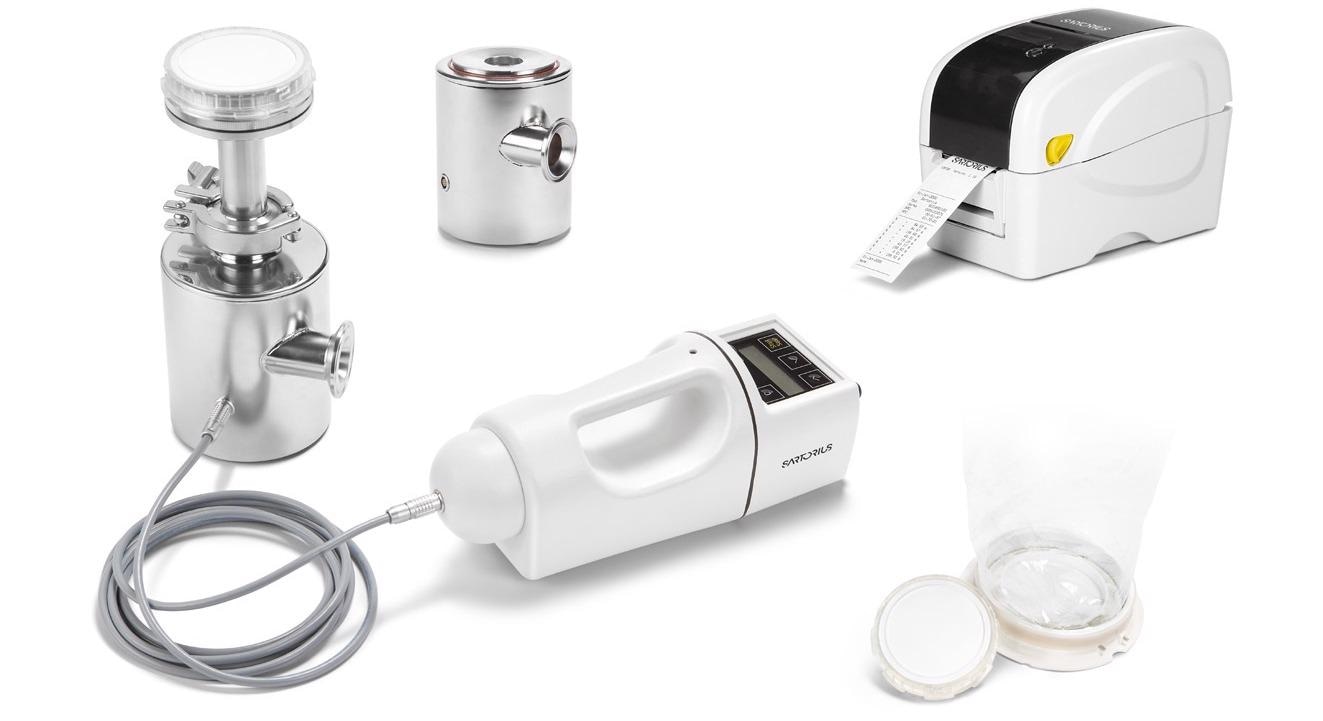
Image Credit: Sartorius
Methods and materials
The study evaluated whether the feasibility of microorganisms on gelatin filters was preserved throughout the long-term filtration of filtered air. The term “filtered air” is relative to the ISO 5 HEPA-filtered air of the used Class 2 biological safety cabinet. Test and reference gelatin filters were initially exposed to nonsterile air for around 30 minutes.
The MD8 Airscan® air samplers (set at an airflow rate of 2.0 m3/hour (0,144 m/second)) were placed in a non-controlled laboratory environment (autoclave room) at an approximate distance of 30–40 cm apart from each other.
This sampling location was selected to build up unique environmental conditions. There, a greater relative humidity (~ 57 ± 6% and temperature: ~ 21 ± 1 °C) was anticipated, meaning a greater deal of drying stress-sensitive, waterborne microorganisms (e.g., gram-, generating a “worst-case” scenario).
Furthermore, a typical greater content of airborne microorganisms was expected per cubic meter than in the “normal” laboratory. It was thus speculated because of this that the subsequent 8 hours of drying stress would clearly show a visible and statistically detectable effect.
Following this, the test filters were applied to sample filtered air for an additional 8-hour period.
For the filtration of ISO 5 graded air, the MD8 Airscan® sampling heads were fixed beneath a laminar flow hood (relative humidity: ~ 43 ± 3% and temperature: ~ 23 ± 1 °C). Therefore, there was no additional high relative humidity during the 8-hour stressing.
The reference filters were exposed to only 30 minutes of filtration of non-sterile air without additional aeration.
They were positioned on soybean-casein-digest agar medium directly once sampling was complete. At the end of the 8-hour filtration period beneath the laminar flow hood, the test filters were also placed on soybean-casein-digest agar medium plates and incubated for four days at around 32 oC.
The cultured colonies that developed were counted and recorded as CFU/m3 26 times. Then, for the test and reference filters, the CFU/m3 were compared. In addition, the genus of each colony was established to find out if any variations in microbiological flora had occurred during continuous long-term sampling.
Results
Figure 1 exhibits an average CFU/m3 on test (gold bar, mean = 69 colonies, sd = 51 colonies) and reference filters (grey bar, mean = 64 colonies, sd = 32 colonies). A mean difference of 5 CFU/m3 (not statistically meaningful according to the paired T-test) was discovered, but no general trend was seen upon the comparison of test and reference filters (see Figure 2).
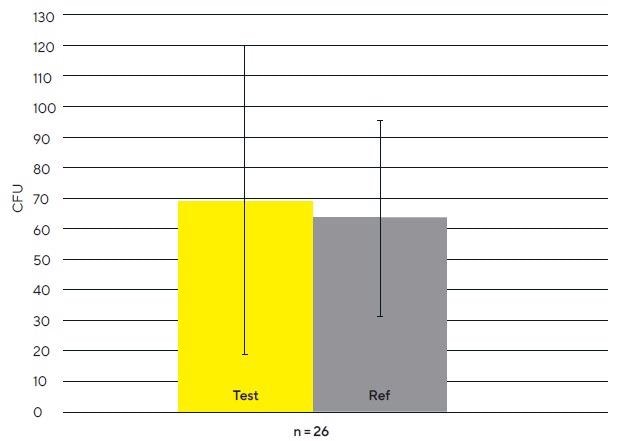
Figure 1. Comparison of mean CFU on test and reference gelatin filters. Image Credit: Sartorius
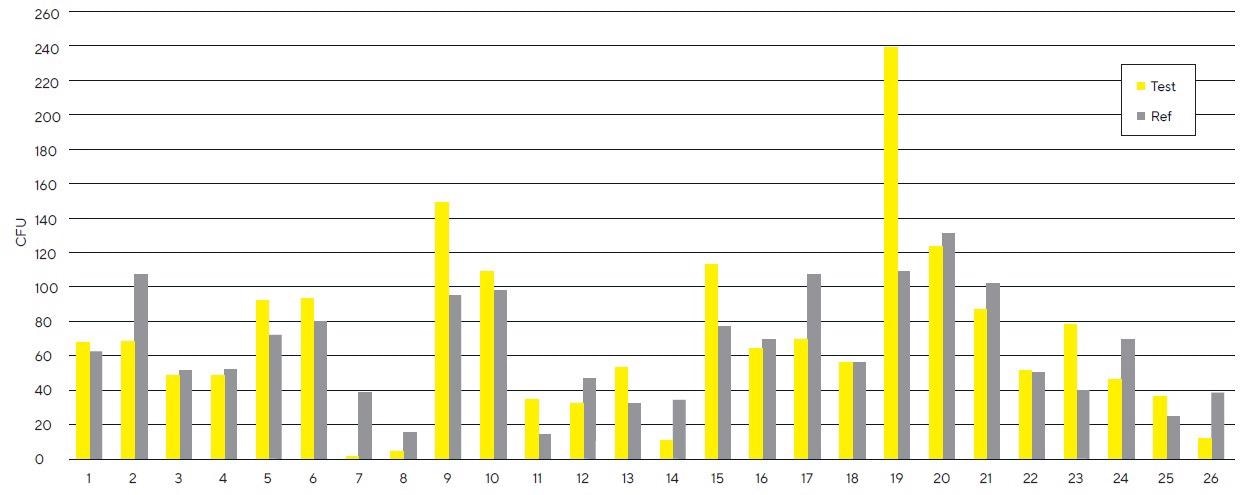
Figure 2. Comparison of CFU on the paired test and reference gelatin filters. Image Credit: Sartorius
Across 12 cases, more CFU/m3 were present on test filters than on reference filters, but the opposite was determined in 13 cases (see Figure 2).
The conventional deviation in test and reference filters can be associated with the general fluctuation of microorganisms naturally present in the ambient air of non-controlled environments. No statistically meaningful difference in the growth of microorganisms on test versus reference filters was noted.
Figures 3 and 4 represent a soybean-casein-digest agar medium plate with microbiological flora grown on the paired test (left) and reference filters (right). This visual impression shows that similar comparisons can be made between the microbiological population found on the test and reference filters.
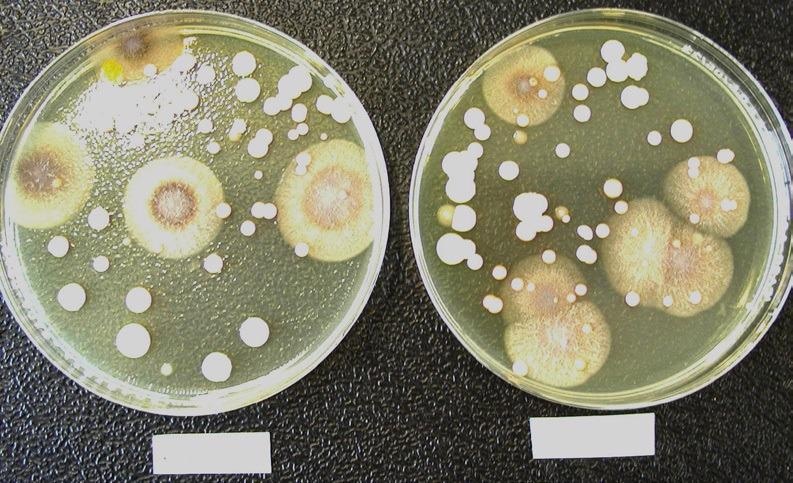
Figure 3. Comparison of the microbiological flora grown on a test filter (left) and its corresponding reference filter (right). The composition of the microbiological population found on the test and reference filters is comparable. Representative soybean-casein-digest agar medium plates showing the microbiological flora grown on a test filter (left) and its corresponding reference filter (right). Image Credit: Sartorius
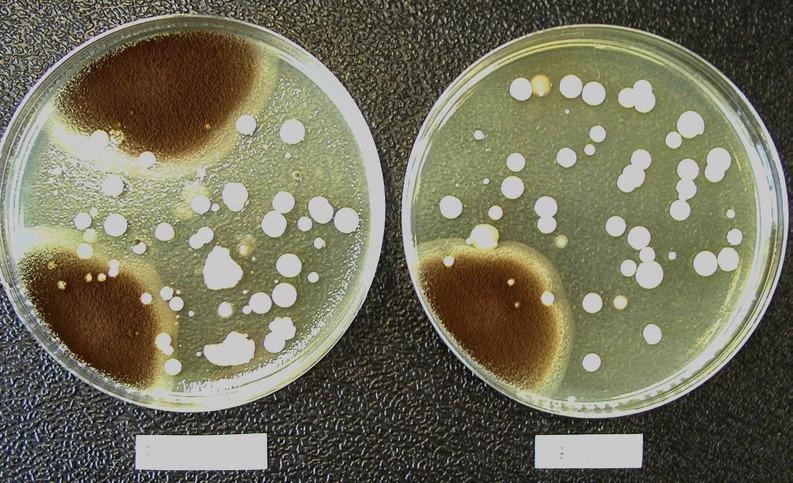
Figure 4. Comparison of the microbiological flora grown on a test filter (left) and its corresponding reference filter (right). The composition of the microbiological population found on the test and reference filters is comparable. Representative soybean-casein-digest agar medium plates showing the microbiological flora grown on a test filter (left) and its corresponding reference filter (right). Image Credit: Sartorius
The genus identification data from a macroscopic comparison of the microbiological flora displayed in Figures 5A and 5B supports the visual impression that the microbiological population on the test and reference filters correspond.
No significant statistical differences in average CFU/m3 levels between test and reference gelatin filters were noted. The gold bar indicates a mean CFU/m3 of 69 colonies, with a basic deviation (sd) of 51 colonies for the test filters (counted 26 separate times).
The grey bar exhibits an average CFU/m3 of 64 colonies, with an sd of 51 colonies for the reference filters (counted 26 separate times). The average difference of 5 CFU/m3 between test and reference gelatin filters was not statistically meaningful.
There was no general trend of CFU/m3 when comparing test and reference filters. The gold bar displays CFU/m3 for 26 replicates of the test filters, and the grey bar is representative of CFU/m3 for the reference filters.
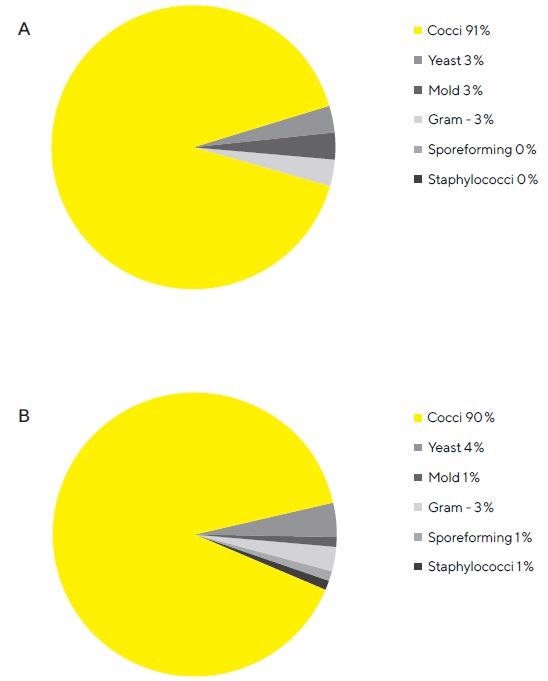
Figure 5. A. Composition of the microbiological population grown on the test gelatin filters. Almost all microbes grown on test filters is Cocci. This figure shows a breakdown of microbes grown on soybean-caseindigest agar medium plates from test filters. B. Composition of the microbiological population grown on the reference gelatin filters. Almost all microbes grown on reference filters are Cocci. This figure shows a breakdown of microbes grown on soybean-casein-digest agar medium plates from reference filters. Image Credit: Sartorius
Conclusion
The aim of this study was to assess if gelatin filters produced by Sartorius Stedim Biotech GmbH are feasible for long-term (eight hours [8 hours]) air sampling in manufacturing conditions in the pharmaceutical industry.
Specifically, if microorganisms captured on gelatin membranes are able to survive long-term filtration with filtered air. The 8-hour filtration period represents a standard work shift on an aseptic filling line.
The study’s focus was aimed on determining whether long-term air filtration reduced the number of CFU/m3 on filters. Therefore, a non-sterile air sampling on test filters for 30 minutes, followed by a filtration of ISO 5 graded air for 8 hours.
The experiment offered no statistically meaningful differences between test (stressed) and reference (unstressed) filters.
The test filters contained the same number of CFU/m3 as the reference filters (i.e., no microorganisms died during long-term filtration). The normal variations in test and reference filters could be correlated with the broad variations of microorganisms occurring naturally in the ambient air of non-controlled environments.
Moreover, no major difference between the bacterial flora cultivated on the test and reference filters in either macroscopic or visual comparison could be determined. Even gram-negative bacteria were found on test filters, and there was no major statistical difference between stressed and unstressed gelatin filters.
In conclusion, this study demonstrates that there is no major statistical difference between stressed and unstressed gelatin filters, thus demonstrating that gelatin membranes manufactured by Sartorius Stedim Biotech GmbH are appropriate for unremitting air monitoring in industrial, pharmaceutical production environments spanning a whole 8 hour work shift without needing human intervention.
References
- (Draft of the Revision of) Annex 1 of the EU Guidelines to Good Manufacturing Practice, November 2008 (December 2017)
- USP, Chapter 1116 – Microbiological Evaluation of Cleanrooms
- C. Scherwing, F. Golin, O. Guenec, K. Pflanz, G. Dalmaso, M. Bini, F. Andone, Continuous microbiological air monitoring for aseptic filling lines, PDA J Pharm Sci Technol, March|April 2007 61: 102–109
- CAMR Report 1993 “An assessment of the Sartorius MD-8 Microbial Air Sampler”
About Sartorius

Sartorius is a leading international pharmaceutical and laboratory equipment supplier. With our innovative products and services, we are helping our customers across the entire globe to implement their complex and quality-critical biomanufacturing and laboratory processes reliably and economically.
The Group companies are united under the roof of Sartorius AG, which is listed on the Frankfurt Stock Exchange and holds the majority stake in Sartorius Stedim Biotech S.A. Quoted on the Paris Stock Exchange, this subgroup is comprised mainly of the Bioprocess Solutions Division.
Innovative technologies enable medical progress
A growing number of medications are biopharmaceuticals. These are produced using living cells in complex, lengthy and expensive procedures. The Bioprocess Solutions Division provides the essential products and technologies to accomplish this.
In fact, Sartorius has been pioneering and setting the standards for single-use products that are currently used throughout all biopharmaceutical manufacturing processes.
Making lab life easier
Lab work is complex and demanding: Despite repetitive analytical routines, lab staff must perform each step in a highly concentrated and careful way for accurate results.
The Lab Products and Services Division helps lab personnel excel because its products, such as laboratory balances, pipettes and lab consumables, minimize human error, simplify workflows and reduce physical workloads.
Sponsored Content Policy: News-Medical.net publishes articles and related content that may be derived from sources where we have existing commercial relationships, provided such content adds value to the core editorial ethos of News-Medical.Net which is to educate and inform site visitors interested in medical research, science, medical devices and treatments.