Sponsored Content by SartoriusReviewed by Alex SmithFeb 20 2023
Immunologists typically employ several in vitro techniques to analyze immune system cells, including flow cytometry, polymerase chain reaction (PCR) tests, and various enzyme-linked immunosorbent assays (ELISA), such as ELISPOT.
These approaches enable immuno-phenotyping, allowing for the measurement of different cell populations at the molecular and functional level, as well as the quantification of immune responses such as cytokine release.
Despite their power, these methods offer limited insight into cell morphology and spatial interactions and are less effective at monitoring biological changes over time due to their "end-point" nature.
Live-cell analysis has emerged as a promising research method for immunologists in recent years, providing a means of overcoming these limitations. To illustrate this approach's broad, deep, and valuable applications, this review will examine 10 functional bio-assay applications.
What is live-cell analysis?
The technique of live-cell analysis involves the real-time quantification of living cells' behavior using time-lapse imaging, spanning from hours to weeks. This method comprises:
- Acquisition of images repeatedly from the same cells over time
- Maintenance of the cells in a stable physiological environment that is unperturbed throughout the experiment
- Image analysis and data visualization on the fly to provide a real-time view of dynamic changes in biology (Figure 1)
Specialized live-cell analysis systems, such as Sartorius' Incucyte® Live-Cell Analysis Systems, have been developed to automatically gather, analyze, and present time-course data and images from over 2000 simultaneous experiments (e.g. 6 x 384-well micro-plates).
The system is located within a standard cell incubator. It uniquely moves the optical path (as opposed to the cell plate) to capture high-quality images of non-adherent cells without disrupting them.
This "integrated solution" comprises a suite of optimized live-cell reagents, protocols, and software modules, making live-cell analysis accessible and straightforward for researchers.
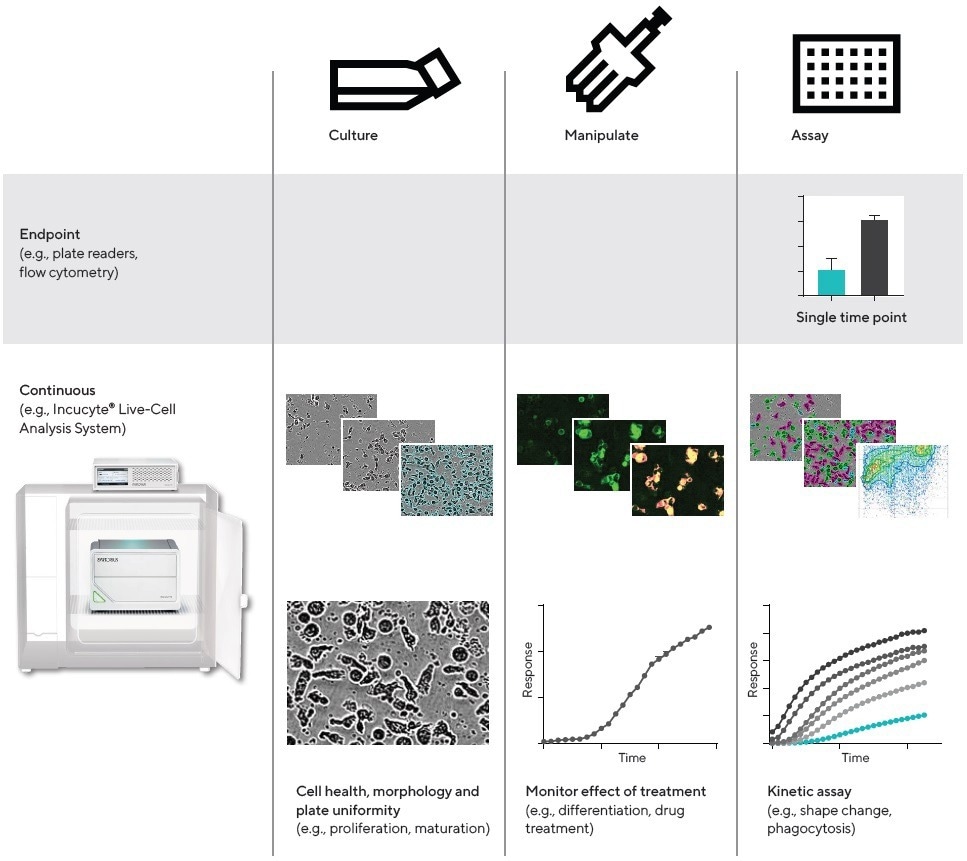
Figure 1. Workflow, QC and cell health. Comparison of continuous live-cell analysis and endpoint workflows. For live-cell analysis, images and data are collected in real time from within the cell incubator, throughout the culture, manipulation, and kinetic assay phases. Image Credit: Sartorius
Applications in immunology
Live-cell analysis is a versatile technique that can be applied to both the general biology of immune cells, including cell proliferation, activation, differentiation, surface protein dynamics, and cellular health, as well as more specialized functions, such as immune cell killing (cytolysis), phagocytosis, NETosis, and chemotaxis.
This approach is suitable for all immune cells, including T cells, B cells, macrophages, neutrophils, and dendritic cells. It can be utilized in monocultures, co-cultures, and advanced 3D cell models.
1. Proliferation and counting
Live-cell analysis offers several non-invasive ways to enumerate immune cells. One method involves using area measurements, which can serve as a good proxy for cell number (% confluence of phase contrast images) up to 80% confluence (Figure 2).
This metric correlates well with direct cell counting (e.g. Sceptre, Millipore) and ATP luminescence measurements. However, the correlation may weaken in densely packed cultures or if individual cell areas change over time.
Alternatively, fluorescent labels can be employed, such as nuclear-targeted fluorescent proteins (e.g., Incucyte® Nuclight Lentivirus) or non-perturbing dyes (e.g. Incucyte® Cytolight Rapid Dye).
Nuclear counting is an accurate method of determining cell numbers even in densely packed cultures, while fluorescent labels can identify different cell types in co-cultures. A new label-free cell counting method is available using image segmentation tools (Incucyte® Cell-by-Cell Analysis).
This provides metrics such as size and eccentricity for all cells in the field of view, similar to dot plot tools in flow cytometry.
This powerful technique offers accurate cell counts and provides a deeper understanding of the distribution of single-cell parameters in the population.
Regardless of the method employed, the assays generate full-time course data and valuable morphological insights and can be miniaturized to 96- and 384-well formats, providing sufficient throughput for industrial discovery purposes.
2. Identification and immuno-phenotyping
Flow cytometry commonly employs fluorescently-labeled antibodies (Abs) to CD-surface markers to identify and classify immune cells, a process known as "immuno-phenotyping." Based on the resulting profiles (e.g. CD4+, CD8+, etc.), at least 15 distinct subtypes of human T cells have been described.
It is possible to use live-cell analysis based on the same principle. The preferred approach is to conjugate an anti-CD Ab to an isotype-matched fluorescent Fc-targeting Fab fragment (such as Incucyte® Fabfluor-488 Dye) instead of directly labeled Abs.
This can be accomplished with a simple one-step mix protocol. To improve the 488 nM fluorescent signal window, a non-perturbing background fluorescence-suppressing dye is employed in the assay.
The Fabfluor-488 labeled Ab and suppressor are then directly added to the cells, and only cells that express the surface marker will fluoresce. Subsets of cells can be readily identified and quantified over time.
In the simplest immuno-phenotyping application, the percentage of marker-positive cells (e.g. CD4+, CD8+) can be determined, and morphological attributes can be linked to different subsets.
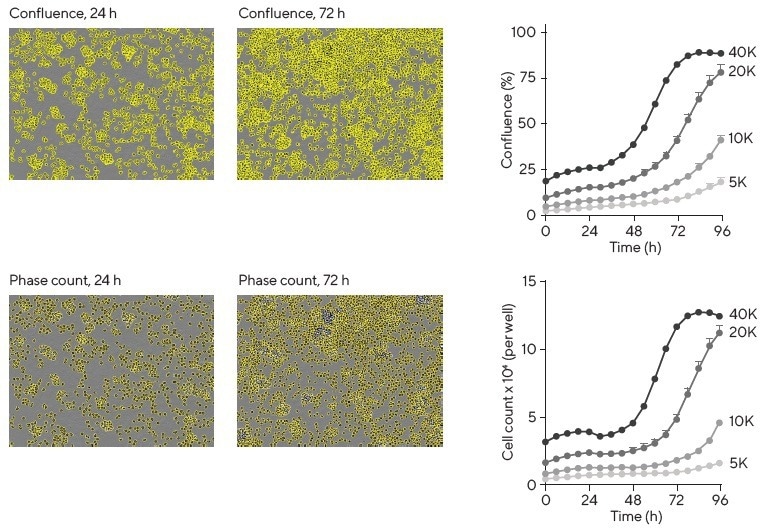
Figure 2. Assessment of cell proliferation. Images show Ramos B cells with either confluence phase masking or individual cell masking using Incucyte® Cell-by-Cell Analysis Software Module at 24 and 72 h post-platings. Analysis of images by either method enables the production of proliferation plots (right column) with similar growth profiles. Image Credit: Sartorius
Changes in the proportions of cells over time can be measured. Observing the interactions between cell subsets in the culture is of particular utility. For example, in a PBMC-based immune-cell killing assay, it is possible to visualize the physical interactions of CD8+ cytotoxic T cells with their tumor targets (Section 5).
3. Activation and differentiation
Receptor signaling pathways are crucial in expanding and priming immune cells for effector functions, resulting in differentiation and phenotypic changes. These complex and dynamic events are well-suited for study using live-cell analysis.
In a chemokine-induced activation assay using human neutrophils (Figure 3), cell-by-cell analysis techniques revealed time- and concentration-dependent changes in the area, shape (eccentricity), and surface expression of CD11b (integrin aM, part of the complement C3 receptor—quantified using a Fabfluor-488/Ab complex) in response to CXCL8.
An anti-CXCL8 antibody attenuated CXCL8-induced activation, and the time courses for changes in area, shape, and CD11b expression were similar (0-6 h). The EC50 values for the increase in eccentricity and CD11b expression were 0.63 nM and 0.22 nM, respectively.
Moreover, stimuli-induced differentiation of human THP-1 monocytes to macrophages was probed in another example. No changes in the ubiquitous cell surface marker CD45 were observed in both control (untreated) and stimulated THP-1 cells throughout the 3 d time course of the experiment.
THP-1 cells showed little expression of CD11b, CD14 (an endotoxin receptor), and CD40 (a co-stimulatory protein) for up to 72 hours under control conditions.
However, all three CD markers could be upregulated to different extents over 12-72 hours with specific differentiation agents, such as vitamin D3, IFNγ + mCSF, IFNγ + LPS, and Phorbol Myristate Acetate (PMA).
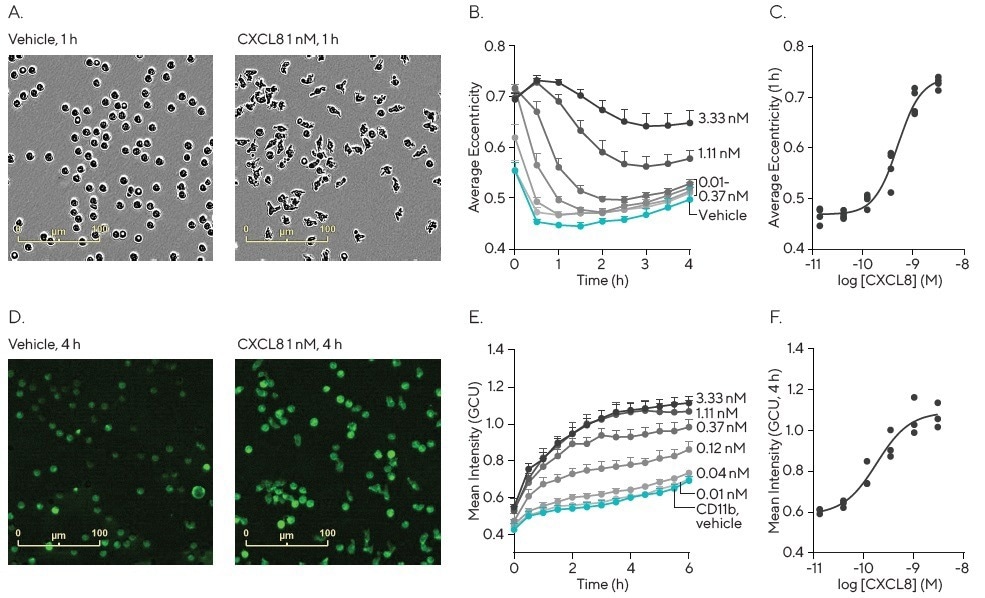
Figure 3. Quantification of neutrophil activation. Freshly isolated human neutrophils were seeded (40K/well) in Matrigel® (50 μg/mL) coated 96-well plates and treated with increasing concentrations of CXCL8 in the presence of Fabfluor-488 labeled CD11b antibody (1 μg/mL). Images were captured every 30 min (20X) and analyzed using Incucyte® Cell-by-Cell Analysis Software. Images (A and D) show the change in morphology and CD11b expression induced by CXCL8 (1 nM). Morphology was quantified as a change in eccentricity and CD11b expression as mean intensity. Data demonstrates a rapid, concentration dependent increase in eccentricity with CXCL8 with an EC50 of 0.63 nM (B and C), in combination with an increase in CD11b expression with and EC50 of 0.22 nM (E and F). Data shown as mean of at least 3 separate donors ± SEM. Image Credit: Sartorius
CD11b and CD40 were upregulated by PMA, whereas CD14 was unaffected. In contrast, CD11b and CD14 expression were time-dependently increased by vitamin D3 (Figure 4), but CD40 remained unchanged.
PMA induced marked changes in morphology, resulting in large, flattened, adherent cells with a macrophage-like appearance, which were the only cells capable of phagocytosing pHrodo®-labeled apoptotic Jurkat cells (Section 6), as observed from close inspection of the cell images.
These results demonstrate how a single method can associate temporal changes in surface protein markers, morphology, and function, and reveal characteristic response profiles to different differentiation stimuli.
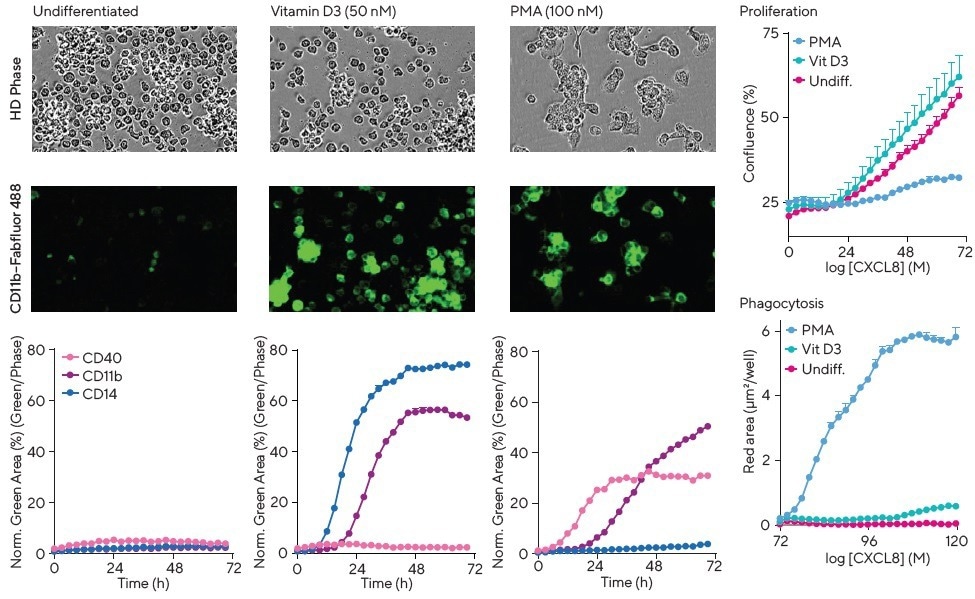
Figure 4. Multiplex cell surface marker, phagocytic activity, and proliferation measurements plus visualization of morphology to study differentiation. THP-1 monocytes were exposed to media (undifferentiated), vitamin D3 or PMA in the presence of Incucyte® Fabfluor-488 Dye complexed to CD11b, CD14 or CD40. PMA showed a marked change in cell morphology (HD phase contrast images) compared to media alone or vitamin D3-treated cells. The kinetic graphs highlight differential and time-dependent surface protein expression in response to the various treatments. Interestingly, PMA, but not media or vitamin D3, yields a decrease in cell proliferation (confluence) and concordant increase in phagocytic potential as measured by efferocytosis of apoptotic Jurkat cells labeled with pHrodo® Red Cell Labeling Kit for Incucyte®. Image Credit: Sartorius
4. Health and apoptosis
Fluorogenic dyes optimized for live-cell analysis can also be used for duplexing the applications described above with apoptosis or cell health readouts.
For instance, cell apoptosis can be measured by both externalized phosphatidylserine (using the Incucyte® Annexin V Dye) and Caspase 3/7 activity (using the Incucyte® Caspase 3/7 Dye; Zhang et al., 1997; Cen et al., 2008; Daya et al., 2010).
The loss of cell membrane integrity can be detected using cell impermeant DNA binding fluoroprobes (such as the Incucyte® Cytotox Red Dye). Real-time live-cell analysis enables the investigation of the time course of apoptosis, cell death, and their relationship to cell proliferation in dividing cultures (Artymovich and Appledorn, 2014).
About Sartorius

Sartorius is a leading international pharmaceutical and laboratory equipment supplier. With our innovative products and services, we are helping our customers across the entire globe to implement their complex and quality-critical biomanufacturing and laboratory processes reliably and economically.
The Group companies are united under the roof of Sartorius AG, which is listed on the Frankfurt Stock Exchange and holds the majority stake in Sartorius Stedim Biotech S.A. Quoted on the Paris Stock Exchange, this subgroup is comprised mainly of the Bioprocess Solutions Division.
Innovative technologies enable medical progress
A growing number of medications are biopharmaceuticals. These are produced using living cells in complex, lengthy and expensive procedures. The Bioprocess Solutions Division provides the essential products and technologies to accomplish this.
In fact, Sartorius has been pioneering and setting the standards for single-use products that are currently used throughout all biopharmaceutical manufacturing processes.
Making lab life easier
Lab work is complex and demanding: Despite repetitive analytical routines, lab staff must perform each step in a highly concentrated and careful way for accurate results.
The Lab Products and Services Division helps lab personnel excel because its products, such as laboratory balances, pipettes and lab consumables, minimize human error, simplify workflows and reduce physical workloads
Sponsored Content Policy: News-Medical.net publishes articles and related content that may be derived from sources where we have existing commercial relationships, provided such content adds value to the core editorial ethos of News-Medical.Net which is to educate and inform site visitors interested in medical research, science, medical devices and treatments.