Introduction
Two key measures, neuronal viability and neurite dynamics, are used to define the neuronal phenotype and assess neurons in culture. These measures are often applied in neuroscience discovery to assess new pathways and mechanisms that play a role in neuroprotection, development or disease, and even neurotoxic effects of new test compounds.
Several standard techniques are available that measure neurite dynamics and cell viability, and these techniques depend on endpoint assays as well as laborious imaging methods that necessitate immunochemical staining.
IncuCyte® Neuronal Assays enable real-time, automated multiplexed measurements of neurite dynamics and cell viability. In several cases, non-perturbing live-cell reagents can be integrated with label-free readouts to differentiate treatments that impact one or more aspects of neuronal cell health.
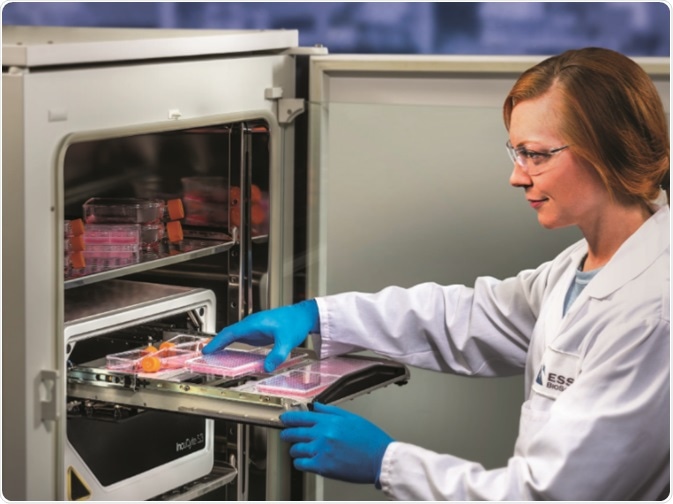
IncuCyte® S3 live-cell analysis system
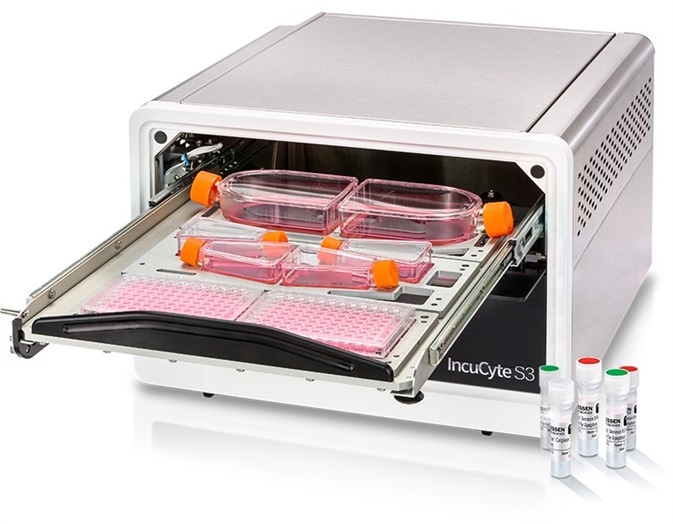
The compact, automated optical instrument, IncuCyte® S3 Live-Cell Analysis System, is placed inside the traditional culture incubator and is employed for long-term kinetic imaging and analysis in HD-phase contrast as well as fluorescence. A robust software package is a vital part of the IncuCyte® system as it enables automated data acquisition, image processing, and analysis.
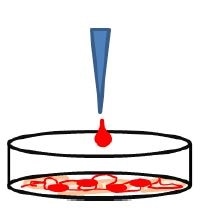
 Live cell analysis workflow. Co-culture assay: Primary rat forebrain/astrocyte co-culture
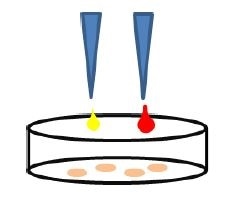
DIV 0: Primary rat forebrain neurons 15K or 45K neurons per well is plated. NeuroLight, a red lentivirus synapsin promoter, is added after four hours for Fluorescent NeuroTrack experiment.
DIV 1: Primary rat astrocytes 15K or 20K astrocytes per well is plated.
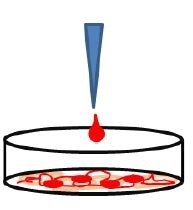
DIV 9: Glutamate CRC ± MK-801 is added; Cytotox or Annexin Reagent is scanned every six hours – out to DIV 13.
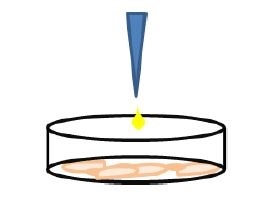
Monoculture assay: Neuro-2a cell line
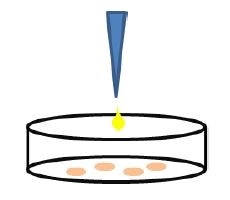
DIV 0: Neuro2A cells 4K cells/well are plated in 10% serum.
DIV 0 + 4 hour: Feed with 20μM retinoic acid, 2% serum (differentiation); U0126 CRC and Annexin Reagent are scanned every six hours – out to DIV 3.
Automated image analysis
- The IncuCyte® S3 Live-Cell Analysis System automatically captures the complete kinetic response in the biological model, enabling observation and quantification of cell behavior over time.
- Experimental conditions can be maintained with non-perturbing reagent formulations and label-free analysis options.
- Better throughput and productivity - experiments can be run in six, 96- or 384-well plates at a single time with complete solution protocols and analysis modules.
- Imaged-based approach for visual analysis of cell morphology and metric verification.
- Application-specific automated image processing tools according to user-defined parameters.
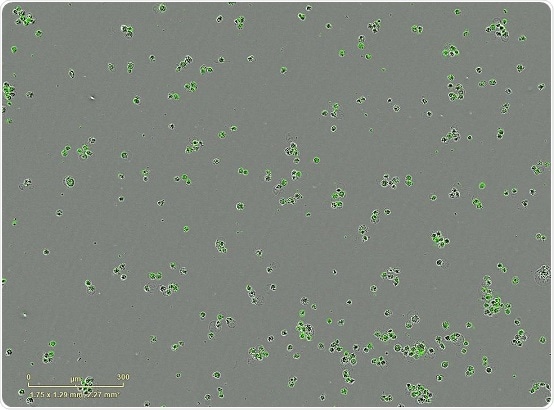
Apoptotic Neuro-2a cells labeled by Annexin V Green
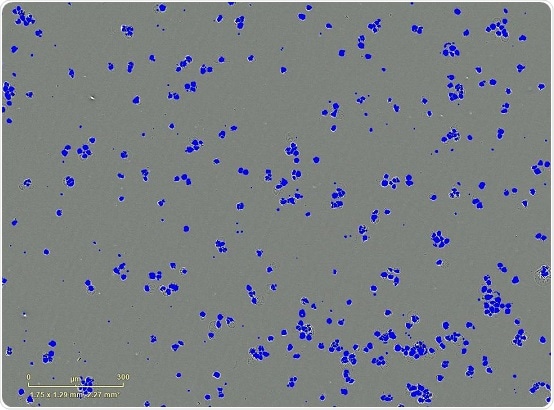
Automated analysis masks and quantifies green fluorescent signal
Evaluation of neuronal cell health following glutamate-induced excitotoxicity using IncuCyte® Cytotox red and green reagents – Primary neuron co-culture
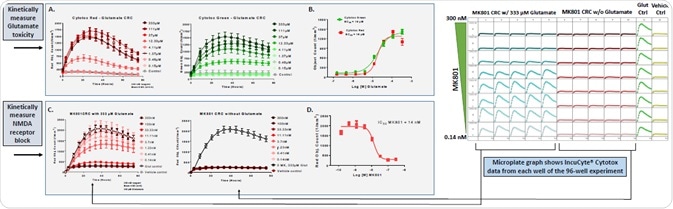
A. Glutamate produced a time- and concentration-dependent increase in Green and Red Object Count (time expressed as post addition on DIV 9)
B. Single time-point analysis done at peak response (24 hrs) - Glutamate EC50 18 μM (Cytotox Green) and 19 μM (Cytotox Red)
C. Glutamate-induced excitotoxicity reduced by co-application of the NMDA receptor antagonist MK801
D. MK-801 IC50 = 14 nM for reducing Glutamate-induced cell death
Multiplexing neuronal cell health and neurite dynamics with IncuCyte® Annexin V green reagent – Primary neuron co-culture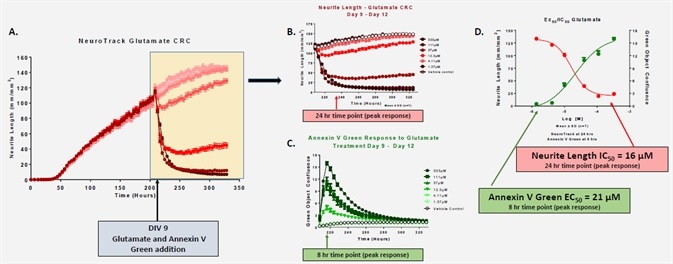 A. Fluorescent Neurite Length tracks neuronal network development - DIV 9 (208 hrs) chosen for glutamate addition to examine network disruption
A. and B. Addition of glutamate produced a concentration-dependent reduction in Neurite Length
C. Multiplexed within the same experiment, glutamate produced a concentration-dependent increase in Annexin V Green signal, indicating activation of apoptotic cell death pathways
D. Single time-point analysis done at peak response to glutamate – Neurite Length (24 hrs) - Glutamate IC50 = 16 μM; Apoptotic cell death (8 hrs) EC50 = 21 μM (Annexin V Green)
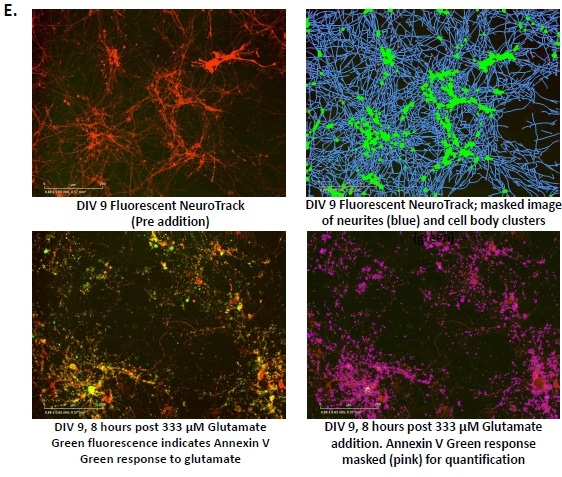
E. Sample images from a single well at DIV 9 before and after glutamate addition showing masking/quantification of neurite length and Annexin response
Differential effect of U0126 (MEK1/MEK2 inhibitor) on cell health and neurite dynamics – Neuro-2a cells
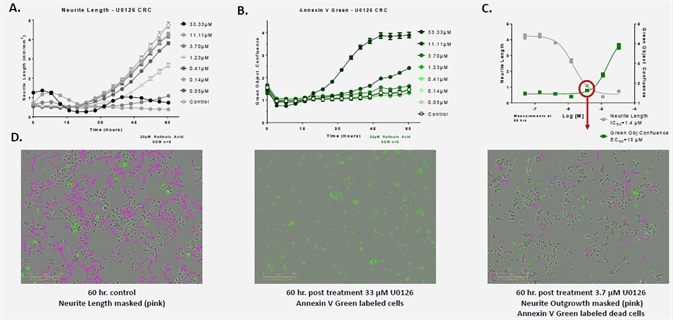
A. U0126 produced a concentration-dependent reduction in Neurite Length (Phase NeuroTrack)
B. Higher concentrations of U0126 produced an Annexin V Green response, indicating compromised cell health
C. Single time-point analysis done at 60 hrs post U0126 treatment – Neurite Length - IC50 = 1.4 μM; Apoptotic cell death EC50 = 15 μM (Annexin V Green)
D. Sample images at 60 hrs showing phase contrast masking of neurites (left), Annexin V Green labeled cells from high concentration of U0126 (center) and mid concentration of U0126 (3.7 μM) showing reduced neurite length with minimal increase in Annexin Green labeled cells (right)
Conclusion
Glutamate-induced excitotoxic cell death in primary rat forebrain/astrocyte co-culture was quantified through continuous, long-term live cell analysis with IncuCyte® Annexin V and Cytotox reagents. In order to assess glutamate-induced apoptotic cell death and the reduced neurite length in the experiment, the IncuCyte® Annexin V Green was multiplexed with Fluorescent NeuroTrack Neurite Dynamic measurements.
The dual MEK1/MEK2 inhibitor U0126 reduced the neurite length at 10 times lower concentrations over those that induced apoptotic cell death (Annexin V Green) in differentiated Neuro-2a cells. These results show that the IncuCyte® S3 is a unified platform, which can be used to evaluate neurite dynamics and neuronal cell health with Annexin V and Cytotox reagents, together with the NeuroTrack analysis software in a kinetic live cell analysis approach.
Author acknowledgement
J. N. Rauch, M. L. Bowe, L. Oupicka, D. M. Appledorn and D. M. Rock.
 Sartorius
Sartorius is a leading international pharmaceutical and laboratory equipment supplier. With our innovative products and services, we are helping our customers across the entire globe to implement their complex and quality-critical biomanufacturing and laboratory processes reliably and economically.
The Group companies are united under the roof of Sartorius AG, which is listed on the Frankfurt Stock Exchange and holds the majority stake in Sartorius Stedim Biotech S.A. Quoted on the Paris Stock Exchange, this subgroup is comprised mainly of the Bioprocess Solutions Division.
Innovative Technologies Enable Medical Progress
A growing number of medications are biopharmaceuticals. These are produced using living cells in complex, lengthy and expensive procedures. The Bioprocess Solutions Division provides the essential products and technologies to accomplish this.
In fact, Sartorius has been pioneering and setting the standards for single-use products that are currently used throughout all biopharmaceutical manufacturing processes.
Making Lab Life Easier
Lab work is complex and demanding: Despite repetitive analytical routines, lab staff must perform each step in a highly concentrated and careful way for accurate results.
The Lab Products and Services Division helps lab personnel excel because its products, such as laboratory balances, pipettes and lab consumables, minimize human error, simplify workflows and reduce physical workloads
Sponsored Content Policy: News-Medical.net publishes articles and related content that may be derived from sources where we have existing commercial relationships, provided such content adds value to the core editorial ethos of News-Medical.Net which is to educate and inform site visitors interested in medical research, science, medical devices and treatments.