Sponsored Content by SartoriusReviewed by Alex SmithJul 21 2023
Astrocytes are specialized glial cells ubiquitously distributed throughout the spinal cord and brain. They occupy approximately 50% of the total volume of the central nervous system (CNS) and are estimated to outnumber neurons by more than five times.1
The number, diversity, and complexity of astroglia cells have increased significantly with evolution, and research from several groups implies that gender differences exist.2,3
Historically, astrocytes have been considered supporters of neuronal function, but increasing evidence suggests that they directly contribute to and support neuronal activity.
Astrocytes are a heterogeneous population of cells with distinguishing functional and morphological characteristics and are specialized to their different brain regions and locations.4 Regional populations of astrocytes also seem to demonstrate local heterogeneity.5
Protoplasmic astrocytes are present in grey matter. They comprise intricate branching processes that envelop synapses and facilitate bidirectional communication.6
Fibrous astrocytes are present in white matter. They contact the myelin-sheath gaps, Nodes of Ranvier, and are coarser and less extensively branched overall. Morphological variation is best characterized using in vivo imaging, but more development is required for in vitro replication.7
Astrocytes influence axonal migration during development and aid the production and function of developing synapses.8 Astrocytes interact with blood vessels, pericytes, and epithelial cells to organize CNS flow and modulate the blood-brain barrier (BBB).9
Regional islands of non-overlapping astrocytes consisting of thousands of synapses are formed.10 This allows synaptic and blood flow control over large regions.11 They also act as important regulators of energy metabolism.12
Maintaining brain homeostasis function is essential. Under pathological conditions, such as infection, injury, or neurodegeneration, reactive astrocytes in combination with microglia contribute to the inflammatory response, playing a vital part in advancing neurodegenerative diseases.13
This article discusses how a combination of live-cell analysis methods deliver the required flexibility to allow these highly dynamic astrocytic models to be characterized, via quantification of their growth, motility, morphology, and functional analysis.
Live-Cell analysis applied to astroglia characterization
The use of real-time, live-cell analysis provides new possibilities and cell biology workflows. This approach utilizes non-invasive time-lapse image acquisition and automatic software segmentation.
This allows the monitoring and measuring of cell behaviors and phenotypes in a non-perturbing manner, over prolonged periods in real-time. This enables informed and data-driven decisions to be integrated into the routine experimental workflow.
The Incucyte® Live-Cell Analysis System delivers flexible kinetic quantification of biological phenotypes to monitor growth, motility, morphology, and cellular function.14
Rat primary astrocytes were isolated from different brain regions (cortex, cerebellum, and hippocampus) and grown in vitro to demonstrate the utilization of live-cell analysis for monitoring and comparing the diversity of cultured astroglia phenotypes.
Time-lapse images were automatically acquired, segmented, and quantified in real-time, as shown in Figure 1. These images were segmented at each time point to enable the generation of time courses and kinetic assessment of morphological change.
Metric variability can also be extracted from this data, resulting in assay optimization and an enhancement of experimental robustness.
Cortical astrocytes displayed a quicker rate of growth (confluence) and a lower ramification (analyzed using the Incucyte® Neurotrack Analysis Software Module) compared to astrocytes isolated from the cerebellum or hippocampus.
Using this data, it is possible to see the potential that live-cell analysis provides to the research of such dynamic and heterogeneous cell types.
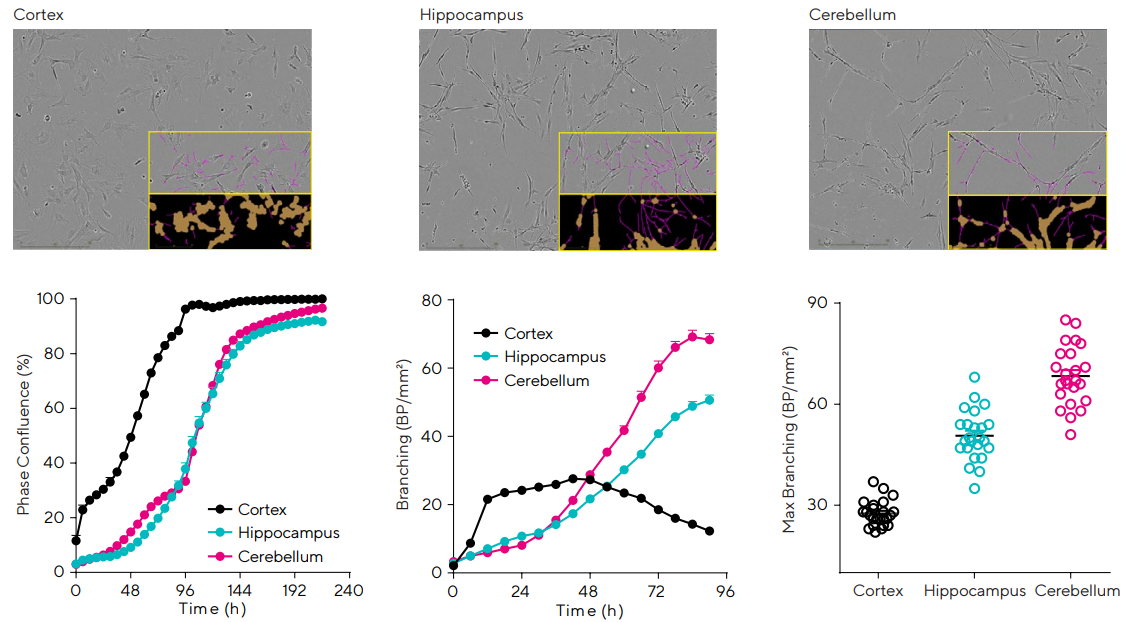
Figure 1. Temporal monitoring of brain region astroglia revealed differences in cell growth and morphology. Cortex, Hippocampus, and Cerebellum astroglia were seeded in 96-well plates at 2,000 cells/well. Proliferation and morphology were monitored over 10 days. Images show cultures at 30–40% confluence (2 days, cortical, or 4 days, hippocampal and cerebellar). Time-course profile compares growth across brain regions and reveals cortical astrocytes have the fastest rate of growth. Glia ramification (pink and brown masks) is compared over time with cerebellum astrocytes yielding the highest ramification by 96 h (68.3 ± 1.8 branch points (BP)/mm2 ) followed by hippocampal (50.6 ± 1.5 BP/mm2 ) and cortical (12.3 ± 0.7 BP/mm2 ). Maximum ramification for each well is also shown (variability plot). Data presented as mean ± SEM (24 replicates) and images were captured at 10X magnification. Image Credit: Sartorius
Cell monitoring and workflow optimization
As advanced cell assays become increasingly technically complex, the demand for holistically capturing dynamic and occasionally subtle cellular events becomes increasingly important.
Utilizing live-cell monitoring during cell culture QC presents an opportunity for better-informed decision-making, e.g., the optimal time to manipulate the culture or conduct the assay.
This guarantees that the models are optimal from the beginning, which validates and enhances the assay readout, leading to improved data interpretation, greater reliability, and better experimental success.15
Properly adjusting seeding density enhances cellular health while reducing assay readiness time. Figure 2 displayed the kinetic correlation of confluence with seeding density for the human glioblastoma T98G cell line.
The ability of the software to distinguish cells from the background is demonstrated in the segmented image. The automatic segmentation determines a confluence value in real time, which are all concatenated to produce a growth profile for each well of the plate.
This can be subsequently used to evaluate the optimal seeding density and appropriate assaying time for each specific cell type.
The importance of the culture environment for a primary astrocytic line was investigated via seeding rat cortical astrocytes on various extracellular matrices (ECM), e.g., Poly-D-Lysine (PDL), Poly-L-Ornithine (PLO), or Poly-L-Lysine (PLL), and kinetically following their confluence.
The data shows the impact of coating a tissue culture vessel on cell growth and indicates assay variability.
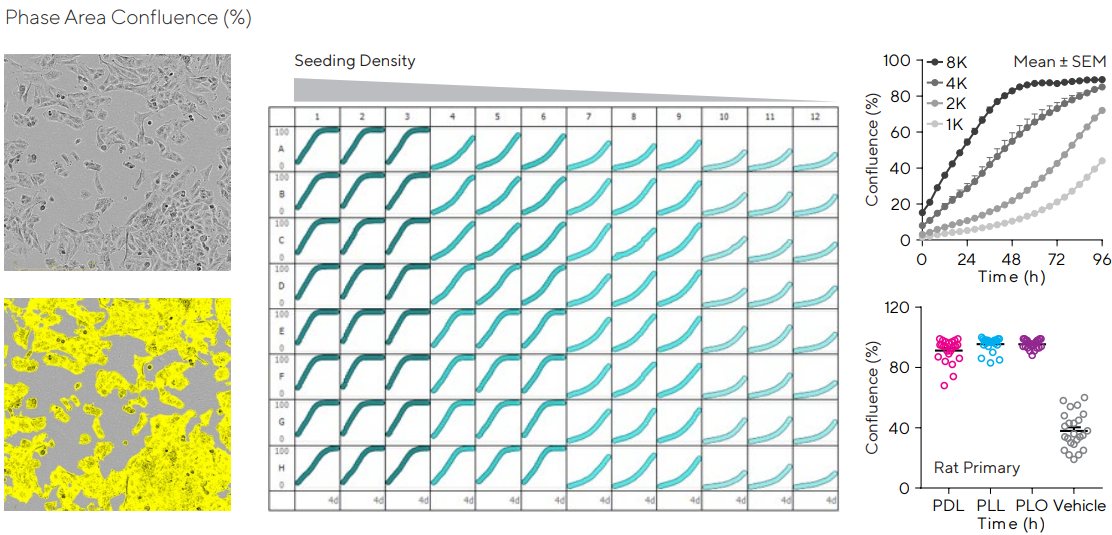
Figure 2. Cell monitoring and workflow optimization. Human glioblastoma T98G cells were seeded in 96-well plates at several densities (1,000–8,000 cells/well). Cellular proliferation was monitored over 4 days. Representative phase images show the segmented cells at 4,000 cells/well and 4 days post-seeding. Plate view represents cell growth in each well of a microtiter plate. Time-course profiles compare astrocyte growth at the different densities tested. The importance of an extracellular matrix is presented in the variability plot, where rat primary cortical astrocytes were seeded at 4,000 cells/well in PLL, PDL, or PLO (0.02–1 mg/mL) pre-coated 96-well plates and each individual confluence value at 4 days was obtained. Data presented as mean ± SEM, 12–24 replicates. Image Credit: Sartorius
Using live-cell analysis to ensure assay quality provides benefits at each stage of the cell assay workflow. The constant monitoring of the cell culture during the study provides a deeper understanding of cellular events, while the capacity to retrospectively evaluate images facilitates better-informed decisions.
Live-cell monitoring guarantees the efficient utilization of resources, which is further improved by its non-invasive and cell-sparing nature. Live-cell analysis also permits pre-treatment normalization of cells, which further enhances assay robustness and allows the accurate characterization of minor changes.
Modulating astroglia health, morphology, and growth
It is typically accepted that primary astrocyte proliferation takes place mostly during brain development, and under healthy conditions, adult astrocytes do not proliferate. However, neural stem cells have characteristics of astrocytes and they maintain the capacity for self-renewal.
Astrocytes may regain their proliferative properties under pathological conditions, such as injury, stress, or neurodegeneration.16
Reactive astrogliosis is considered to be a pathological hallmark of changed CNS tissue, and reactive astrocytes are found in regions around severe focal lesions. Reactive astrogliosis is characterized by proliferation and morphological change, resulting in the creation of a glial scar.17
Reactive protoplasmic astrocytes in the cortex have been demonstrated to re-enter the cell cycle and begin proliferation within three to five days post-injury.18
To produce a cell-based model to evaluate and modulate pathological conditions, injury was induced in primary cerebella astrocytes by raising their intracellular calcium levels with the calcium chelator ionomycin.19
Live-cell imaging was employed to measure the impact of this drug on viability, growth, and morphology, as shown in Figure 3. Ionomycin-induced inhibition on cell growth was exhibited by the confluence measurements.
Apoptosis was measured through visualization and quantification of the kinetic externalization of phosphatidyl serine (PS) utilizing Incucyte® Annexin V NIR Dye.
As expected, proliferation and apoptosis are inversely proportional, as demonstrated by the concentration-response curves (CRCs). At early time points (less than 24 hours) ionomycin-induced concentration-dependent increases in ramification.
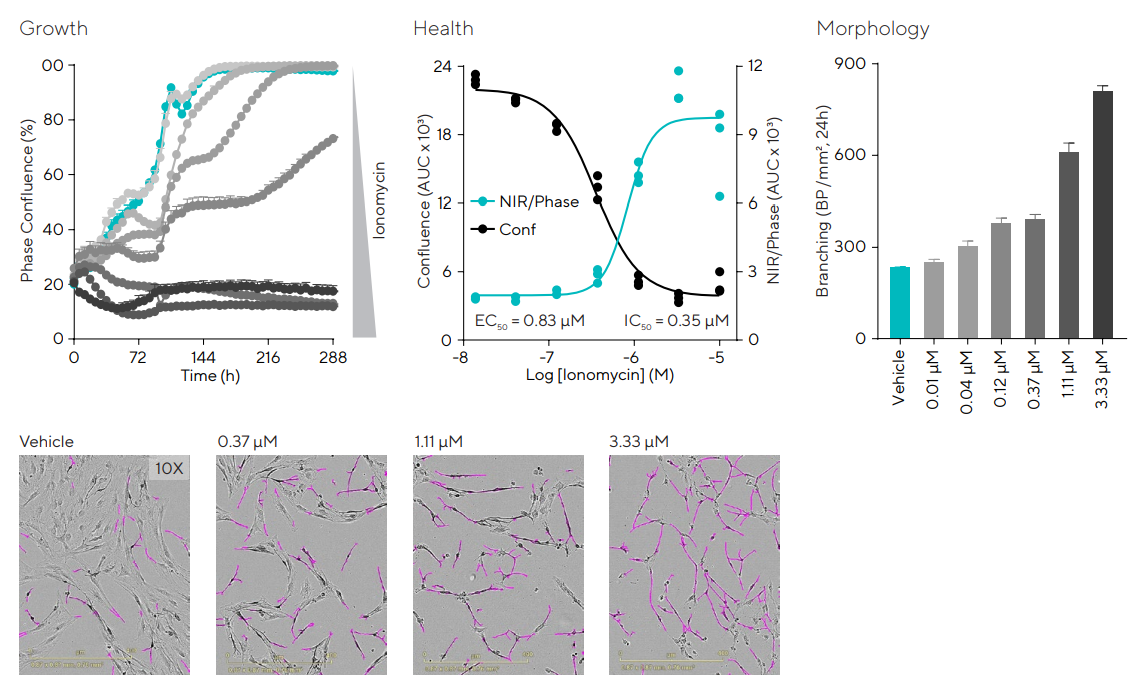
Figure 3. Effects of calcium increase in cerebellar astrocytes cellular growth, morphology, and health. Cerebellum astrocytes were seeded in 96-well plates at 10,000 cells/well and treated with Ionomycin (0.01–10 µM) in media supplemented with Incucyte® Annexin V NIR Dye. Proliferation, cell health, and morphology were monitored over 10 days. Time-course shows the effect of Ionomycin on cell growth. Concentration-response curves compare the effect of Ionomycin on cell growth and apoptosis. The bar graph quantifying morphology and representative images demonstrate that the drug increased ramification at concentrations above 10 nM. Data presented as mean ± SEM, 3 replicates, and images captured at 10X magnification. Image Credit: Sartorius
The function of astrocytes in neurodegeneration is becoming progressively evident, and the great promise shown by novel stem cell-based platforms in modeling these diseases is growing. The role of astrocytes in Alzheimer’s disease (AD) is strongly emerging.20
To better understand cell cycle dynamics, human T98G glioblastoma cells were stably infected using the Incucyte® Cell Cycle Green | Orange Lentivirus.
This facilitates the real-time quantification of cells in the G1 (orange), S | G2 | M (green), or transitioning (G1 to S in yellow; M to G1 non-fluorescent) cell cycle phases without changing cell function, as shown in Figure 4.
Images display the T98G cells as they grow and divide. The Incucyte® Cell-by-Cell Analysis Software Module was used to quantify and classify the various populations, facilitating the segmentation and classification of individual cells according to the green and orange fluorescent intensity.21
This provides an understanding of the phenotypic biology of subsets of cells within a culture. Kinetic quantification of the percentage of cells at each phase shows the culture growth dynamic.
The effects of drug-induced treatment on proliferation can be studied through pharmacological modulation.
The PP2A inhibitor Okadaic acid (OKA) effect was evaluated using an astrocytic cell model of AD. The data suggests that preventing phosphorylation via OKA arrested T98G astrocytes in S | G2 | M phase in a concentration-dependent manner.
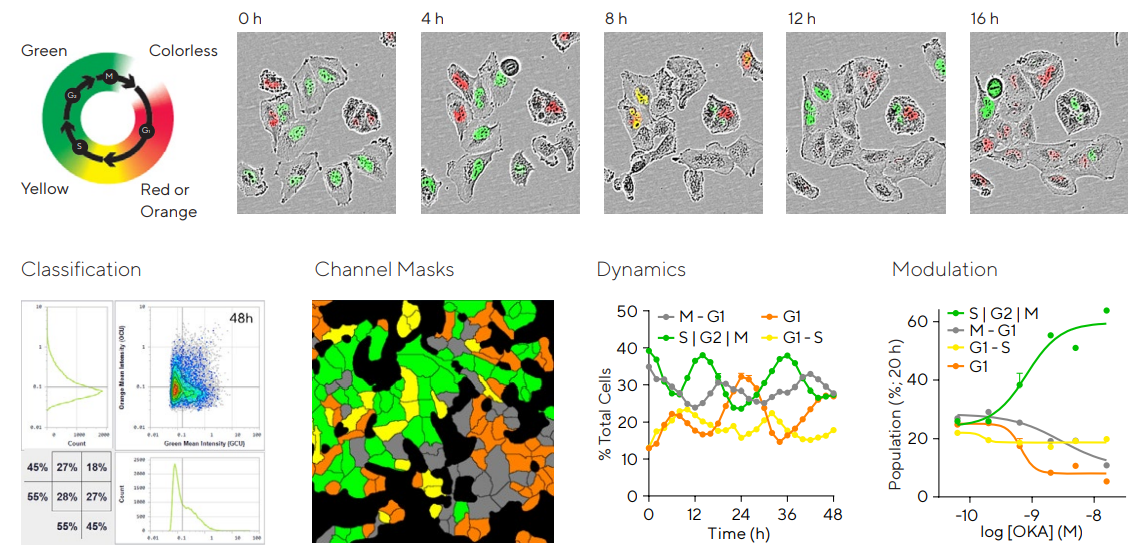
Figure 4. Effect of inhibiting phosphorylation in an astrocytic model of Alzheimer’s Disease. T98G glioblastoma cells stably expressing Incucyte® Cell Cycle were seeded in 96-well plates at 4,000 cells/well. Schematic displays the color expression of the reagent. Representative images show a cycling cell cluster over time. For Cell Cycle quantification, images were acquired in Incucyte® Cell-by-Cell Analysis Software Module to allow individual cells to be segmented and classified according to orange and green fluorescence intensity. Classification masks shows cells identified as orange, green, yellow, or non-fluorescent at a time-point. Time-course reveals the dynamics of each of the populations of T98G cells. To examine cell cycle modulation, T98G cells were treated with the protein phosphatase inhibitor Okadaic Acid (OKA; 0.14–50 nM). The concentration-response curves break down the percentage of cells at each phase for a given concentration at 20 h post-treatment. This data indicates that inhibiting phosphorylation via OKA arrested T98G astrocytes in S | G2 | M phase in a concentration dependent manner. Data presented as mean ± SEM, 6 replicates. Image Credit: Sartorius
Insights into astroglia motility
Astrocytes have been found to divide and migrate during development, disease, and post-injury. Astrocytes experience astrogliosis in a pro-inflammatory environment and transform from naïve to reactive in a reversible manner, changing their morphology and protein expression.
The glia then proliferates and migrates to the site of the lesion site, forming the irreversible glial scar to reduce the propagation of the lesion.22
A recent study that used single nucleus RNA-sequencing revealed a new and intermediate astrocytic state that is present in Alzheimer’s and aging mouse and human brains but to a lesser extent.
These Disease Associated Astrocytes (DAAs) transform from homeostatic astrocytes via the upregulation of metabolic, stress, immune, and aging pathways.23
These reversible glia states may be characterized by elucidating the molecular mechanisms that regulate astrocyte motility. This allows a window of opportunity for therapeutic intervention for neurodegenerative diseases, injury, and stroke.24
This article presents a cell model that employs live-cell analysis and the Incucyte® Scratch Wound Assay to examine astrocytic migration post-injury.25
Time-lapse images from a scratch wound assay may be analyzed, and the rate of cell migration and wound closure may be quantified through the relative wound density (RWD) metric.
Primary astrocytes from various brain regions (cortex, cerebellum, and hippocampus), and iPSC-derived cortical iCell Astrocytes (Fujifilm) were seeded at 80–90% confluence in PLL pre-coated plates. Utilizing the Incucyte® 96-well Woundmaker Tool, a total of 96 independent scratches were made concurrently.
The baseline rate of wound closure was obtained for the different cell types, as shown in Figure 5. The iCell Astrocytes presented a decreased motility in a concentration-dependent manner following treatment with ionomycin.
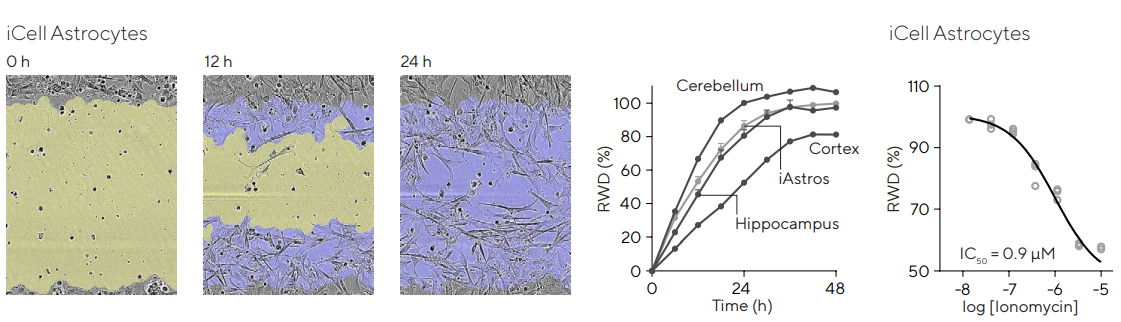
Figure 5. Brain region dependent astrocytic migration post-injury and pharmacological modulation. Primary (Cortex, Hippocampus, Cerebellum) or iPSC (iCell, Fujifilm) astrocytes were seeded in Incucyte® Imagelock 96-well Plates at 30,000 cells/well and precise, reproducible wounds were created with the Incucyte® Woundmaker. Images were acquired using the Incucyte® Live-Cell Analysis System. Images show migration of iPSC-derived iCell Astrocytes at 0, 12, and 24 h post-injury, allowing qualitative morphological assessment. Segmentation indicates initial wound mask (blue) and time-dependent mask (yellow). Time-course profiles compare rate of wound closure for different brain regions with cerebellar astroglia migrating the fastest. For pharmacological studies, iPSC astroglia were incubated with ionomycin (0.01–10 µM) at time of wounding. Concentration-dependent inhibition of migration was observed (IC50 = 0.9 µM). Data presented as mean ± SEM, 3 replicates. Image Credit: Sartorius
A live-cell model of chemotactic migration was developed to provide a deeper biological understanding of glia motility towards the injury site. Human T98G astrocytic line was plated in the Incucyte® Clearview 96-well Plates.26
Each well acts as an optically clear surface for label-free imaging and a membrane consisting of 96 laser-etched pores. Cells were seeded in the upper chamber in low serum media and Fetal Bovine Serum (FBS, 0–10%) was added as the chemoattractant to the lower reservoir plate.
The Incucyte® Chemotaxis Analysis Software Module was utilized to monitor and quantify the directional migration between the top and bottom sides of the membrane, as displayed in Figure 6.27
The concentration-dependent migration of T98G cells through the pores was observed, displaying the potential of this model to examine the migration of chemotactic astroglia.
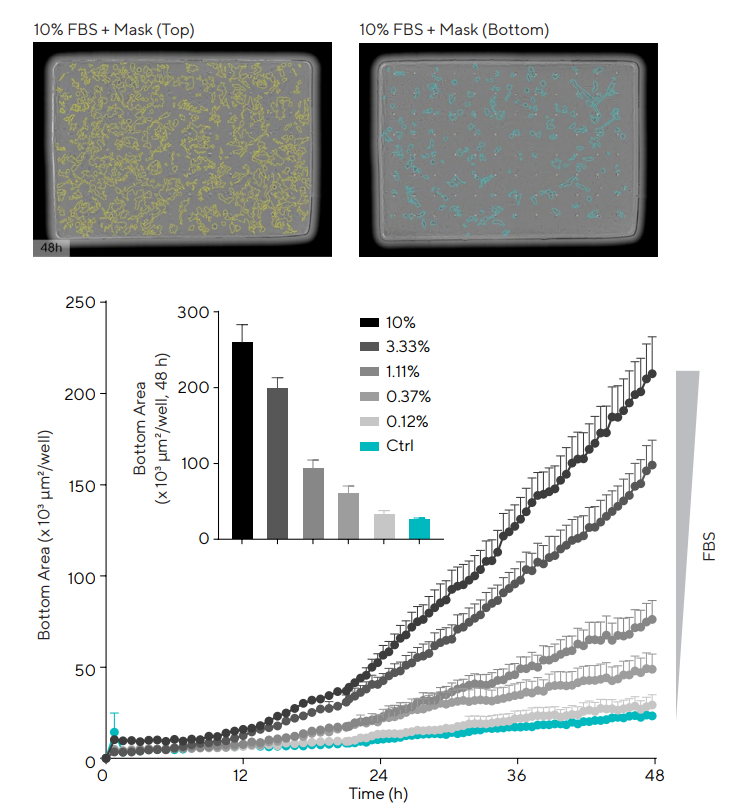
Figure 6. T98G astrocyte chemotactic migration towards FBS. T98G cells were plated in the top chamber of the Incucyte® Clearview 96-Well Plate coated with PDL (0.1 mg/mL) at a density of 1,000 cells/well. Once the cells had adhered, Fetal Bovine Serum (FBS; 0.12–10%) was added to the bottom chamber as a chemoattractant. Images, and respective masks, are representative of the top and bottom side of the membrane at 48 h post-addition. Time-course and bar-graph data indicate a concentration-dependent increase in migration through the pore with increasing levels of FBS. Data presented as mean ± SEM, 6 replicates. Image Credit: Sartorius
Astrocytic modulation of neuronal signaling in co-cultures
Compared to the conventional belief that brain function is exclusively an outcome of neuronal activity, a more coordinated perspective that involves both glia and neurons is now broadly accepted.
Astrocytes are considered to be active partners in brain activity through bidirectional communication, coordinated at the tripartite synapse, and consisting of the neuronal pre- and post-synapses and their close interaction with the surrounding astroglia.28
A humanized live-cell model of neuronal activity was developed in collaboration with Talisman Therapeutics to provide insight into the role of astrocytes in the signaling response of neurons through measuring calcium oscillations.
The latest developments in human induced pluripotent stem cell (hiPSC) deliver a powerful in vitro model strategy for examining the human nervous system's healthy and disease stages.
Non-perturbing neurite outgrowth measurements may be conducted in mono- or co-culture (post-infection with Incucyte® Neurolight Orange Lentivirus29) using the Incucyte® Neurotrack Analysis Software Module to carry out the automatic segmentation of time-lapse imaging.30
Cell bodies and neurites are distinguished and kinetically quantified. For Neuronal Activity measurements, neurons may be infected with the synaptic-driven Incucyte® Neuroburst Orange Lentivirus.31
High-frequency images (three frames per second) are acquired, and fluorescent calcium bursts are quantified over time with the Incucyte® Neuronal Activity Analysis Software Module.32
When neurons were co-cultured with astrocytes, they formed greater and more branched neurites than monocultures, as shown in Figure 7.
Additionally, the functional profile of co-cultures varied from that of monocultures. The co-cultures showed greater active objects (1/image), burst duration (seconds), and lower burst rate (1/minute), at a similar correlation, suggesting that there is improved network stability in the presence of glial cells.
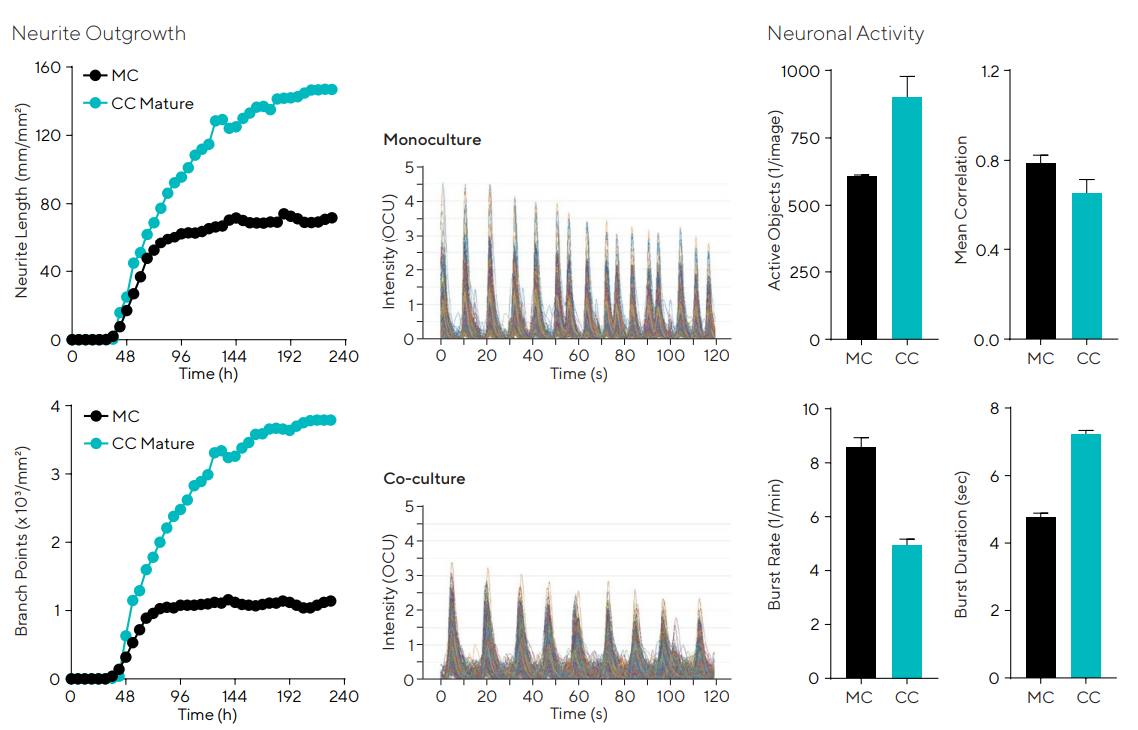
Figure 7. iPSC neurons co-cultured with mature astrocytes yield greater outgrowth and branching and neuronal network activity is modified. Network activity in neuron-astrocyte co-culture differs from monocultures, displaying a reduced frequency of longer-lasting burst rates (characteristic of a more mature neuronal network through the development of a network’s ability to fire trains of APs). N = 12. Traces and bar charts are 23 days post-infection. Image Credit: Sartorius
Conclusion
This article has presented several live-cell phenotypic analyses suitable for characterizing astroglia cells.
When utilized in combination, the health, growth, motility, morphology, and functional effects and their modulation may be evaluated flexibly and dynamically. This is ideal for this type of heterogenous and plastic cells.
Novel technological tools, adapted to the glia dynamism, help to provide deeper insight into this once-undervalued brain cell type. When used in combination with traditional downstream methods, a wider view of the effect that glia has on neuronal health and disease can be obtained.
This provides the opportunity for more translatable cell models that are suitable for improved therapeutics.
Acknowledgments
Produced from materials originally authored by S. L. Alcantara, J. Trigg, T. Campbell, J. Rauch, L. Oupicka, T. Jackson, N. Holtz, E. Endsley, C. Schramm, D. Appledorn and T. Dale at Sartorius AG.
References and further reading
- Sofroniew MV and Vinters HV. Astrocytes: biology and pathology. Acta Neuropathologica, 1(119);7-35 (2010)
- Nedergaard M, Ransom B, and Goldman SA. New roles for astrocytes: Redefining the functional architecture of the brain. Trends in Neurosciences, 26(10);523-530 (2003)
- Santos-Galindo M, Acaz-Fonseca E, Bellini MJ, and Garcia-Segura LM. Sex differences in the inflammatory response of primary astrocytes to lipopolysaccharide. Biology of Sex Differences, 2(1);7 (2011)
- Verkhratsky A and Nedergaard M. Physiology of Astroglia. Physiological Reviews, 98(1);239-289 (2018)
- Hewett JA. Determinants of regional and local diversity within the astroglial lineage of the normal central nervous system. Journal of Neurochemestry, 110(6);1717- 1736 (2009)
- Arizono M, Inavalli VVGK, Panatier A, et al. Structural basis of astrocytic Ca2+ signals at tripartite synapses. Nature Communications, 11;1906 (2020)
- Guo F, Ma J, and Pleasure DE. Astrocytes. Encyclopedia of the Neurological Sciences (2nd Edition), 287-289 (2014)
- Reemst K, Noctor SC, Lucassen PJ, and Hol EM. The Indispensable Roles of Microglia and Astrocytes during Brain Development. Frontiers in Human Neuroscience, 10;566 (2016)
- Cabezas R, Avila M, Gonzalez J, et al. Astrocytic modulation of blood brain barrier: perspectives on Parkinson’s disease. Frontiers in Cellular Neuroscience, 8;211 (2014)
- Halassa MM, Fellin T, Takano H, et al. Synaptic Islands Defined by the Territory of a Single Astrocyte. Journal of Neuroscience, 27(24);6473-6477 (2007)
- Bushong EA, Martone ME, Jones YZ, and Ellisman MH. Protoplasmic astrocytes in CA1 stratum radiatum occupy separate anatomical domains. Journal of Neuroscience, 22(1);183-192 (2002)
- Camandola S. Astrocytes, emerging stars of energy homeostasis. Cell Stress, 2(10);246-252 (2018)
- Li K, Li J, Zheng J, and Qin S. Reactive Astrocytes in Neurodegenerative Diseases. Aging & Disease, 10(3);664-675 (2019)
- Incucyte® Live-Cell Analysis. https://www.sartorius.com/en/products/live-cell-imaging-analysis/live-cell-analysis-instruments/s3-live-cell-analysis-instrument (Jan 6, 2021)
- Live-Cell Monitoring: Optimizing Workflows for Advanced Cell Models. https://www.selectscience.net/resource/live-cell-monitoring-optimizing-workflows-for-advanced-cell-models (Jan 6, 2021)
- Guizzetti M, Kavanagh TJ, Costa LG. Measurements of astrocyte proliferation. Methods of Molecular Biology, 758;349-359 (2011)
- Swanson RA, Ying W, and Kauppinen TM. Astrocyte Influences on Ischemic Neuronal Death. Current Molecular Medicine, 4(2);193-205 (2004)
- Susarla BTS, Villapol S, Yi JH, et al. Temporal Patterns of Cortical Proliferation of Glial Cell Populations after Traumatic Brain Injury in Mice. SAGE journals, 6(3);159 (2014)
- Peaudecerf MS, Obel LF, Waagepetersen HS, and Schousboe A. Complex actions of ionomycin in cultured cerebellar astrocytes affecting both calciuminduced calcium release and store-operated calcium entry. Neurochemical Research, 38(6);1260-1265 (2013)
- Oksanen M, Lehtonen S, Jaronen M, et al. Astrocyte alterations in neurodegenerative pathologies and their modeling in human induced pluripotent stem cell platforms. Cellular and Molecular Life Sciences, 76(14);2739-2760 (2019)
- Incucyte® Cell-By-Cell Software Analysis. Incucyte Cell by Cell Analysis Software | Sartorius(Jan 6, 2021)
- Bylicky MA, Mueller GP, and Day RM. Mechanisms of Endogenous Neuroprotective Effects of Astrocytes in Brain Injury. Oxidative Medicine and Cellular Longevity, Apr 1 (2018)
- Habib N, McCabe C, Medina S, et al. Diseaseassociated astrocytes in Alzheimer’s disease and aging. Nature Neuroscience, 23;701-706 (2020)
- Lagos-Cabré R, Burgos-Bravo F, Avalos AM, and Leyton L. Connexins in Astrocyte Migration. Frontiers in Pharmacology, 10;1546 (2019)
- Incucyte® Scratch Wound Migration and Invasion Assays for Live-Cell Analysis. https://www.sartorius.com/en/products/live-cell-imaging-analysis/live-cell-analysis-software/incucyte-cell-migration-scratch-wound-analysis (Jan 6, 2021)
- Incucyte® Clearview 96-Well Chemotaxis Plate. https://shop.sartorius.com/gb/p/incucyte-clearview-96-well-plate-for-chemotaxis/chemotaxis-96-well-plates (Jan 6, 2021)
- Chemotatic Migration and Invasion Assays for LiveCell Analysis. https://www.sartorius.com/en/applications/life-science-research/live-cell-assays/chemotactic-migration-invasion (Jan 6, 2021)
- Arizono M, Inavalli VVGK, Panatier A, Pfeiffer T, et al. Structural basis of astrocytic Ca2+ signals at tripartite synapses. Nature Communication, Apr;11(1) (2020)
- Incucyte® Neurolight Orange Lentivirus. https://www.sartorius.com.cn/download/1024078/8000-0630-a00-cat4758-incucyte-neurolight-orange-lentivirus-pds-data.pdf (Jan 6, 2021)
- Neuronal Cell Health & Morphology. https://www. essenbioscience.com/en/communications/assaysneuroscience-research/neuronal-cell-healthmorphology (Jan 6, 2021)
- Incucyte® Neuroburst Orange Lentivirus Reagent— Synapsin Promoter for Neuronal Activity. https://www.sartorius.com/download/1138924/incucyte-neuroburst-orange-lentivirus-data.pdf (Jan 6, 2021)
- Incucyte® Neuronal Activity Assay. https://www. essenbioscience.com/en/applications/live-cell-assays/ neuronal-activity/ (Jan 6, 2021)
About Sartorius
Sartorius is a leading international pharmaceutical and laboratory equipment supplier. With our innovative products and services, we are helping our customers across the entire globe to implement their complex and quality-critical biomanufacturing and laboratory processes reliably and economically.
The Group companies are united under the roof of Sartorius AG, which is listed on the Frankfurt Stock Exchange and holds the majority stake in Sartorius Stedim Biotech S.A. Quoted on the Paris Stock Exchange, this subgroup is comprised mainly of the Bioprocess Solutions Division.
Innovative technologies enable medical progress
A growing number of medications are biopharmaceuticals. These are produced using living cells in complex, lengthy and expensive procedures. The Bioprocess Solutions Division provides the essential products and technologies to accomplish this.
In fact, Sartorius has been pioneering and setting the standards for single-use products that are currently used throughout all biopharmaceutical manufacturing processes.
Making lab life easier
Lab work is complex and demanding: Despite repetitive analytical routines, lab staff must perform each step in a highly concentrated and careful way for accurate results.
The Lab Products and Services Division helps lab personnel excel because its products, such as laboratory balances, pipettes and lab consumables, minimize human error, simplify workflows and reduce physical workloads.
Sponsored Content Policy: News-Medical.net publishes articles and related content that may be derived from sources where we have existing commercial relationships, provided such content adds value to the core editorial ethos of News-Medical.Net which is to educate and inform site visitors interested in medical research, science, medical devices and treatments.