Fluorescently labeled antibodies are extensively applied to image cell-surface protein expression and immuno-phenotyping (for example, flow cytometry and immunocytochemistry). But their use is mostly restricted to short-term (min-h) or endpoint detection. Moreover, the biology of interest is usually perturbed by the necessary cell processing and labeling steps.
Sartorius have developed an innovative approach based on fluorescently labeled antibody fragments (Fabs) and Incucyte® Live-Cell Analysis to facilitate fully dynamic, longer-term applications of cell surface protein markers in living cells.
Abs was tagged to surface markers (for example, CD4, CD20) by using an anti-mouse Fc-targeted Fab fragment conjugated to a green fluoroprobe (Incucyte® FabFluor-488) through a simple, single-step no-wash protocol. When the FabFluor-488-Ab complex is added to living cells, it generates a unique, long-lasting, and stable fluorescence, without perturbing cell morphology or growth.
This technique facilitates long-term tracking and measurement of protein expression and the potential to determine cell subsets in living cultures over time. This strategy should prove robust in analyses on complex, advanced heterogeneous cell models.
Coupling protein expression dynamics to cell differentiation
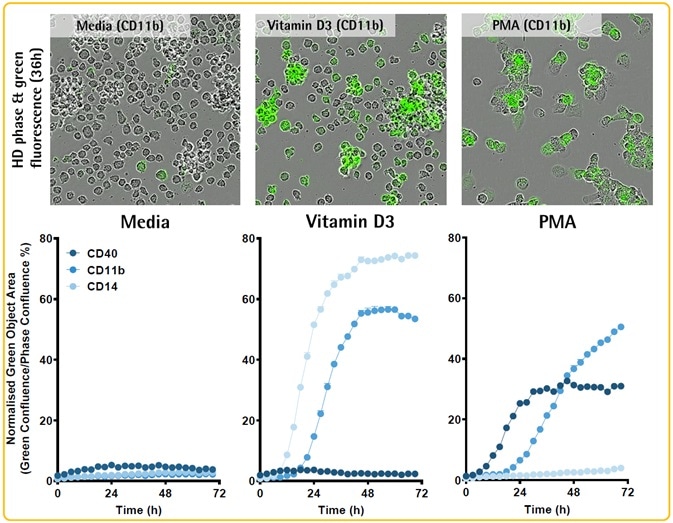
Image Credit: Incucyte®.
- Incubation of THP-1 cells (30K/well) was performed by using Opti-Green, FabFluor-488-Ab and either phorbol myristate acetate (PMA; 100 nM) or Vitamin D3 (50 nM) to induce a macrophage-like phenotype.
- Phase and fluorescence images were captured (20x objective).
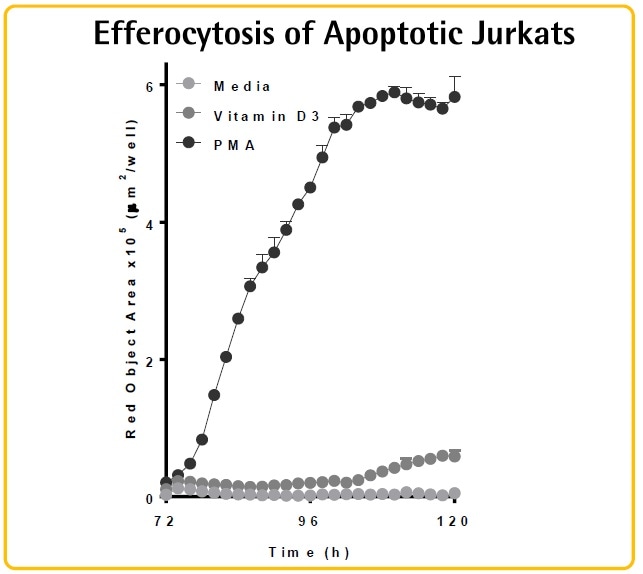
Image Credit: Incucyte®.
- THP-1 cells treated with PMA or Vitamin D3 exhibited variations in morphology, protein expression, and function (efferocytosis).
- Although both treatments improve CD11b expression, only PMA induces CD40, and only Vitamin D3 upregulates CD14.
- THP-1 cells treated with PMA tend to show morphology similar to macrophages, proliferate slowly, and exhibit efferocytic potential.
Monitoring cell-to-cell interactions: Immune cell killing
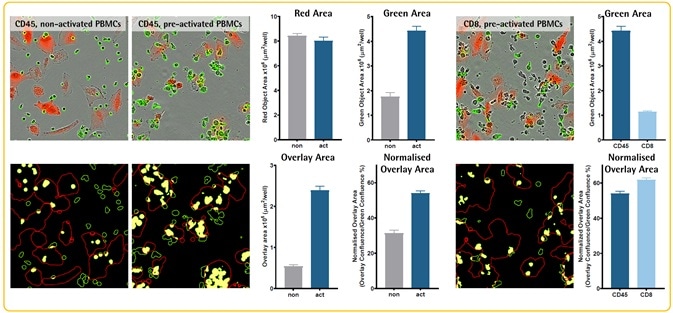
Image Credit: Incucyte®.
- Pre-activated PBMCs (anti-CD3/IL2, 4 d) were used for incubating A549 CytoLight™ Red (adenocarcinoma) cells (5K/well) in the presence of Opti-Green and CD8 or CD45 Abs labeled with FabFluor-488.
- Images were captured 2 hours post-configuration (20x objective).
- When compared to non-activated PBMCs, pre-activated PBMCs (CD45-positive) exhibit a higher level of interaction (overlay area) with A549 target cells. Normalized overlay area indicates that CD8-positive cells might interact more with A549 cells when compared to the general CD45-positive PBMC population.
IFNγ-induced upregulation of PD-L1 checkpoint protein
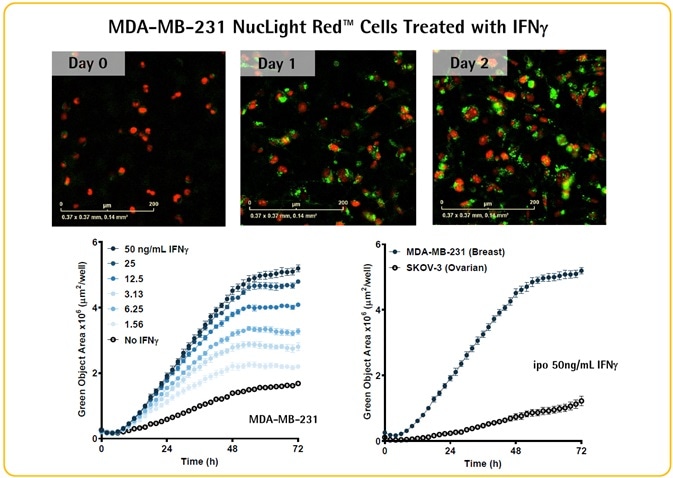
Image Credit: Incucyte®.
- IFNγ was used to incubate SKOV-3 (ovarian) or MDA-MB-231 (breast) cancer cells (5K/well) in the presence of Opti-Green and FabFluor-488-PD-L1 Ab.
- Measurement of the green fluorescence area reveals that IFNγ causes a concentration- and time-dependent increase in PD-L1 expression in MDA-MB-231 cells.
- This technique can be used to image differential PD-L1 expression in SKOV-3 (medium expresser) and MDA-MB-231 (high expresser) cells.
Incucyte® system for continuous live-cell analysis: Methodology
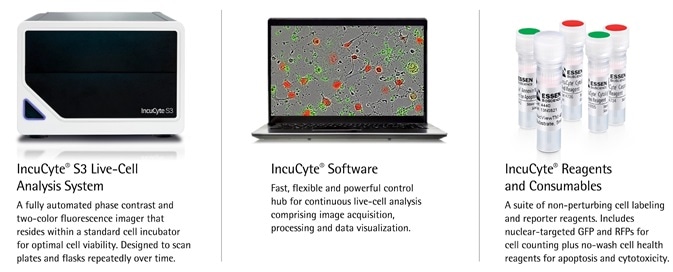
Image Credit: Incucyte®.
Quick guide
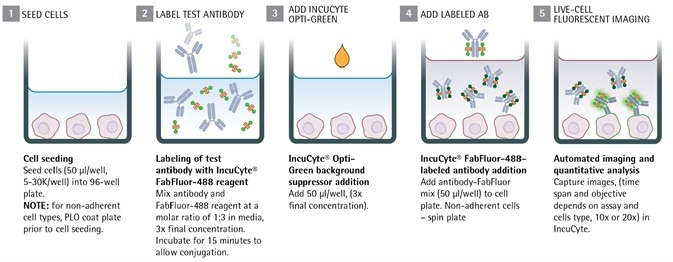
Image Credit: Incucyte®.
Validation: Non-perturbing, sustained, and specific labeling
- Opti-Green Background Suppressor (0.5 mM) was used to incubate HT-1080 fibrosarcoma cells (5K/well) in the presence of media or antibodies to IgG (isotype control) and CD71 (transferrin receptor) labeled with FabFluor-488 reagent.
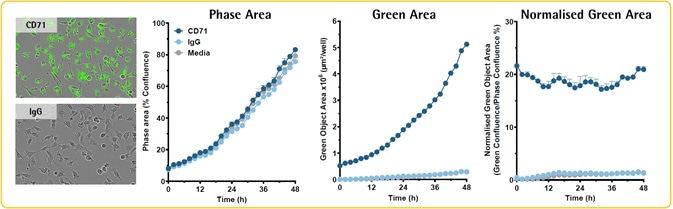
Image Credit: Incucyte®.
- The entire HT-1080 cell population is labeled by CD71. IgG was not found to label any cells.
- In the presence of Opti-Green, CD71 FabFluor-488-Ab complex does not inhibit the proliferation of cells (Phase Data).
- Expression of CD71 increases over time, in accordance with cell proliferation.
- The longevity and stability of CD71 labeling are confirmed by normalized green/phase area metric.
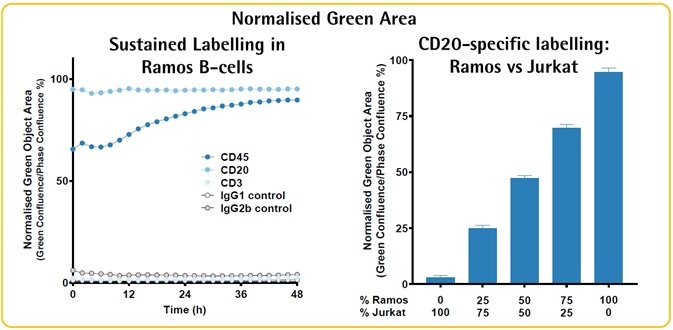
Image Credit: Incucyte®.
- The image above illustrates the labeling of Ramos (B-lymphoma) cells with CD20 (B-lymphocyte antigen) and CD45 (common lymphocyte antigen), but not CD3 Ab complex (T-cell co-receptor).
- CD20 labeling area follows predicted proportions in mixed cultures (Jurkat T-cells are CD20 negative).
Live-cell immunocytochemistry: PBMC immuno-phenotyping
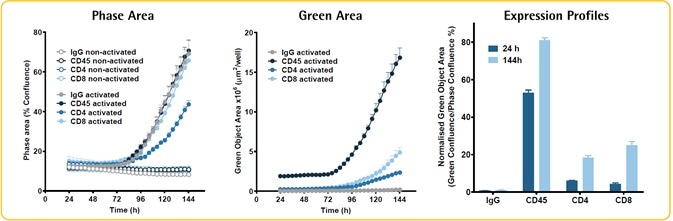
Image Credit: Incucyte®.
- Incubation of PBMCs (30K/well) was performed with or without anti-CD3/IL2 (10 ng/ml), in the presence of Opti-Green and various FabFluor-488-Abs.
- There was no effect of IgG, CD8, and CD45 on the proliferation of PBMCs. The CD4 Ab led to a considerable reduction.
- Green fluorescence area gives an index of the increase in the particular subpopulations — CD4, CD8, and CD45, all increased.
- The expression profiles of individual cell sub-populations are predicted by the normalized green area. The green area is found to be smaller than the phase area inside each cell, revealing that the true expression profile is understated.
Acknowledgments
Produced from materials originally authored by N. Bevan, V. Blancheteau, H. Campwala, N. Dana, N.Holtz, E. Endsley, T. Dale, C. Szybut, L. Kelsey, G. Lovell, B. O'Clair and D. Trezise from Essen BioScience.
About Incucyte®
The Incucyte® Real-Time Quantitative Live Cell Analysis System, designed by Essen BioScience, Inc (now a Sartorius company) is the first system to continuously quantify cell behavior over time (from hours to weeks) while cells remain undisturbed inside a standard incubator. The Incucyte® System automatically collects and analyzes images continuously around the clock, providing insight into active biological processes that is difficult to achieve with endpoint assays. The Incucyte® suite of assays utilize proprietary reagents that do not perturb cell health with validated 96/384 well format protocols that save time and money.
Incucyte® Live-Cell Analysis has revolutionized numerous studies, with applications such as stem cell monitoring and reprogramming, label-free analysis, ATP metabolism, multiplexing, neurite outgrowth and dynamics, migration/invasion, 3D-spheroids, angiogenesis, NETosis, reporter gene expression, immunocytochemistry, immune cell killing, apoptosis, cytotoxicity, kinetic data generation, antibody internalization. All this without the removal of cells from an incubator.
Sponsored Content Policy: News-Medical.net publishes articles and related content that may be derived from sources where we have existing commercial relationships, provided such content adds value to the core editorial ethos of News-Medical.Net which is to educate and inform site visitors interested in medical research, science, medical devices and treatments.