In this interview, Andrew Jones discusses the importance of quality control in next-generation sequencing and the effect that a poorly followed protocol can have on experimental results.
How important is quality control of dsDNA samples for next generation sequencing? How can artefacts affect the quality of subsequent data analyses?
Quantity and quality of input samples are two key considerations in successful library preparation for next generation sequencing. The ultimate success or failure of a library preparation is often strongly linked to using an accurately quantified amount of input DNA.

Image credit: Zita | Shutterstock
High quality libraries provide minimal bias and reliable sequence coverage. A robust quantification and quality control procedure for sample input is important to ensure consistent results through the workflow and maximise sequencer throughput.
Most next-gen sequencer providers recommend the quantification of input sample by analyte-specific fluorometric quantification, for example the DeNovix dsDNA fluorescence quantification assays as well as PicoGreen and Qubit assays. These methods utilize intercalating dyes specific for dsDNA and do not bind to other nucleic acid species that may be present.
In addition to quantification, it is also important that samples are free from potential enzymatic inhibitors. Contaminants such as proteins, EDTA, phenol, salts and polysaccharides can all have a negative impact on subsequent enzymatic reactions and lead to decreased yield, uneven or poor coverage or even failure of the library preparation. To assess the purity of a sample, microvolume UV-Vis spectrophotometry is recommended.
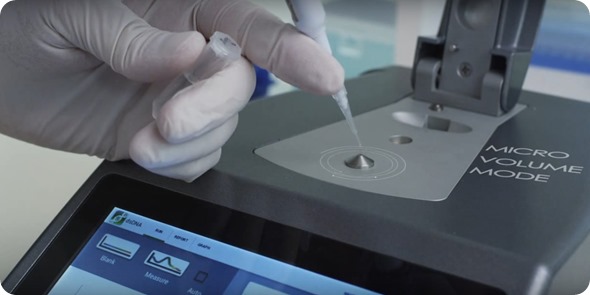
Image credit: DeNovix
What are the advantages of being able to conduct absorbance and fluorescence measurements with one system?
The ability to combine both absorbance and fluorescence quantification methods provides a number of important advantages for researchers. For NGS labs, it enables researchers to obtain quantitative and qualitative information on a single platform for both pre- and post-PCR sample QC while using minimal amounts of sample.
Combining results from fluorescence quantification methods with purity ratio and concentration measurements gained through UV-Vis analysis enables better-informed decisions on whether your sample is likely to perform well in sequencing.
For example, a fluorometric quantification will confirm if there is a sufficient dsDNA template for a library preparation and take into account whether the 260/230nm and 260/280nm absorbance ratios will allow assessment of any potentially inhibitive contaminants.
The difference between concentration measurements using absorbance and fluorescence may also give an indication of the efficiency of your extraction in isolating only the nucleic acid of interest as the absorbance value will also include absorbance of all nucleic acids (single nucleotides, oligos, RNA, dsDNA or ssDNA).
An instrument capable of performing absorbance and fluorescence also extends the utility of the device for life science labs without the need for multiple purchases.
The DS-11 FX+ for example, has a four-LED fluorescence optical core that, in addition to all common nucleic acid and protein quantification assays, will also measure a wide range of other fluorophores. The DS-11 FX+ also has the option to use traditional cuvettes for UV-Vis, ideal for kinetic assays.
DeNovix DS-11 | Spectrophotometer | UV-Vis Spectrophotometry
Combining the two measurement modes also extends the dynamic range over which samples can be measured on a single instrument. The broad dynamic range of Microvolume absorbance (0.75ng/µL to 37,500 ng/µL dsDNA on the DS-11 Series) enables almost any sample to be directly quantified using just 1µL without dilution.
With the addition of fluorescence, the lower detection limit is as low as 0.5 pg/µL (using the DeNovix dsDNA Ultra High Sensitivity Assay). One instrument can therefore measure across all concentration ranges likely to be encountered in a genomics or proteomics lab.
How have lowered detection limits been achieved? How has this affected the sensitivity and specificity of samples that can be tested?
The DeNovix team has a depth of expertise including life scientists, engineers, software developers and manufacturing. All are based in our headquarters in Wilmington, Delaware, USA.
To set industry-leading detection limits in microvolume UV-Vis and fluorescence on one instrument, it was necessary to combine the development of novel measurement algorithms, unique hardware and fluorescence chemistry.
Over the last 12 months, DeNovix has launched new assays that have increased the fluorescence sensitivity of dsDNA twenty fold over the previous industry standard and improved the lower detection limit of microvolume UV-Vis by 60%.
Important to the DeNovix approach is that the team that developed these products is also the team that support them.
What applications are there for dsDNA samples under 5pg/ul?
Genomics techniques are rapidly moving towards decreasing the complexity of samples and uncovering the roles of rare variants in larger populations. Examining the genome or transcriptome of single cells or small populations reveals information on cellular differences that may remain obscured by larger cell population studies.
Examples include tumour heterogeneity studies, isolation of circulating tumour cells, ChIP-Seq, DNA from formalin-fixed paraffin-embedded (FFPE) tissues, laser-capture microdissected (LCM) samples, stem cells, and examination of unculturable microorganisms.
Please describe the optical core in the fluorescence component. What wavelength ranges can be detected and how is this affected by the ultrasensitive photodiodes?
The optical core of the DS-11 FX is a unique, patent-pending innovation from DeNovix. Using cutting-edge design and manufacturing techniques, DeNovix fluorometers contain four LED-light sources each with an independent filter channel and photodiode detector.
This replaces single or dual channel systems that were pre-existing in the market. The pace of development of new assays and fluorophores in life science is rapid. Providing excitation in UV, Blue, Green and Red wavelengths (see table for details) maximises flexibility of the instrument and provides a platform capable of meeting current and future demands.
Fluorometer Mode (DS-11 FX, DS-11 FX+ and FX Module)
| Light Sources |
UV LED (~375 nm), Blue LED (~470 nm),
Green LED (~525 nm), Red LED (~635 nm) |
| Excitation Filters |
UV: 361-389 nm, Blue: 442-497 nm,
Green: 490-558 nm, Red: 613-662 nm |
| Emission Filters |
435-485 nm , 514-567 nm, 565-650 nm, 665-740 nm |
What are the advantages and disadvantages of using fluorescence vs. absorbance?
Both fluorescence and absorbance have their advantages and their drawbacks when quantifying samples.
Absorbance quantification of nucleic acids is performed by analysing the amount of light across a UV spectrum transmitted through a sample. The absorbance peak for nucleic acids is 260nm and the amount of light absorbed at this wavelength can be used to directly calculate the concentration of the sample using the Beer-Lambert equation. The main advantages of using absorbance are:
- It is quick and direct. The sample is measured directly with no need to set up assays or measure standard curves.
- Wide dynamic range. By shortening the pathlength, increasingly concentrated samples can be measured. Currently, the upper detection limit for microvolume absorbance is 37,500ng/µL dsDNA.
- By assessing the ratios of 260/280nm and 260/230nm, information on the extent and the nature of impurities in the sample can be inferred.
- Low cost. No assay costs, just pipette a sample onto the measurement surface and measure.
A drawback of using absorbance methods for quantification of nucleic acids is that the peak absorbance at 260nm is common for all nucleic acids. As such, any contaminating ssDNA, RNA, free nucleotides or oligo in a sample will increase the reported concentration.
Fluorescence methods on the other hand, typically use a dye selective for the biomolecule of interest. The dye fluoresces when bound to the target molecule and will not detect other molecules in the sample.
The amount of fluorescence emitted is proportional to the concentration of the sample. The selectivity of fluorescence assays is a key advantage of fluorescence enabling the researcher to ensure quantitation data is specific for their analyte.
Fluorescence assays are also generally more sensitive than absorbance. Using the DeNovix DS-11 FX and dsDNA quantification assays, concentrations as low as 0.5pg/µL of dsDNA in your original sample can be detected. This compares to 0.75 ng/µL using microvolume UV-Vis.
Limitations of fluorometric methods include:
- There is an increased time and cost as the assay requires setting up, and pipetting errors need to be avoided to ensure accuracy.
- It is an indirect method and so requires measurement against a standard curve. Standards need to be accurate, treated well, and be appropriate for your sample type and concentration.
- The dynamic range of assays is more limited and some a priori knowledge of expected concentration is required to avoid dilution.
Please can you describe how ‘pathlength’ affects spectroscopic measurements of microvolume samples? What problems can arise without precise calibration and pathlength control? How is this problem solved in DeNovix systems?
Small volume spectrophotometers, such as the DS-11 Series, enable the analysis of microliter volumes of sample by creating a liquid bridge of the sample between an upper and lower measurement surface.
In order to gain quantitative measurements, the Beer-Lambert equation is used to correlate the absorbance with the concentration and the pathlength through which the light travels through the sample.
A=ε*b*c
A: absorbance value
ε: absorptivity coefficient with units of L/mol*cm
b: pathlength of the sample expressed in terms of cm.
c: concentration of the sample in solution, expressed in mol/L.
The accuracy of results is therefore dependent on the accuracy of a calibrated distance between the two measurement surfaces. The DS-11 uses a patented opto-mechanical system with proprietary algorithms that together control the pathlength to within 1 micron.
The DS-11 uses real-time absorbance data to determine the optimal pathlength for each sample, automatically adjusting the distance between the measurement surfaces to deliver optimal results.
Higher concentration samples require increasingly smaller pathlengths and the fine control that DeNovix has over the optical path enables us to accurately set extremely small pathlengths reliably and reproducibly without requiring calibration.
Other microvolume systems involve calibration of the pathlength through periodic verification and recalibration by a service engineer. The potential for drift away from a precise pathlength may cause a systematic error over time in all samples measured. During use, the DS-11 routinely monitors pathlength accuracy and automatically performs any necessary adjustments.
What problems are there with samples not bridging correctly? How does this affect the results? How does the DeNovix Bridge Testing ® remove the possibility of column breakage?
Microvolume spectrophotometers rely to a greater or lesser extent on the surface tension of a sample to bridge the air gap between two measurement surfaces.
Erroneous results will be obtained if the sample fails to bridge the gap as the light fails to travel uniformly through the sample. Common causes of unbridged measurements are failing to pipette enough sample, surface unconditioning or low surface tension buffers.
The DS-11 uses a pathlength of 0.5 mm and compresses a sample during the measurement cycle. This is an inherent advantage over systems using longer, 1.0mm pathlengths that need to stretch the sample and risk column breakage.
The DS-11 software includes an algorithm to test for an unbridged condition and automatically compensates to shorten the pathlength to connect with the sample, with no user input required.
DS 11 Series | Spectrophotometer | Fluorometer
What does the future hold for DeNovix? Will future models be able to detect lower sample concentrations?
DeNovix has always worked alongside the primary research community to understand key workflow requirements and the limitations of current methods. We are continually developing the functionality and performance of current instruments to set new standards in detection and enable new applications.
We also have a development pipeline that utilizes our expertise in engineering, optics and life science to solve current problems in key laboratory workflows.
Where can readers find more information?
About Andrew Jones
 Andrew is currently the Market Development Manager with DeNovix Inc. having initially joined the Technical Advisory board in 2012.
DeNovix Inc. is a private company based in Wilmington, Delaware that develops, manufactures and sells innovative products for the life science community based on high technology optics and detection systems.
Prior to DeNovix Inc., Andrew was European Clinical and Translation Medicine Manager with Affymetrix and previously held sales and management roles at Roche Diagnostics in the microarray and next generation sequencing markets.
A graduate of the University of Wales, Andrew is a Master of Research in Life Science and is based in the South of England.