Biochemical reactions are regulated by enzymes. These reactions involve binding, recognition, and the creation of non-covalent complexes. It is essential to characterize binding events in order to gain a better understanding of physiological processes at the molecular level. As a result, biomedical and biochemical research require methodologies that will enable accurate analysis of binding reactions.
Isothermal titration calorimetry (lTC) is quickly becoming a popular method for determining catalysis and binding equilibria and intermolecular interactions with excellent sensitivity. High affinity interactions such as protein-cofactor and enzyme substrate binding and low affinity interactions such as some protein-protein interactions can be determined quickly and precisely using just nanomoles of native sample (Figure 1). This article explores the lTC method as a way of studying non-catalytic macromolecular binding.
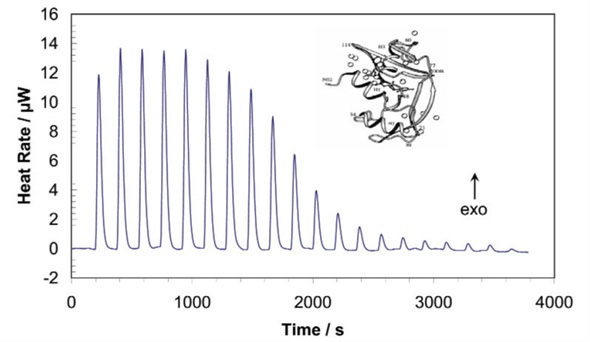
Figure 1. ITC allows the rapid and accurate assessment of binding reactions, without the need to develop new assay protocols for each biomolecule or ligand. The stoichiometry of binding, and the association constant, enthalpy and entropy of the reaction can all be directly determined using just nanomoles of material. Note: ITC can characterize a binding reaction in about one hour.
Binding is Driven by Thermodynamics
All binding phenomena are accompanied by the absorption or evolution of heat (a transformation in enthalpy, Δ H). A complete thermodynamic characterization of the binding reaction gives basic data about the interactions that drive the binding process at the molecular level. For instance, if the reaction being analyzed is the binding of a drug candidate to a mutated protein, this thermodynamic data could suggest changes to the drug’s chemical structure that would enhance molecular interactions at the drug-protein interface, increase specificity for the mutated protein, increase binding and improve drug efficacy. While a number of methods are available for examining the binding reactions, all but one require enthalpy to be calculated from measurements, which leads to a degree of inaccuracy in the value of ∆H.
lTC directly quantifies the enthalpy of a binding reaction. A solution of one component such as a drug candidate ligand is titrated into a dilute solution of the second component such as a mutant protein. Each time the ligand is injected into the sample, an equilibrium of bound and free ligand is established, and heat is absorbed or released. Once the titration is completed, binding sites in the sample are occupied and the observed association constant (Ka) can be determined. As temperature (T) is kept constant for the duration, the free energy (∆G) of the binding reaction can be calculated as follows:
∆G = -RT ln K
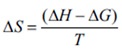
Since the lTC method can determine the ∆H directly, the change in entropy (∆S) can be calculated as follows:
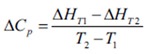
Therefore, a number of 1 to 2 hour automated lTC experiments, that require only nanomoles of sample, give the entropy, enthalpy and association constant of the binding reaction. Also, knowing the concentrations of the two components, for instance protein and ligand, makes it possible to determine the stoichiometry of the binding reaction. If the titration is performed at a minimum of two temperatures, the alteration in constant pressure heat capacity (D Cp) can be calculated as follows:
The physical processes involved in the binding reaction are revealed through quantification of these thermodynamic parameters. The non-covalent interaction of two molecules occurs mainly through surface hydrophobic patches. Binding specificity is provided through accurate coupling of hydrogen bond acceptors and donors, dipole interactions, electrostatic interactions and so on. When binding occurs between two molecules, they must display more affinity for each other than they do for the solvent, or else binding will not take place.
The two main components of entropic contribution are the release of bound solvent as hydrophobic groups interact and conformational alterations such as unfolding and folding of the macromolecules. The enthalpic contribution to binding is mainly due to a greater number of hydrogen bonds with optimal donor-acceptor geometry and distance at the ligand-target interface and to more favorable van der Waals interactions between the two molecules.
Practical Implications
A number of linked equilibria play a role in the overall heat effect. Hence, calorimetry gives global data about binding interactions rather than atomic-level data. Nevertheless, there are two techniques that can be used to better understand the primary structural and chemical determinants that drive an interaction. One method is the systematic variation of the protonation environment of the sample and the second is the coupling of the thermodynamic information obtained from lTC experiments with atomic-level structural data. This approach is having a profound effect on the pharmaceutical sector.
Before lTC became widely available, thermodynamic information was difficult to correlate with structural information. For instance, when there is a lack of understanding about the interactions between a drug and target, specificities and affinities of drug candidates would be optimized in silico, but when produced and tested, the affinities of these compounds would be very different from what had been predicted.
Drug design was usually guided only through predictions of the ∆G of an interaction. As a result, enthalpic contributions were often overlooked, which resulted in disappointing lab results. These issues can now be resolved with the use of lTC in the drug development process. With the introduction of automated lTC equipment with high sensitivity and throughput capabilities in pharmaceutical screening labs, compounds with greater thermodynamic diversity will be utilized as starting points to enhance drug design. It may be possible, ultimately, to correlate structural data with the thermodynamics of complex formation, thereby making it possible to accurately predict binding processes from thermodynamic first principles.
Moreover, integrating the lTC data with those obtained from acoustic biosensors, surface plasmon resonance, and other techniques will allow a complete interrogation of the events taking place at the binding site. This degree of understanding will significantly impact on various fields such as drug discovery, drug delivery, diagnosis, and environmental monitoring.
Practical Applications
Figure 2a shows the signal produced by the sequence of injections, and Figure 2b displays the data obtained following integration of each injection peak. The design and analysis of an lTC experiment is shown by the titration of RNase A by cytidine monophosphate (2'CMP). In Figure 2b, the sigmoidal shape with many data points across the curved rise portion of the plot aids estimation of the midpoint of the transition, and therefore the stoichiometry of the binding reaction, which is a 1:1 ratio in this case. ∆H and Ka are calculated through iterative approximation. Combined with the quantified heat, these values are utilized to establish the average of ∆H.
The ∆H and the calculated concentration are used to determine an expected heat per injection, and the error square sum between the expected and quantified heat for each peak is calculated. Following this, the value of Ka is adjusted and the process is again carried out until a minimum error square sum is achieved.
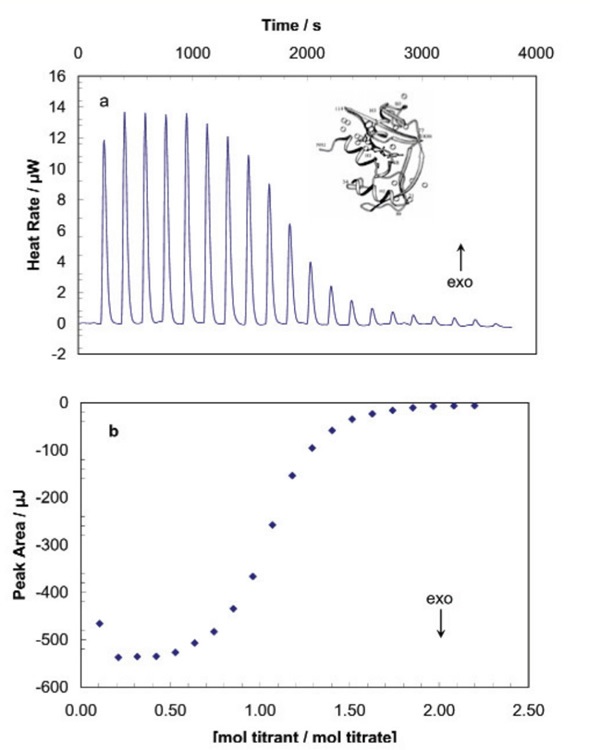
Figure 2. RNase A titrated with 2'-CMP in a TA Instruments ITC. RNase A was dialyzed (2 x 72h, 4°C} against 15mM potassium acetate buffer, pH 5.5, then the concentration of the protein was adjusted to 80μM. Ligand (1.58mM 2'-CMP) was prepared using the final dialysis buffer. RNase A was loaded into the 7.0mL sample cell and 2'-CMP was loaded into the 100μL syringe. Twenty, 5μL aliquots of ligand were titrated into the protein while the temperature of the system was maintained at 25°C. Figure 2a: The signal (heat) produced following each addition of inhibitor. Figure 2b: Integration of the heats over the time course of the experiment; the µJ in each peak are plotted against the mole ratio of titrant (inhibitor) to titrate (protein). 'Exo' depicts the sign convention for an exothermic reaction. Ko of 21-CMP binding: 1 x 10⁶M-1. Enthalpy of binding: -65KJ mol-1.
If the values of ∆H Ka, and n (stoichiometry) are all of interest, they can often be calculated from a single experiment, provided the ligand and macromolecule concentration are known precisely and selected so that:
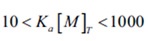
In case concentrations are not within this range, the curvature of the titration plot can be so high as to create a step-like profile, or so low as to be virtually linear. These scenarios are illustrated in Figure 3.
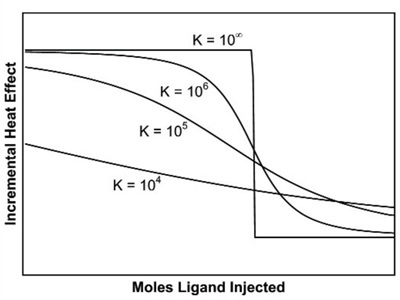
Figure 3. The effect of binding affinity on the shape of the titration curve for a reaction with 1:1 stoichiometry. In these simulations, reactant concentrations and DH were held constant while Ka was varied. Low affinity reactions give an essentially straight line, while high affinity reactions give a rectangular curve at the reactant concentrations chosen. In order to be able to estimate Ka accurately, the product of the macromolecule concentration (in mol L-1 and the association constant should be between 10 and 1000.
Another method is competitive binding, which can be used to determine very weak or very tight association constants. In a competition experiment, two ligands with different affinities compete for the same binding site on a macromolecule. In a standard experiment performed to determine the Ka of a weakly binding ligand, the weak binder would initially occupy half of the binding sites. Using lTC, the binding sites would be increasingly filled by a ligand that has a stronger affinity for the same site, thereby displacing the weaker ligand. This procedure would continue until the strongly binding ligand had saturated all the binding sites. The degree to which the first ligand was displaced by the second ligand will depend on the relative affinities and concentrations of the competing compounds. Once the Ka of the strongly-binding ligand is known, the Ka of the weak ligand can be easily calculated, without having to resort to the high concentrations otherwise needed.
Figure 4 shows an application of the competitive binding technique used for measuring the Ka of a weakly-binding ligand.
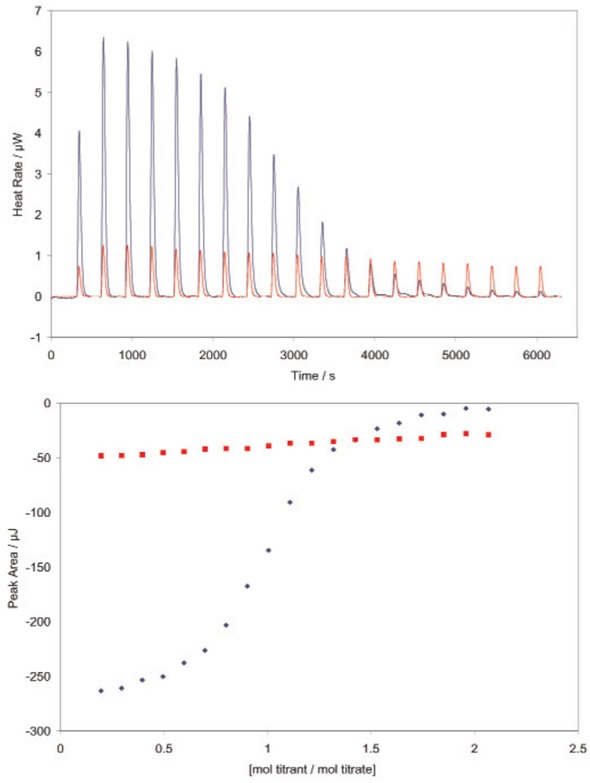
Figure 4 - Determining the binding constant of a very weakly binding ligand using a TA Instruments calorimeter. RNase A binds both 2’-CMP and 5’-CMP in the same binding pocket, but shifting the hydroxyl group from the 2’ to the 5’ position significantly decreases the binding affinity of the ligand. Red: incremental titration of 5’-CMP into RNase (950 μL 70μM RNase in the sample cell; 100μL 1.3mM 5’-CMP in the syringe titrated into the RNase solution in 20, 5μL increments). All solutions were prepared in 0.15mM acetate buffer, pH 5.5, and experiments were conducted at 25°C. Very low heat rates are obtained (top panel); integration of the heats over the time course of the experiment yields a line with little curvature (lower panel). Binding models fit to this data can only provide a rough estimate of the binding constant. Blue: Incremental titration of 2’-CMP into RNase prebound with 5’-CMP (950μL 70μM RNase prebound with 0.32μM 5’-CMP; 100μL 1.3mM 2’-CMP in the syringe titrated into the RNase solution in 20, 5μL increments. Solutions were prepared in the same buffer as above, experiment conducted at 25°C. The displacement titration yields significant heats of binding (top panel), providing a graph of integrated heats (bottom panel) that can be fit to the correct model (independent binding, stoichiometry of 1) using the NanoAnalyze software provided with the ITC. Knowing the binding constant for 2’- CMP (Figure 1) allows the binding constant of 5’-CMP (3100M-1) and the enthalpy of binding (-47kJ/mol) to be accurately calculated, without having to resort to high concentrations of RNase. Both values are in agreement with previous measurements (Velazquez Campoy and Freire, 2005). Note that the displacement experiment yields heat rates and integrated heats approximately half that obtained by the titration of 2’-CMP alone into RNase (Figure 2).
Conclusion
lTC is quickly becoming the preferred method for characterizing binding reactions. Small molecules binding to RNA, DNA, proteins, and polysaccharides can all be examined in a similar way, as can interactions between proteins, nucleic acids and proteins and between nucleic acids. The lTC is increasingly being used as a basic tool in biomedical and biochemical studies, owing to the precise evaluation of binding interactions that can be rapidly achieved without new assay protocols needing to be developed for each ligand or biomolecule. Moreover, the direct nature and high precision make the lTC approach invaluable for confirming the outcomes of less rigorous, high throughput assay protocols.
References and Further Reading
(Preference has been given to current references. Citation does not imply that a paper is necessarily the original reference to a study.)
- Andujar-Sanchez, M. et a/. (2005) Crystallographic and thermodynamic analysis of the binding of S-octylglutathione to the Tyr 7 to Phe mutant of glutathione S-transferase from Schistosoma japonicum. Biochemistry 44,1174-1183.
- Baker, B. M. and K. P. Murphy. (1996) Evaluation of linked protonation effects in protein binding using isothermal titration calorimetry. Biophys.J. 71, 2049-2055.
- Cliff, M. J. and J. E. Ladbury. (2003) A survey of the year 2002 literature on applications of isothermal titration calorimetry. J.Mol.Recognit.16,383-391.
- Cooper,M.A.(2003) Label-free screening ofbio-molecular interactions. Anal.Bioanal.Chern. 377,834-842.
- Eatough, D. J., E. A Lewis and L. D. Hansen. (1985) Determination of AHD and K values. p. 137-161. In K.R eq 1 Grime (Ed.) Analytical Solution Calorimetry. John Wiley and Sons.
- Gomez,J.and E.Freire.(1995) Thermodynamic mapping of the inhibitor site of the aspartic protease endothiapepsin. J.Mol.Bioi. 252,337-350.
- Holdgate,G. A.(2001) Making cool drugs hot: isothermal titration calorimetry as a tool to study binding energetics. BioTechniques 31,164-184.
- Hung,K-W.eta/. (2005) Solution structure of the ligand binding domain of the fibroblast growth factor receptor: role of heparin in the activation of the receptor. Biochemistry 44,15787-15798.
- Khalifah, R. G., F. Zhang, J. S. Parr and E.S.Rowe. (1993) Thermodynamics of binding of the CO2-competative inhibitor imidazole and related compounds to human carbonic anhydrase 1: an isothermal titration calorimetry approach to studying weak binding by displacement with strong inhibitors. Biochemistry 32, 3058-3066.
- Ladbury, J. E. (2001) Isothermal titration calorimetry: application to structure-based drug design. Thermochim. Acta 380, 209-215.
- Leavitt, S. and E. Freire. (2001) Direct measurement of protein binding energetics by isothermal titration calorimetry. Curr.Opin.Struct.Bioi. 11,560-566.
- Luque,I.and E.Freire.(2002) Structural parameterization of the binding enthalpy of small ligands. Prot.- Struct. Funct. Genet. 49,181-190.
- O'Brien, R., J. E. Ladbury and B. Z. Chowdry. (2001) Isothermal titration calorimetry of biomolecules. p. 263-286. In S. E. Harding and B. Z. Chowdry (Eds.) Protein-Ligand Interactions: hydrodynamics and calorimetry. Oxford University Press, Oxford.
- Privalov, G. P. and P L. Privalov. (2000) Problems and prospects in microcalorimetry of biological macromolecules. Meth.Enzymol. 323,31-62.
- Sigurskjold, B. W. (2000) Exact analysis of competition ligand binding by displacement isothermal titration calorimetry. Anal.Biochem. 277,260-266.
- Tellinghuisen, J. (2005) Optimizing experimental parameters in isothermal titration calorimetry. J.Phys. Chem.B 109,20027-20035.
- Valazquez Campoy, A. and E. Freire. (2005) lTC in the post-genomic era...? Priceless. Biophys. Chern. 115,115-124.
- Weber, P C. and F. R. Salemme. (2003) Applications of calorimetric methods to drug discovery and the study of protein interactions. Curr.Opin. Struct. Bioi.13, 115-121.
- Wiseman,T.,S. Williston,J. F. Brants and L. N. Lin. (1989) Rapid measurement of binding constants and heats of binding using a new titration calorimeter. Anal. Biochem. 179,131-137.
- Wylie, G. P et a/. (2005) Prolylpeptide binding by the prokaryotic SH3-Iike domain to the diphtherial toxin repressor:a regulatory switch. Biochemistry 44,40-51.
- Zhang, Y-L and Z-Y Zhang. (1998) Low-affinity binding determined by titration calorimetry using a high affinity coupling ligand: a thermodynamic study of ligand binding to protein tyrosine phosphatase 1B1. Anai. Biochem. 261,139-148.
About TA Instruments
TA Instruments' reputation for high technology products, quality manufacturing and unbeatable after sales support is why more customers recommend TA products to their colleagues around the world. Headquartered in New Castle, DE, TA Instruments prides ourselves in the technical competence and professionalism that our sales force offers. We are the only thermal analysis, rheology, and microcalorimetry supplier recognized worldwide for our prompt, courteous and knowledgeable service staff, the hallmark of our company. Our technical support group is committed to handling all of your thermal analysis and rheology needs, and is available by phone, email and through the internet.
Sponsored Content Policy: News-Medical.net publishes articles and related content that may be derived from sources where we have existing commercial relationships, provided such content adds value to the core editorial ethos of News-Medical.Net which is to educate and inform site visitors interested in medical research, science, medical devices and treatments.