 Context-based Analysis
StrataQuest is TGs most evolved image processing solution for both brightfield and fluorescence images.
It can automatically detect most tissular structures on a digital slide. It integrates detected objects into detailed context-based quantitative analysis.
The software is also an ideal image processing environment for clinicial researchers and dedicated image processors.
There are well over 50 StrataQuest APPs (modules, number constantly growing) which can be used for automated analysis.
StrataQuest is integrated into the following TG analysis systems:
- TissueFAXS Fluo
- TissueFAXS Histo
- TissueFAXS PLUS
- TissueFAXS 120
- TissueFAXS 120 PLUS
- TissueFAXS i Fluo
- TissueFAXS i Histo
- TissueFAXS i PLUS
- TissueFAXS Confocal
 StrataQuest is also available as a standalone software.
 StrataQuest has importers for the following digital image or slide formats:
- 3D Histech (.mrxs)
- Hamamatsu (.ndpi)
- Zeiss Axio Scan (.czi)
- Yokogawa CQ1 Confocal scanner
- Aperio scanners (.svs)
- Leica (.scn)
- Keyence
- Perkin Elmer (.qptiff)
- Images (.jpeg, .tif, .bmp, .png)
StrataQuest - as easy as you need it, as powerful as you want it...
StrataQuest packs unprecedented analysis performance into a well organized interface.
It also puts it at the fingertips of users who do not have the experience, specialised mathematical know how or simply the time for high level image analysis.
Easy - It is all done with APPs!

A StrataQuest APP is simply an analysis solution for a specific task. It is complete up to the point of providing the specific analysis results ready to be exported to, e.g., Excel or CSV formats.
This is complemented by an export function for all images from the software.
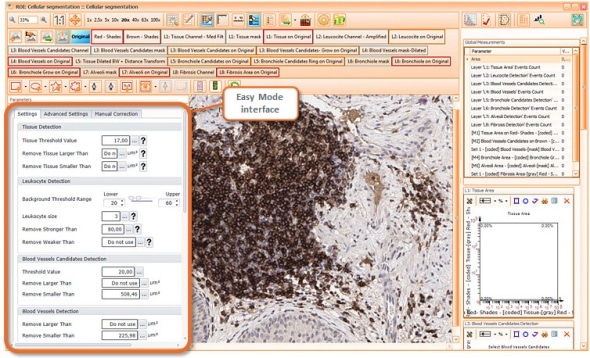
The core feature of an APP is a simplified, tabbed "Easy Mode" user interface. While an APP is meant to be run by simply clicking the "Analyse" button, the interface allows the user to make adaptations to sample/staining variance if necessary.
TGs decade-long experience in providing analysis solutions to the biosciences market has tought that vaunted "only one click" products work - but only on the textbook quality image on which they are presented.
To boldly analyse what has not been analysed before
StrataQuest advanced features allow more experienced users to build their own solutions.
The ideal tool to do this is StrataQuests logically structured Advanced Mode interface and highly adaptable sample viewer.
Solutions created in Advanced Mode can be given an Easy Mode interface and saved as APPs for others to use.


This capability, together with the possibility to plug in Matlab, ImageJ and FIJI solutions also make StrataQuest an ideal tool for imaging core facilities.
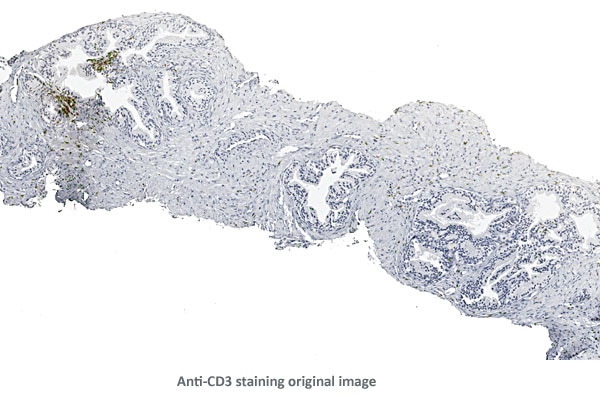
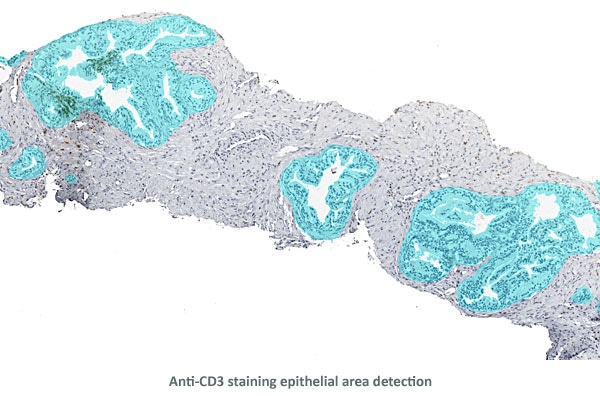
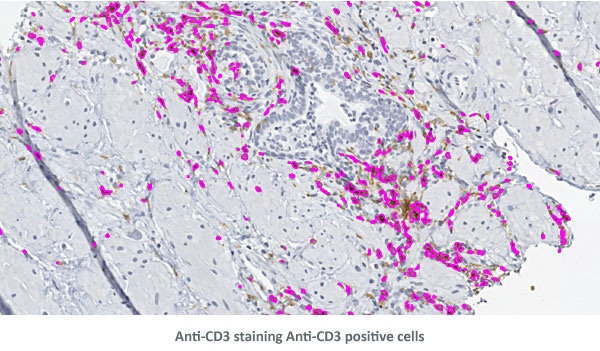
Anti-CD3 positive cells in epithelial and interstitial tissues
The aim of the project was to quantify the distribution of anti-CD3 positive cells in and around the epithelial areas of prostate biopsies from a clinical study.
The biopsies were provided by the Medical University of Vienna.
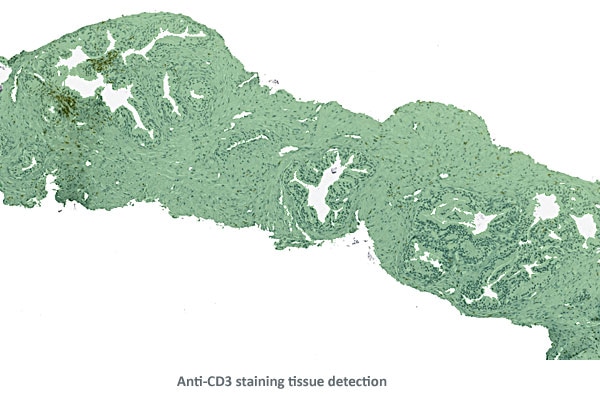
Tissue detection was the first step in the solution.
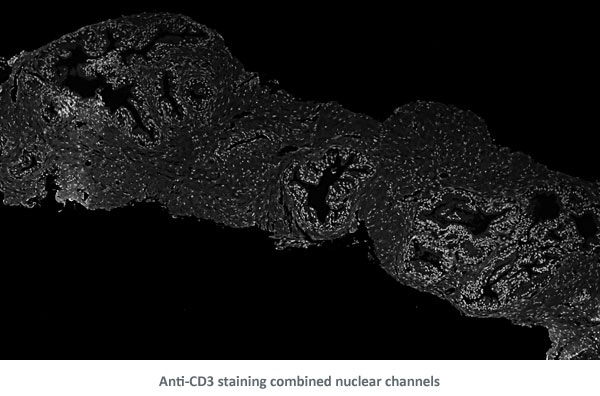
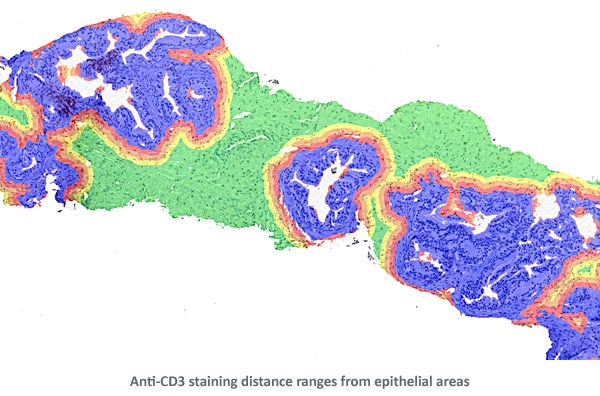
In a second step a composite image of both brown and blue channels was created.
Then, a density map of the nuclei was created to determine areas with denser and larger nuclei.
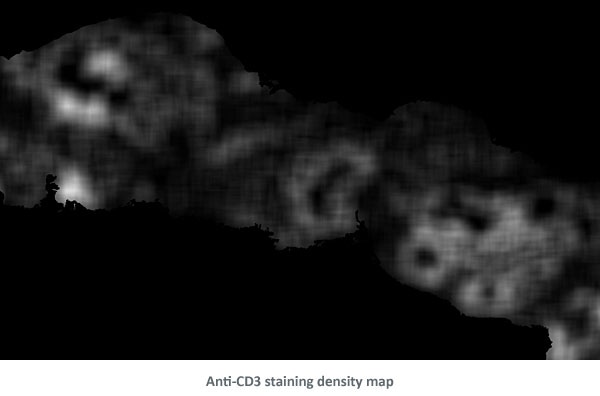
Based on the density map the epithelial areas were detected and cleaned.
Finally, distance ranges were projected from the perimeters of the epithelial areas for distance measurements of Anti-CD3 positive cells.
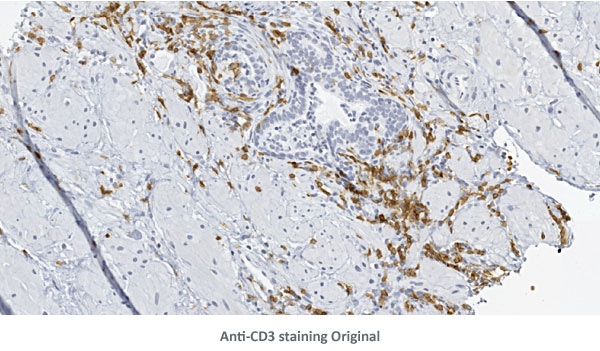
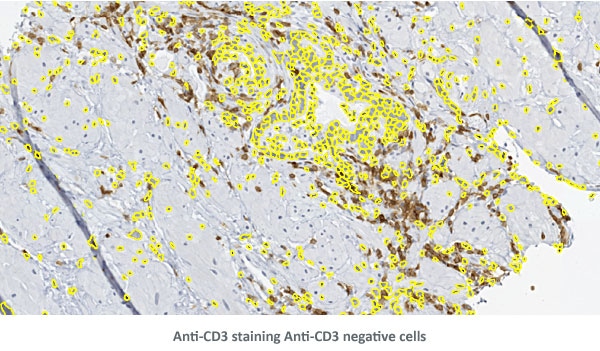
Detailed View
The three detailed view images below show the detection of nuclei and Anti-CD3 staining.
90 antigens + detected morphological structures + identified cell types = ?
Multi -epitope ligand cartography (MELC) is a technology using samples subjected to cycles of fluorescent staining, imaging and photobleaching. Each cycle can use an antibody for a different protein. The result is a set of images of the distributions of many proteins for the same sample.
StrataQuest is ideal to fully address the immense potential of such samples with automated context analysis.
A MELC sample of skin from a melanoma patient was analyzed. The aim was to quantify the expression of all 90 proteins in close proximity to Melan-A positive areas. Some operation result images are shown below.
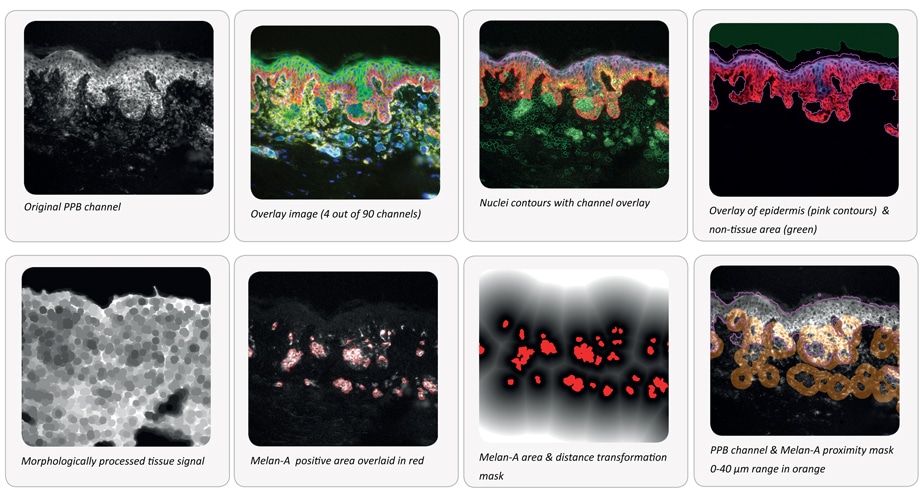
The possibilities of the combination of cyclic stain-bleach methods and StrataQuest context-based analysis are almost endless.
Which protein increases in its expression density and which one decreases in relation to its distance to:
Normal melanocytes, Melanoma cells, Blood vessels, Inflammation sites, Sweat glands, Hair follicles, Basal membrane, Langerhans cells, Intraepithelial T-cells, Regulatory T-cells?
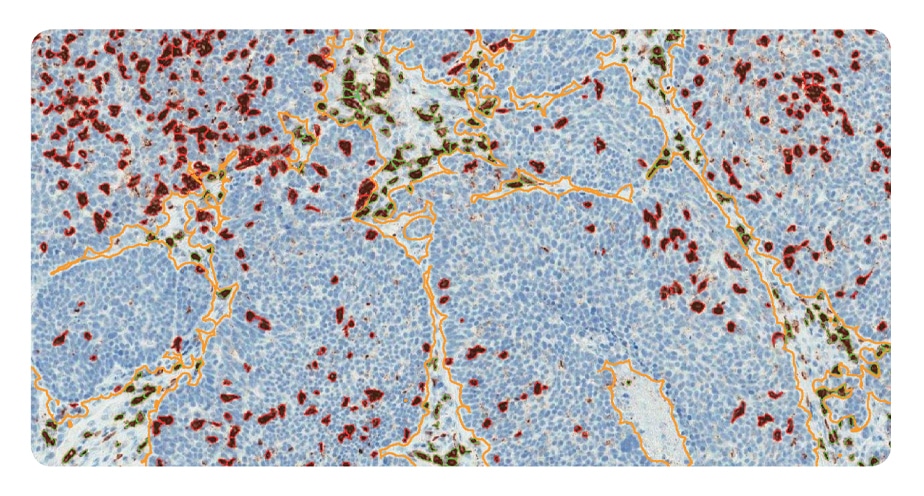
Strataquest stroma and tumor detection on morphological stains
One of the main strenghts of StrataQuest is the capability to segment morphological structures based on a morphological stain alone (i.e. without a specific staining of the structure to be detected).
In the case shown this was used to detect thin areas of stroma between tumor areas in a tumor sample stained immunohistochemically for CD8+ T-cellls with a Hematoxylin counterstain. The counterstain was used for stroma detection.
The images show major steps of the automated analysis process.
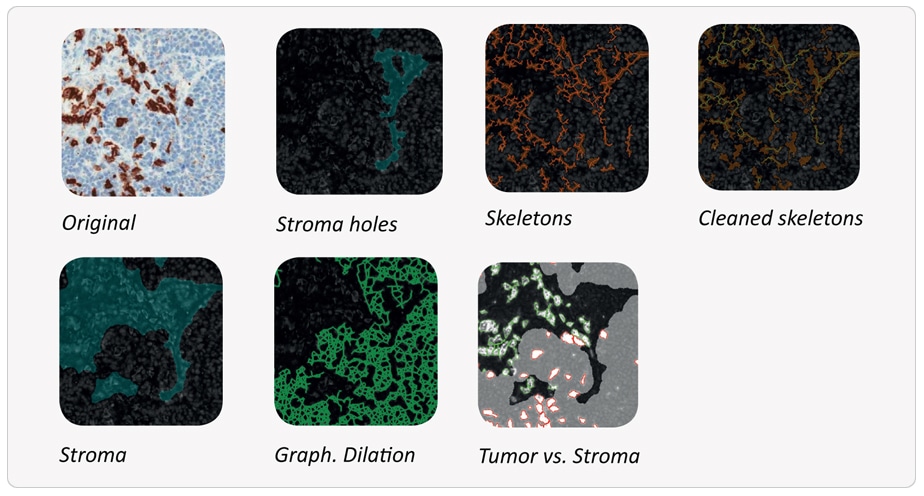
Final result:
Stroma areas were detected using the hemalaune counter stain only and it was shown that 17,3% of the sample are stroma (orange outline). 22% of CD8+ T-cells are located in stroma areas (outlined in green).
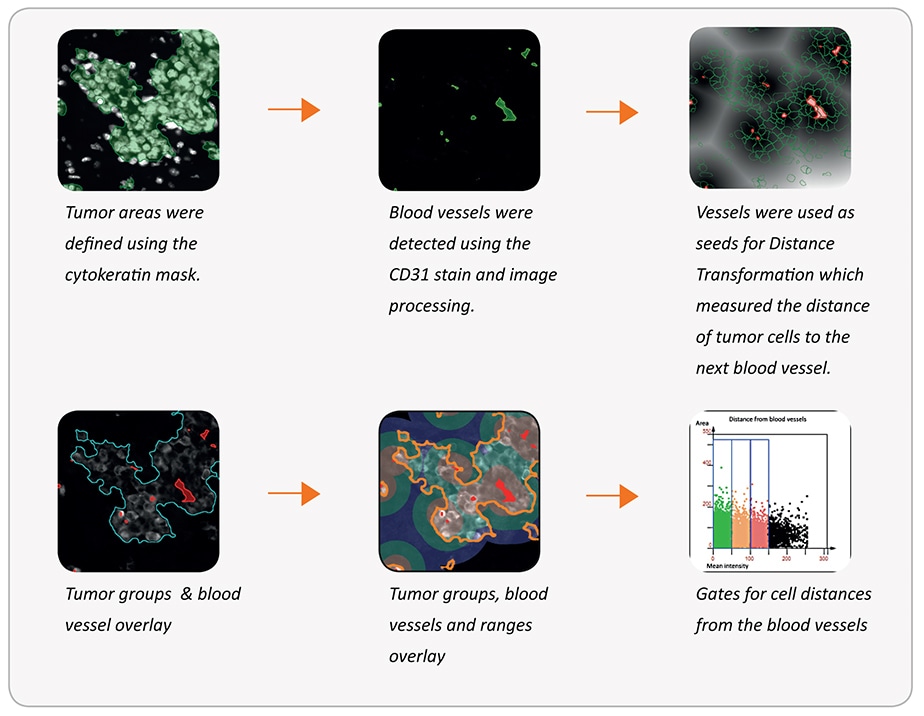
Distance of tumor cells from blood vessels
The same morphological differentiation capabilities can also be used on immunofluorescent samples.
Tumor areas are detected using anti-cytokeratin+ cells. Blood vessels are detected using anti-CD31 + structures. The distance of tumor cells from blood vessels within the tumor areas can then be measured.
Some basic steps of the analysis are shown below.
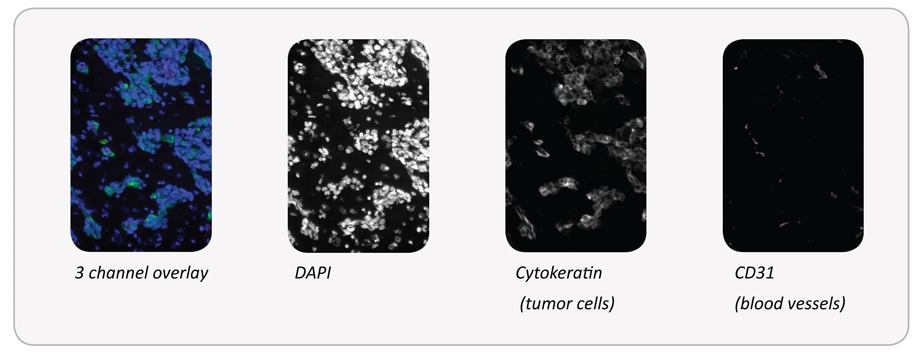
Final result: Number of tumor cells within each distance range of a blood vessel: 0-50 μm: 6.988/52%; 50-100 μm: 3.483/26%; 100-150 μm: 1.845/14%
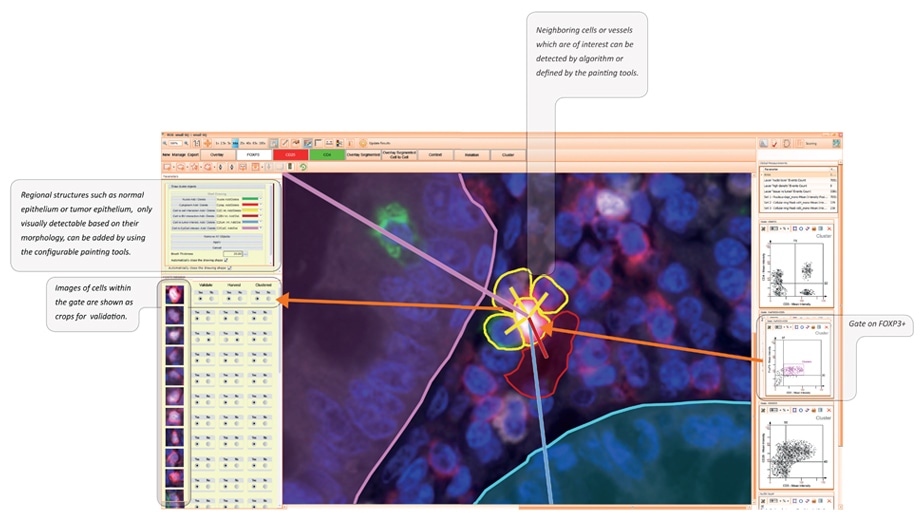
Cell sorting and cell cluster features
StrataQuest provides a special dual purpose feature set.
One purpose is visually sorting and marking specific cell types for , e.g., harvesting in the TissueFAXS SORT system.
The other purpose is detecting and analysing small cell subunits within a larger organ („clusters“in the StrataQuest nomenclature). Clusters are defined by a specific central cell (phenotyped by its staining) and the other cluster cells by distance and optionally also by specific staining.
The image below describes the main parts of both workflows on the basis of a colon sample stained with DAPI and for FOXP3, CD25 and CD4.