Experience sub-500 nm O-PTIR featuring integrated fluorescence and simultaneous Raman spectroscopy with the mIRage-LS, a global first in microscopy systems.
- Fluorescence microscopy and O-PTIR spectroscopy with submicron resolution positioned together
- Fast fluorescence identification and imaging of cells, tissues, bacteria
About mIRage-LS
The mIRage-LS sub-500nm O-PTIR platform transforms life sciences investigations by merging co-located O-PTIR and fluorescence microscopy.
Fluorescence microscopy delivers molecular specificity, while vibrational spectroscopy (IR and Raman) affords spatially detailed characterization of macromolecules. The combination of these methodologies allows researchers to examine biological specimens with unparalleled precision.
The integration of the mIRage-LS sub-500 nm O-PTIR resolution, along with concurrent Raman spectroscopy and co-located fluorescence, allows for correlative imaging at scales less than 500 nm.
This cohesive, registration-free system combines these techniques, providing a pathway to obtain profound molecular insights and facilitating groundbreaking discoveries that could not be achieved through the independent application of either technology.
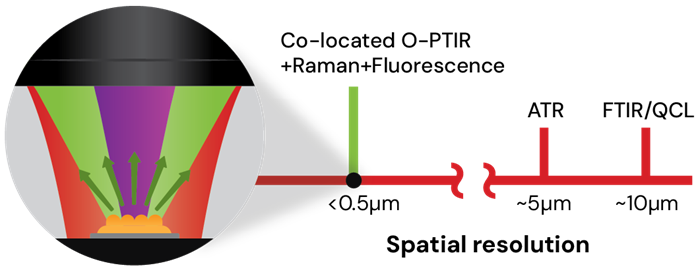
Image Credit: Photothermal Spectroscopy Corp
Co-located fluorescence and submicron IR of cells
Neuroglioma cells were labeled using G3BP1 to identify protein stress granules, DAPI for the nucleus, and BODIPY to detect lipids.
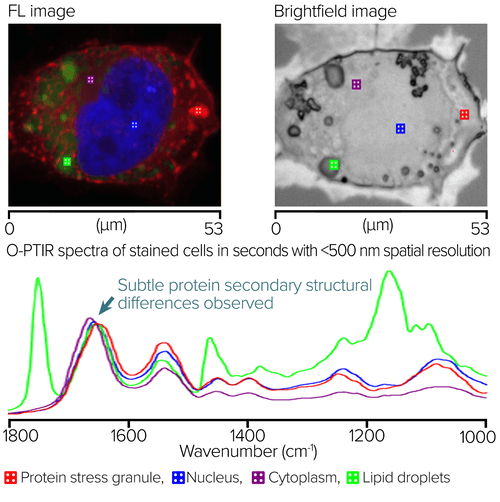
RBG overlay widefield epi-fluorescence image with red showing protein stress granules, blue showing the nucleus, and green showing lipids. Square markers show locations of O-PTIR spectral collection. Image Credit: Photothermal Spectroscopy Corp
The image on the right side illustrates the brightfield view. Square indicators represent the areas where O-PTIR spectra were gathered.
The O-PTIR spectra were gathered within seconds from the marker positions displayed in the left and middle panes. Distinct spectral variations can be identified, aligning with the aimed sub-cellular characteristics. Notably, there is a slight alteration in the Amide I band of the protein stress granule, suggesting a possible variation in protein secondary structure compared with other locations.
Want to know more? Speak to an expert
mIRage-LS applications
Tissue and cell imaging
- Single cells: Normal/diseased cell differentiation, drug-cell interactions, intracellular (lipid droplet) imaging studies
- Tissues: Cell typing, calcifications, disease state, collagen orientation
- Bacteria: Bacterial identification at the single cell level, cell metabolism studied with stable isotopic labeling (13C, 15N, Deuterium)
Image Credit: Photothermal Spectroscopy Corp
mIRage-LS uses co-located fluorescence to localize O-PTIR measurements
A section of brain tissue from a mouse model of Alzheimer’s disease was stained with Amytracker 630 to emphasize amyloid aggregates, AF488 to illustrate proteins, and DAPI to mark the nucleus.
The figure below displays a brightfield image of the stained specimen. In the upper-right corner is the RBG composite fluorescence image, which highlights areas of amyloid aggregation in red/orange. It is noteworthy that certain amyloid aggregates marked in the fluorescence image are not easily identifiable in the brightfield image.
Presented below is an averaged O-PTIR spectrum derived from the line profile depicted in the fluorescence image. The spectra were averaged both in the presence of the aggregate (blue) and in its absence (red).
The average spectrum of the aggregate reveals notable variations within the amide I band, highlighting a prominent feature at 1631 cm-1, characteristic of protein beta-sheet configurations.
This distinctly illustrates the advantages of integrating fluorescence imaging to illuminate areas of amyloid aggregation, certain aspects of which may not be easily observable through brightfield microscopy, alongside submicrometer O-PTIR spectroscopy, which is capable of offering molecular composition data.
In this instance, it is notably responsive to the secondary structure of proteins, a notable strength associated with IR spectroscopy.
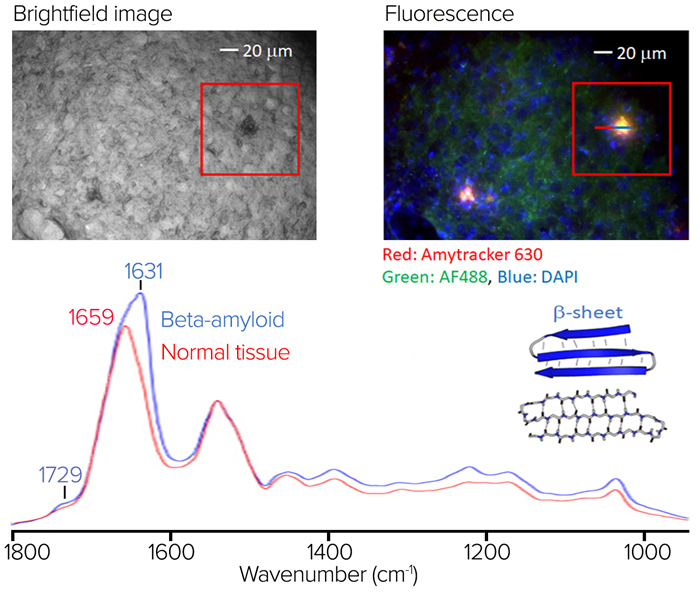
Image Credit: Photothermal Spectroscopy Corp