The hot melt extrusion (HME) process can be employed in the production of a wide range of pharmaceutical dosage forms, including capsules, tablets, lozenges and implants. HME is suitable for both immediate release and sustained release formulations.
Much like spray or freeze drying, the melt extrusion process can be used to achieve solid dispersions allowing the drug to be embedded in a polymeric carrier. This solid dispersion, therefore, enables the drug to be dispersed into the amorphous or crystalline state or even dispersed on a molecular level within the polymer.
When a molecular dispersed drug is used in a carrier, this solid solution can lead to an increase in dissolution rate, solubility and bioavailability.
An increasing number of poorly soluble drugs are being passed from high throughput screening of drug development departments to formulation development laboratories, prompting increased interest in the hot melt extrusion process.
Melt extrusion is a relatively recent process in the pharmaceutical industry, meaning that it is more commonly employed in formulation development than in the production environment.
The ability to accommodate this type of continuous melt extrusion process requires a thorough understanding of the impact of process parameters on the final product.1,2
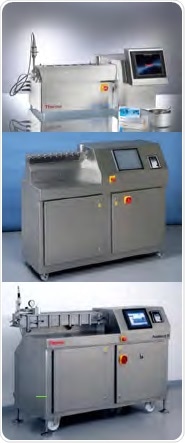
Overview of parallel twin screw extruders (top: Pharma 11 with 11 mm, middle: Pharma 16 with 16 mm, and bottom: Pharma 24 with 24 mm screw diameter). Image Credit: Thermo Fisher Scientific – Materials & Structural Analysis
The study presented here aimed to develop a more comprehensive understanding of the impact of process parameters on a material’s residence time distribution within the extruder and the specific mechanical energy consumption (SMEC).
The study also aimed to explore the potential for upscaling this process from a lab-scale to a production line extruder.
To reduce development time and material requirements, the opportunity of predictability of the scaleup step was determined using a design of experiments approach.
Soluplus® was extruded on three sizes of a co-rotating twin-screw compounder. These extrusions utilized different process settings and followed a specific design-of-experiments plan.
The residence time distribution – a key process parameter – was measured via a tracer in each setup, while the SMEC was calculated.
Standard parameters were also measured; for example, the temperature of the melt at the extruder die, torque and pressure at the die.
The mean residence time was calculated using the residence time distribution, which was obtained by using a photometric and a colorimetric method to measure the concentration of a color pigment.
Data of the three independent design-of-experiments was analyzed via variance (ANOVA), using the resulting multi-dimensional regression models to calculate the design spaces. These spaces were compared to evaluate their overlap between the different scales of the extruders.
Material and methods
Material
Soluplus® is a polyvinylcaprolactam–polyvinylacetate–polyethyleneglycol graft copolymer (BASF SE, Ludwigshafen, Germany) that is typically employed as a polymeric carrier.
It features an amphiphilic structure designed to increase the solubility of poorly soluble substances used in the HME process. Ferric trioxide is utilized as a tracer due to its intensive red color.
Parallel, co-rotating twin screw extruders
Three sizes of parallel twin screw extruders were utilized to simulate the inherent scalability of the HME process. These were a Pharma 11 (for a lab-scale extruder), a Pharma 16 (for medium scale) and a Process 24 (for production scale, Thermo Fisher Scientific, Karlsruhe, Germany).
Table 1. Different feed rates used on different twin screw extruder sizes. Source: Thermo Fisher Scientific – Materials & Structural Analysis
| Throughput [kg/h] |
min |
mid |
max |
| Pharma 11 |
0,17 |
1,33 |
2,40 |
| Pharma 16 |
0,50 |
4,00 |
7,50 |
| Process 24 |
1,13 |
6,60 |
12,00 |
The index highlights the screw diameter, while each individual barrel has a length of 40 L/D. Settings were varied to a minimum, midpoint and maximum value for the screw speed (100 rpm, 300 rpm, and 500 rpm), the feed rate (Table 1) and the temperature program (130 °C, 165 °C and 200 °C).
The feed rate for the various extruder sizes has been calculated in dependence on the work of Schuler (Equation 1).3
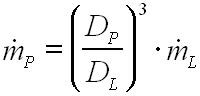 |
Equation 1. Empirical equation of Schuler |
Screw setup for all experiments was kept constant with two mixing sections (Figure 1).

Figure 1. Setup of screws and barrel used for the scaleup experiments on the Pharma 11, Pharma 16, and Process 24 extruders. At the feeding section (right) the Soluplus® and the pigment are added at a given time T0. The degassing section (left) provides atmospheric degassing to allow water vapor to evaporate out of the polymer. Image Credit: Thermo Fisher Scientific – Materials & Structural Analysis
Measurement of residence time
Pigment – acting as a tracer - was added to the hopper of the feeding section at a pre-defined time (T0). Color concentration is then measured at the die over time.
The picture method sees a picture of the strand is taken every 0.2 seconds, and defined size of the strand is detected on every picture, in terms of the amount of red pixel (Figure 2).
The IR method utilizes the ExtruVis 2 colorimeter (developed by A. Gryczke) to conduct in-line measurements of pigment concentrations in the melt at the die exit.
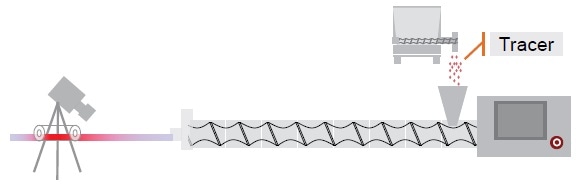
Figure 2. Residence time distribution measurement setup. Image Credit: Thermo Fisher Scientific – Materials & Structural Analysis
Software for data analysis
The experiments were planned using the Visual X-Sel 11.0 (CRGRAPH, C.U. Ronniger, Germany) software with a Design of Experiments (DoE) module. A module for multi-dimensional regression models was used to calculate the prediction, with the calculation optimized using MS Excel 2010 (Microsoft).
Results
To facilitate successful upscaling, it is necessary to ensure an identical experience for the material on the lab-scale extruder and the larger production-scale extruder. The residence time of the material within the extruder must also be identical to ensure effective melting and mixing while avoiding degradation.
This is a particularly important consideration when working with very low feed rates, as it is essential to ensure the tracer itself does not impact the process or the measurement of the residence time distribution.
For example, when working with the low feed rates of the lab-scale 11 mm extruder that has a throughput of 0,17 kg/h, less than 50 mg is fed into the extruder every second.
If the tracer level is too high, the feed rate value will be higher at the point the tracer is added, therefore, impacting every other parameter depending on the feed rate.
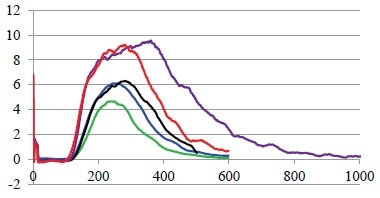
Figure 3. Influence of tracer concentration. Green: 0.1 g, blue: 0.2 g, black: 0.3 g, red: 0.5 g and purple 1.0 g of tracer were added to the Pharma 16 with constant parameter and constant feed rate. Image Credit: Thermo Fisher Scientific – Materials & Structural Analysis
To mitigate this issue and determine the influence of tracer concentration, residence time distribution was measured with identical process settings while varying the amounts of tracer (Figure 3).

Figure 4. Influence of feed rate and SMEC on the residence time distribution. Orange: lab scale extruder (11 mm), blue: midsize extruder (16 mm), continuous line: feed rate calculated by Schuler, dotted line: feed rate adjusted regarding SMEC. Image Credit: Thermo Fisher Scientific – Materials & Structural Analysis
During the initial upscaling experiments, the feed rate was only calculated using Schuler’s equation. Throughput was found to increase from 1 kg/h to 3 kg/h when changing from a 11 mm screw diameter to an extruder with a 16 mm diameter (Figure 4).
When increasing the feed rate using Schuler’s equation, residence time distribution was found to be similar on the next scale of extruder. Here, the distribution is narrower and slightly shorter than that of the lab-scale extruder.
It was also noted that residence time distribution matched perfectly when matching the SMEC (specific mechanical energy consumption).4
 |
Equation 2. Calculation of the specific
mechanical energy consumption (SMEC) |
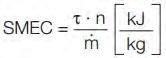
τ: torque [Nm]
n: screw speed [rpm]
ṁ: throughput [kg/h]
During the next stage of the study, a DoE approach is used to explore the knowledge space of the used extruder sizes. An ANOVA was conducted to describe the design space via multiple regression, allowing the design space of the other sizes to be calculated.
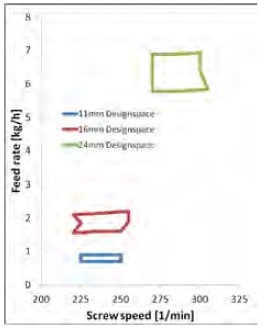
Figure 5. The design space of different sizes twin screw extruder, calculated from the 11 mm scale extruder via regression model. Image Credit: Thermo Fisher Scientific – Materials & Structural Analysis
This regression model was further employed to calculate the design space from the 11 mm lab scale to the 24 mm production scale. This model was matched in terms of residence time, SMEC and melt temperature (Figure 5).
To upscale from the design window of the Pharma 11 to the Pharma 16, it was only necessary to adjust the feed rate to a larger size. Upscaling to a 24 mm system required the feed rate to be adjusted alongside an additional increase in screw speed.
These examples highlight a limitation of the upscaling process. Increasing extruder equipment size saw the surface area increase by the power of two, increasing feed rate saw this volume increase by the power of three.
Increasing extruder size led to the ratio between the surface area to introduce heat and cooling energy to the system to the volume of the material decrease. This is why additional energy is needed by increasing screw speed. The design space windows also grew in line with increasing upscaling steps.

Figure 6. Overview of the correlation between the VSFL and the SMEC. Shown are the figures from Lab to Line extruder equipment (top: 11 mm, middle: 16 mm, bottom: 24 mm). The different colors are linked to different barrel temperatures: Blue: 130 °C, yellow: 165 °C, red: 200 °C. Image Credit: Thermo Fisher Scientific – Materials & Structural Analysis
This study also highlighted the correlation between the SMEC and the degree of extruder filling (Figure 6) - effects that can be explained using the SMEC equation.
Increasing feed rate results in increasing VSFL, which, in turn, decreases mechanical energy input. This is because there is more material sharing the mechanical energy supplied by the system.
It should also be noted that SMEC decreases with increasing barrel temperatures because these increasing barrel temperatures cause a decrease in material viscosity and, therefore, the torque and SMEC (Equation 2).
Conclusions
It was possible to calculate a design space for each of the three extruder scales based on residence time distribution and specific mechanical energy consumption.
This study highlighted that residence time distribution and specific mechanical energy consumption are essential parameters in ensuring the successful upscaling of a pharmaceutical melt extrusion process.
It was also highlighted that the amount of tracer used had a notable impact on the residence time distribution measurement.
References
- Breitenbach, J. Melt extrusion, from process to drug delivery technology, European Journal of Pharmaceutics and Biopharmaceutics, 2002.
- Douroumis, D. Hot melt Extrusion - Pharmaceutical applications, Willey 2012.
- Bogun, M. Untersuchungen zur kontinuierlichen Herstellung von Kautschukmischungen basierend auf Rubber/Filler-Composites am Doppelschneckenextruder, Thesis Hallee Germany, 2005.
- Kohlgrüber, K. Der gleichläufige Doppelschneckenextruder, Carl Hanser Verlag, 2007.
Acknowledgments
Produced from materials originally authored by Katharina Paulsen and Dirk Leister from Thermo Fisher Scientific; and Andreas Gryczke from BASF SE.
About Thermo Fisher Scientific – Materials & Structural Analysis
 Thermo Fisher Materials and Structural Analysis products give you outstanding capabilities in materials science research and development. Driving innovation and productivity, their portfolio of scientific instruments enable the design, characterization and lab-to-production scale of materials used throughout industry.
Sponsored Content Policy: News-Medical.net publishes articles and related content that may be derived from sources where we have existing commercial relationships, provided such content adds value to the core editorial ethos of News-Medical.Net which is to educate and inform site visitors interested in medical research, science, medical devices and treatments.