Cell culture is a complex and involved process. Its success relies on the balance of many important process parameters to provide ideal process conditions for optimal cell growth, maintenance, and target product production.
Viable cell density (VCD) is a key performance indicator (KPI) of the effect of the critical process parameters on the culture’s operational performance.
Trends in VCD frequently correlated with product quality and yield. VCD metrics are typically used to determine the timing of specific process actions, including seed transfer, inoculation, nutrient feeding, and culture harvest. This ensures optimal culture titer and productivity.
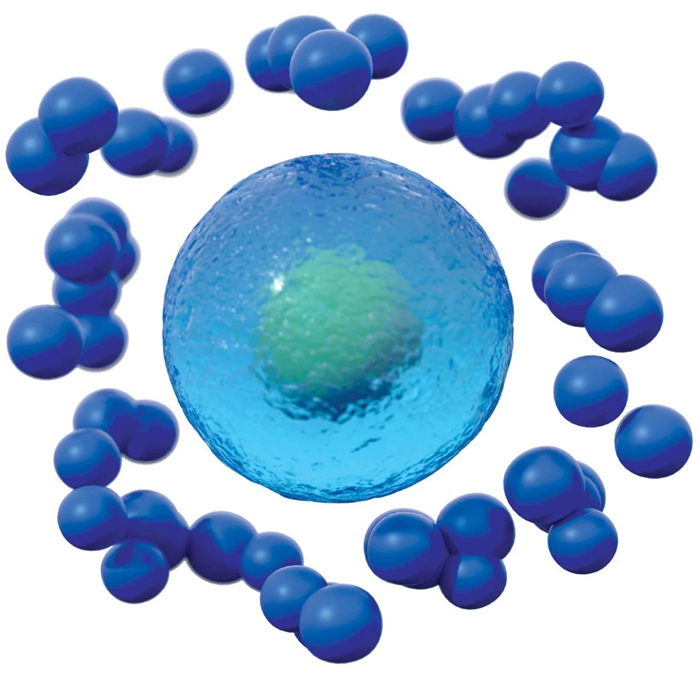
Image Credit: Hamilton Company
Following the FDA-directed need for improved Process Analytic Technologies (PAT), traditionally off-line VCD measurements are starting to be phased out by continuous in-line measurement technologies.
Historically, measuring VCD has been carried out exclusively off-line using cell-staining methods in combination with flow cytometry or imaging analysis for the quantification of the concentration of live cells in a representative grab sample. Trypan blue cell staining is the oldest and most employed technique for off-line measurement of VCD.
Trypan blue counting uses membrane exclusion staining alongside an image-based technique to count how many viable cells and stained dead cells are present. The simplicity of this approach makes Trypan blue a low-complexity solution for acquiring VCD counts.
However, Trypan blue, as well as other off-line measurement technologies, have limitations that hinder the complete implementation of recent FDA Process Analytical Technology (PAT) guidelines, including the limited frequency of sampling, the labor-intensive manual efforts, and the effect of sampling on the sterility of the culture.
In-line technologies are employed to measure VCD in real time to reduce the reliance on off-line sampling methods. These technologies maintain culture sterility while delivering more data and involving less manual intervention.
There are currently multiple in-line sensor technologies on the market that enable real-time in-line VCD quantification, each with different measurement principles and generated data.
Examples of such in-line technologies include the following:

Image Credit: Hamilton Company
- Imaging technologies like the Ovizio Imaging System use 3D digital holographic microscopy for the quantification of VCD by phase changes of light passing through cells.
The technology is “chemically label-free” in the determination of viable cells relative to off-line imaging methods and can offer additional information on the metabolic state of cells without relying on chemical marker efficacy.14
However, advanced algorithms are required for the data dissemination and interpretation required for digital holographic microscopy.
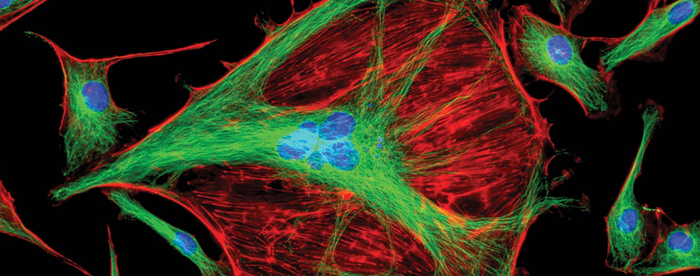
Image Credit: Hamilton Company
- In-situ spectroscopy, such as fluorescence or Raman spectroscopy, uses laser excitation for the estimation of VCD quantities, in addition to capturing important information regarding the chemical makeup in culture.1
Although spectroscopy techniques provide significant in-process data, they are dependent on calibration and dataset training and demand rigorous analysis to create actionable datasets.
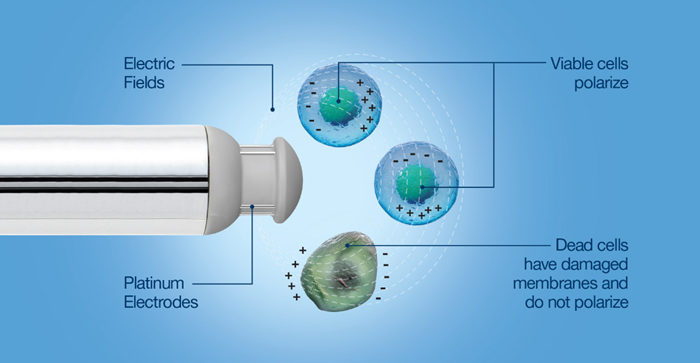
Image Credit: Hamilton Company
- Biocapacitance sensors are dependent on the principle of dielectric spectroscopy, measuring the storage of electric charge, or capacitance, obtained from the polarization of live cells within a culture. When this storage of electric charge is applied to cells, it is referred to as biocapacitance.
The permittivity measure of the cells within a culture is utilized to estimate the overall viable cell concentration. The frequency-dependent cell response within the dielectric field can be used to obtain cell-specific shifts in physiology that cause cell biovolume changes.
Biovolume varies from viable cell count or concentration as it refers to the total volume of viable cells, i.e., larger cells comprise a proportionally larger part of the signal than the same quantity of smaller cells.
Biocapacitance is simple in measurement principle and data output, and it offers the direct measurement of viable cell biovolume. If a cell count is the desired output, the viable cell biovolume may be correlated to a known VCD reference to account for cell geometry.
These in-line sensor technologies each have distinct advantages and disadvantages in complexity and generated data, which makes selecting the best technology for a process somewhat challenging.
This article presents a case for employing biocapacitance as a robust and easy-to-implement VCD measurement technology, with or without other measurement tools, and discusses the differences between biocapacitance-derived and off-line VCD measurements.
If the results of the measurements differ, this is due to different aspects of the same culture being measured.
Permittivity-based viable cell density for cell culture monitoring
In-line permittivity sensors are typically easily implemented within a cell culture. The measurement technology does not demand training datasets or process calibration.
The measurement is not impacted by changes in media contributions and typically requires minimal data processing or complex modeling to generate a VCD measurement.
This makes the measure of permittivity a well-suited in-line measurement for modification for legacy processes or applications that are validated around precise off-line measurement numbers, requiring minimal effort for the correlation of permittivity measurements and off-line VCD values.
Various process scales may be used with permittivity measurements, enabling permittivity-derived metrics at one scale to be directly transferred with scale-up or scale-down activities.
At present, permittivity has been successfully implemented in many cell lines and applications. The Hamilton Cell Density eBook describes examples of popular cell types and applications.
When off-line VCD and in-line permittivity do not correlate
The implementation of in-line permittivity in an established process requires the comparison of the permittivity signal to historical off-line VCD values as a step towards employing permittivity signal as a proxy for a continuous viable cell count.
Permittivity signal trends are often linearly correlated to off-line VCD metrics. However, there are cases where the difference in measurement methods between permittivity measurements and off-line VCD can lead to varying degrees of measurement correlation.
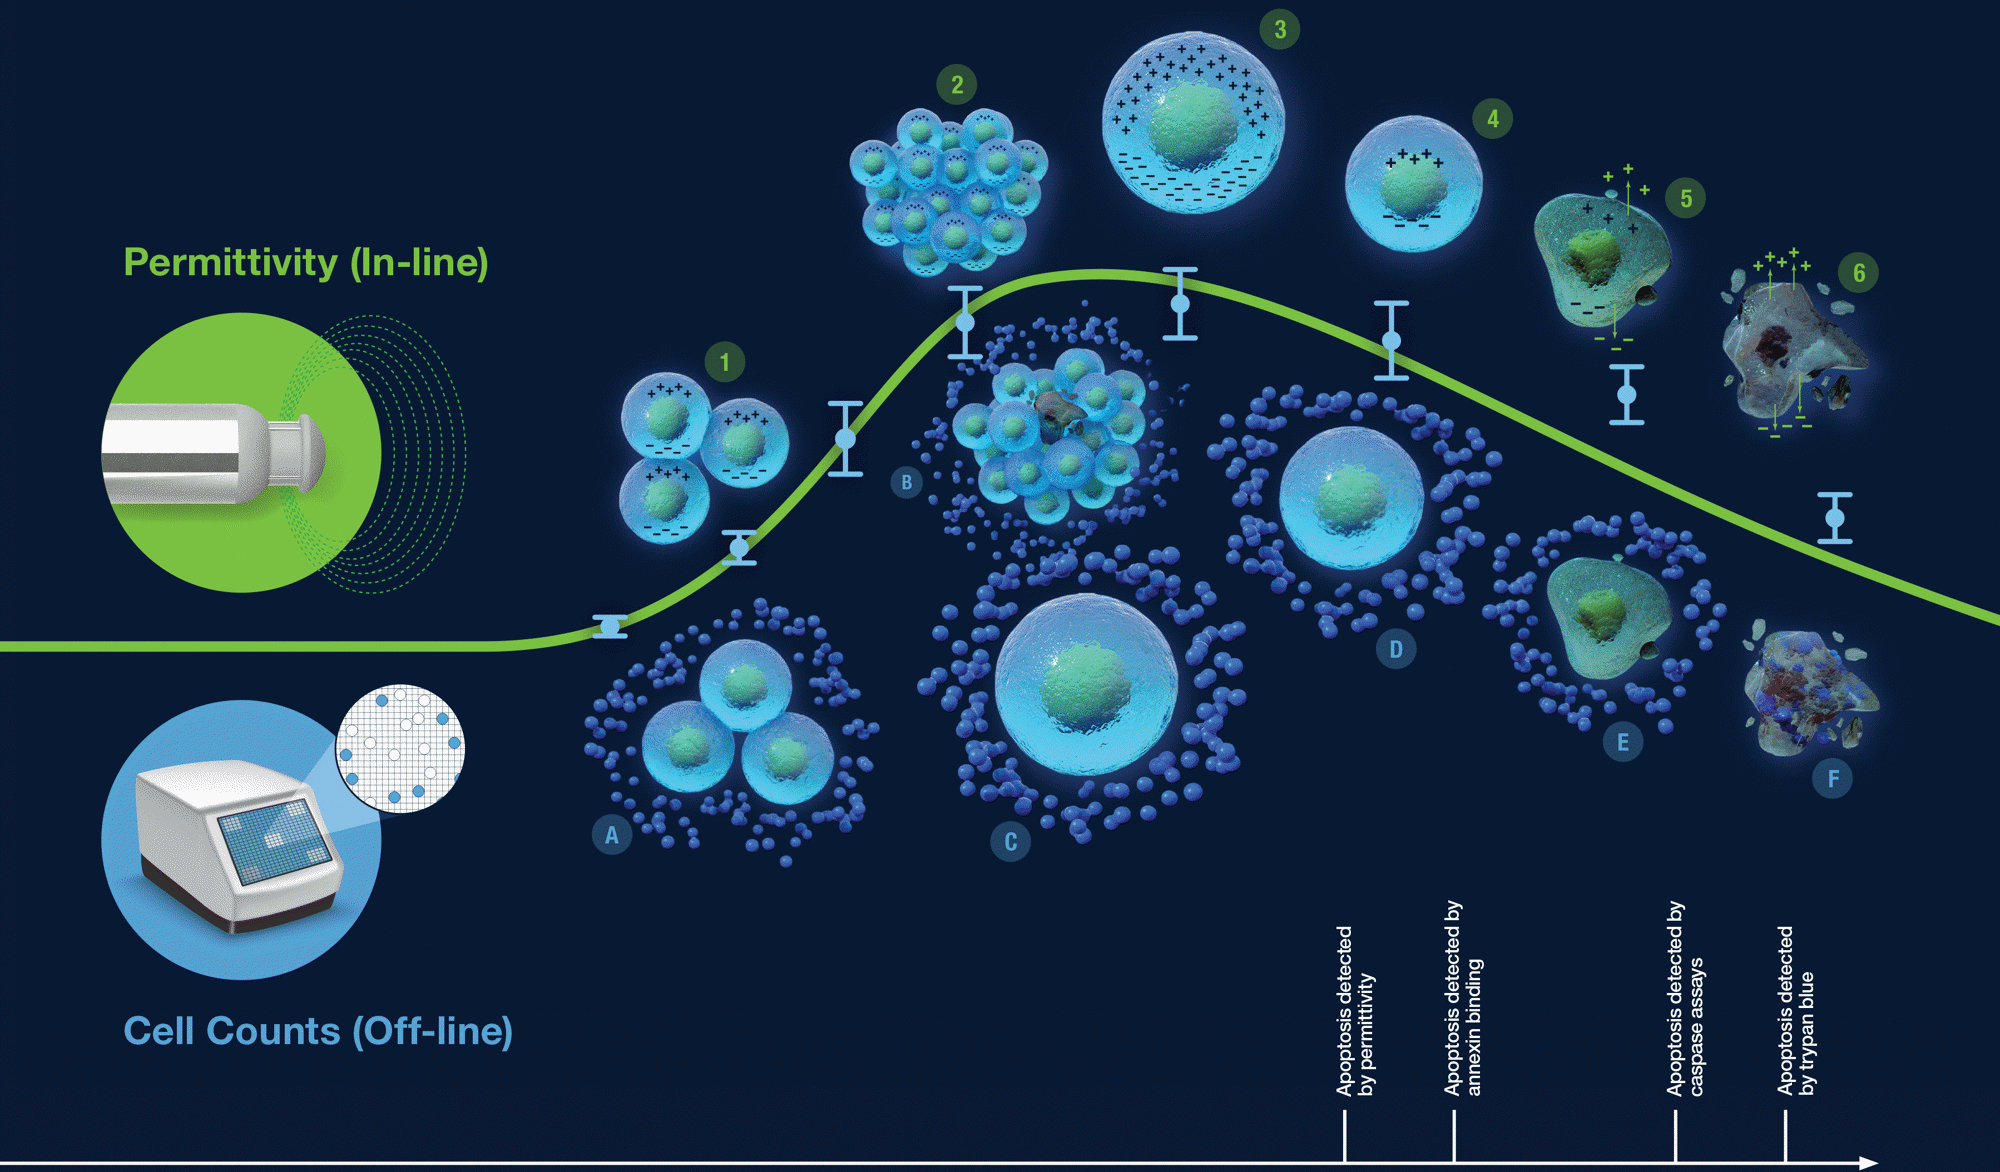
Image Credit: Hamilton Company
| Permittivity (In-line) |
Cell Counts (Off-line) |
1. Cells with capacitance
2. Clumped cells all contribute to permittivity signal
3. Large cells contribute proportionally more to permittivity
4. Preapoptotic cells negatively impact permittivity measurement
5. Cell leakage detected by permittivity and annexing binding
6. Dead cells exhibit no capacitance |
A. Live cells have no trypan blue uptake
B. Cell aggregation may lead to miscounting and hide dead cells
C. Large cells count as a single cell
D. Preapoptotic cells are indistinguishable from viable cells
E. Caspase will enter the dying cell, but trypan blue will not
F. Trypan blue will enter dead cells |
Differences in measurement techniques
High cell concentrations
At high cell concentrations (typically considered to be greater than 1×10⁷ cells/mL in mammalian cultures), off-line VCD samples require dilution before measurement, which can result in an increased sampling error.6
High cell concentrations are also frequently linked with cell aggregation, as cell clumping affects off-line image-based cell counting algorithms.
Dilution is not required for in-line permittivity sensors, and the measurement is minimally impacted by cell aggregation. This leads to lower measurement errors than off-line VCD measurements.
Image Credit: Hamilton Company
Adherent cell cultures
Off-line VCD measurement often demands the detachment of the cells from microcarriers or other matrices before analysis can be conducted. The requirement for detachment introduces steps where incomplete detachment and partial reattachment can take place, leading to skewed VCD counts.
While trypsin is frequently used for cell detachment, it can have toxic effects on cells if they are exposed to it repeatedly or for extended durations.
In-line permittivity measurement is not affected by most adherent substrates that are commercially available and can provide a direct measurement of viable cell density of an adherent cell line without the demand for cell detachment or exposure to toxic chemicals.10
Irregular cell geometries
While there are many industrially relevant cell lines with a roughly spherical shape, there are also cell lines with more irregular cell geometries.
Quantifying these cell lines effectively with offline measurements is challenging due to cell heterogeneity. This variability impacts the consistency of resolving individual cells in a 2D image using offline image-based methods.
The biovolume of cells is continuously measured with permittivity, regardless of geometry. These continuous measurements average out the impact of cell geometry to deliver a robust aggregate VCD measurement.

Image Credit: Hamilton Company
Quantifying cell viability
Cell apoptosis leads to the loss of membrane integrity, which subsequently results in membrane leakage.
Off-line cytometry or imaging techniques rely on utilizing molecular dyes or specific binding tags to physically penetrate the damaged membrane or bind to certain membrane components accessible during different apoptosis stages.
For example, Annexin V binds to phosphatidylserine, a membrane-bound protein that is exposed during the early stages of cellular apoptosis. Caspase assays enable the quantification of the presence of caspase, an enzyme usually produced intracellularly and secreted during mid-stage cell apoptosis.
Trypan blue is only effective for quantifying cell viability during late-stage apoptosis, as this is when the membrane physically degrades, enabling the dye to penetrate and stain the non-viable cell.
Permittivity measurement is based on intracellular ion separation and is sensitive to cellular changes in cytoplasmic conductivity, e.g., a reduction in intracellular conductivity because of active transport failure in the cell membrane.
Consequently, permittivity identifies the loss of viability in the early stages of apoptosis more effectively than many staining and molecular binding offline techniques.2
Processes with changes in cell biovolume and membrane properties
Although highly correlated to viable cell density counts (often measured in cells/mL and referred to as viable cell concentration) in most applications, the measurement of permittivity is essentially a measurement of viable cell biovolume within a cell membrane.
It captures changes in cell biovolume caused by the physiological and environmental factors of the cell culture.
Environmental stressors like culture osmolarity affect the ability of the cells to regulate osmotic balance, resulting in shrinking or swelling, depending on the strength of the suspension’s ionic concentration.
Additionally, nutrient limitations can influence cell size, promoting a transition in the metabolic stage and leading to a change in culture population cell size.16
Cell size may also vary with respect to the application or target product. For example, viral vector applications have highlighted altered membrane properties and cell swelling in response to transfection and intracellular viral production.
In each case, a permittivity sensor can measure these increases in biovolume, even if the number of viable cells is unchanged. Consequently, the permittivity signal serves as an indicator of both the viable cell concentration and changes in cell physiology during the process. Permittivity measurement can be utilized effectively with or without other metrics of VCD measurement.
Grasping how measurement principles influence quantified values and recognizing the differences between measurement technologies enables more informed decisions about the most effective use of each technology.
Permittivity response and the cell cycle
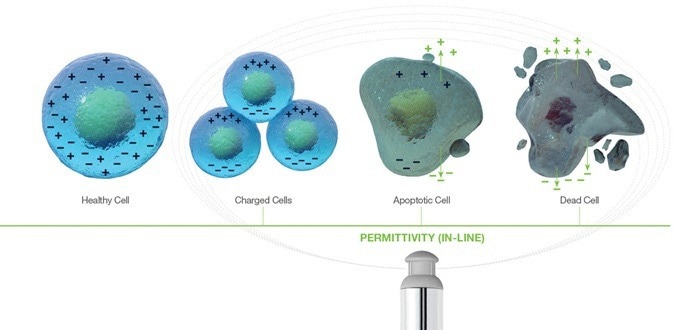
Image Credit: Hamilton Company
Permittivity for process Insight
As previously discussed, a continuous biocapacitance-based measurement can provide unique culture information that cannot be acquired through conventional off-line analysis.
Regarding the practical application of dielectric spectroscopy, a biocapacitance probe produces a complete frequency response distribution of cells within a dielectric field; this is called the beta dispersion curve.
Multivariate parameters, established via the empirical fit of the beta dispersion curve to the Cole-Cole model for a spherical particle in a dielectric field, help with the characterization of changes in the beta dispersion curve shape and magnitude.7
Multivariate parameters are useful when attempting to capture shifting cellular properties in real time. Permittivity is employed as an actionable process control metric with practical applications beyond monitoring and revealing cell culture trends and VCD.
The following are some examples of applications in which the unique benefits of permittivity measurement were used to improve processes in ways that alternative measurement types cannot facilitate.
Viral vector production
Viral vector production is an application with severe changes in cell physiology due to morphology changes during viral accumulation and secretion mechanisms that affect cell membrane properties.
Permittivity has been successfully employed to gain an understanding of the distinct phases of viral component synthesis and release in both insect17 and mammalian host systems.4
A direct application of successful viral transfection culture characterization enabled the determination of low versus high-performing cultures, in addition to a prediction of time for optimal culture harvest utilizing the multivariate parameters determined from permittivity measurement.13
Identifying nutrient limitations
Nutrient limitations have been observed using biocapacitance via changing fscan and multivariate parameters.
With permittivity and accompanying multivariate parameters being continuously measured, this enables the detection of changes to culture health in the form of decreased VCD.
For example, the detection of a subtle decrease in the VCD profile enabled the discrepancies in the permittivity signal from historical growth curves to be investigated, which resulted in the identification of a nutrient deficiency impacting culture growth.
Modifying the bolus addition by supplementing deficient nutrients at specific observed times not only enhanced the peak VCD during the growth phase but also extended the viable production period.3
In addition, multivariate parameters were demonstrated to respond uniquely to nutrient limitation, exhibiting an ability to capture changes in intracellular properties of the cell in response to a shifting cellular metabolism.3
If detected early in the process, addressing a nutrient limitation can prevent the onset of apoptosis within the culture. Early onset apoptosis can be identified using the multivariate properties of the permittivity signal. This provides time for process correction, and the multivariate properties act as an analogous indicator of return to normal cellular physiology.
The proactive monitoring of cell’s multivariate properties within a dielectric field is valuable to the production of a correlative metric to VCD, as well as for capturing actionable cellular mechanistic changes like metabolic shifts or apoptosis within a continuous measurement fingerprint.11
Modified cell culture calculations and feeding strategies
The replacement of fixed-time bolus feeding with permittivity, used as the determinable parameter for the integral of viable cell concentration or the area under the growth curve, has been successfully achieved.
In this approach, the permittivity replaces the off-line VCD measurement for determining the total culture growth.9,12
The permittivity signal offers a distinct benefit for feed control over offline VCD measurement by capturing both variations in cell concentration and cell size. The cell size can vary depending on the cell lifecycle stage and the culture phase (growth or stationary), with larger cells demanding more nutrients for comparable metabolism. Relying solely on offline VCD measurements for feeding might not provide adequate nutrient dosing in such scenarios.8
The demand for proficient PAT—encompassing process monitoring, characterization, and control—is increasingly being discussed within the biopharma community, and biocapacitance stands as a pivotal instrument in achieving this objective.
This in-line, continuous VCD measurement method is a well-established technology boasting a history of success across various cell culture applications. Its usage is anticipated to grow as time advances.
References
- Abu-Absi, Nicholas R., Brian M. Kenty, Maryann Ehly Cuellar, Michael C. Borys, Sivakesava Sakhamuri, David J. Strachan, Michael C. Hausladen, and Zheng Jian Li. 2011. “Real Time Monitoring of Multiple Parameters in Mammalian Cell Culture Bioreactors Using an In-Line Raman Spectroscopy Probe.” Biotechnology and Bioengineering 108 (5): 1215–21. https://doi.org/10.1002/bit.23023.
- Henslee, Erin, Ruth M. Torcal Serrano, Fatima H. Labeed, Rita I. Jabr, Christopher H. Fry, Michael P. Hughes, and Kai F. Hoettges. 2016. “Accurate Quantification of Apoptosis Progression and Toxicity Using a Dielectrophoretic Approach.” Analyst 141 (23): 6408–15. https://doi.org/10.1039/C6AN01596D.
- Ansorge, Sven, Geoffrey Esteban, and Georg Schmid. 2010. “On-Line Monitoring of Responses to Nutrient Feed Additions by Multi-Frequency Permittivity Measurements in Fed-Batch Cultivations of CHO Cells.” Cytotechnology 62 (2): 121–32. https://doi.org/10.1007/s10616-010-9267-z.
- Ansorge, Sven, Olivier Henry, Marc Aucoin, Robert Voyer, John P. Carvell, and Amine Kamen. 2010. “Monitoring the Cell Size Distribution of Mammalian Cell Cultures Using On-Line Capacitance Measurements.” In Cells and Culture, edited by Thomas Noll, 853–59. Dordrecht: Springer Netherlands. https://doi.org/10.1007/978-90-481-3419-9_150.
- Ansorge, Sven, Stéphane Lanthier, Julia Transfiguracion, Olivier Henry, and Amine Kamen. 2011. “Monitoring Lentiviral Vector Production Kinetics Using Online Permittivity Measurements.” Biochemical Engineering Journal 54 (1): 16–25. https://doi.org/10.1016/j.bej.2011.01.002.
- Cadena-Herrera, Daniela, Joshua E. Esparza-De Lara, Nancy D. Ramírez-Ibañez, Carlos A. López-Morales, Néstor O. Pérez, Luis F. Flores-Ortiz, and Emilio Medina-Rivero. 2015. “Validation of Three Viable-Cell Counting Methods: Manual, Semi-Automated, and Automated.” Biotechnology Reports 7 (September): 9–16. https://doi.org/10.1016/j.btre.2015.04.004.
- Dabros, Michal, Danielle Dennewald, David J. Currie, Mark H. Lee, Robert W. Todd, Ian W. Marison, and Urs von Stockar. 2009. “Cole–Cole, Linear and Multivariate Modeling of Capacitance Data for on-Line Monitoring of Biomass.” Bioprocess and Biosystems Engineering 32 (2): 161–73. https://doi.org/10.1007/s00449-008-0234-4.
- Downey, Brandon J., Lisa J. Graham, Jeffrey F. Breit, and Nathaniel K. Glutting. 2014. “A Novel Approach for Using Dielectric Spectroscopy to Predict Viable Cell Volume (VCV) in Early Process Development.” Biotechnology Progress 30 (2): 479–87. https://doi.org/10.1002/btpr.1845.
- Fernandes, Juhi, Jayme Currie, Kevin Ramer, and An Zhang. 2019. “Development of Capacitance Tools: At-Line Method for Assessing Biomass of Mammalian Cell Culture and Fixed Cell Calibration Standard.” Biotechnology Journal 14 (4): e1800283. https://doi.org/10.1002/biot.201800283.
- Justice, C., J. Leber, D. Freimark, P. Pino Grace, M. Kraume, and P. Czermak. 2011. “Online- and Off-line- Monitoring of Stem Cell Expansion on Microcarrier.” Cytotechnology 63 (4): 325–35. https://doi.org/10.1007/s10616-011-9359-4.
- Ma, Fuduo, An Zhang, David Chang, Orlin D. Velev, Kelly Wiltberger, and Rashmi Kshirsagar. 2019. “Real-Time Monitoring and Control of CHO Cell Apoptosis by in Situ Multifrequency Scanning Dielectric Spectroscopy.” Process Biochemistry 80 (May): 138–45. https://doi.org/10.1016/j.procbio.2019.02.017
- Moore, Brandon, Ryan Sanford, and An Zhang. 2019. “Case Study: The Characterization and Implementation of Dielectric Spectroscopy (Biocapacitance) for Process Control in a Commercial GMP CHO Manufacturing Process.” Biotechnology Progress 35 (3): e2782. https://doi.org/10.1002/btpr.2782.
- Pais, Daniel A. M., Chris Brown, Anastasia Neuman, Krishanu Mathur, Inês A. Isidro, Paula M. Alves, and Peter G. Slade. 2020. “Dielectric Spectroscopy to Improve the Production of RAAV Used in Gene Therapy.” Processes 8 (11): 1456. https://doi.org/10.3390/pr8111456.
- Pais, Daniel A. M., Paulo Galrão, Anastasiya Kryzhanska, Jérémie Barbau, Inês A. Isidro, and Paula Alves. 2020. “Holographic Imaging of Insect Cell Cultures: Online Non-Invasive Monitoring of Adeno-Associated Virus Production and Cell Concentration.” Processes 8 (4): 487. https://doi.org/10.3390/pr8040487.
- Pais, Daniel A. M., Rui M. C. Portela, Manuel J. T. Carrondo, Inês A. Isidro, and Paula M. Alves. 2019. “Enabling PAT in Insect Cell Bioprocesses: In Situ Monitoring of Recombinant Adeno‐associated Virus Production by Fluorescence Spectroscopy.” Biotechnology and Bioengineering 116 (11): 2803–14. https://doi.org/10.1002/bit.27117.
- Pan, Xiao, Ciska Dalm, René H. Wijffels, and Dirk E. Martens. 2017. “Metabolic Characterization of a CHO Cell Size Increase Phase in Fed-Batch Cultures.” Applied Microbiology and Biotechnology 101 (22): 8101–13. https://doi.org/10.1007/s00253-017-8531-y.
- Petiot, Emma, Sven Ansorge, Manuel Rosa-Calatrava, and Amine Kamen. 2017. “Critical Phases of Viral Production Processes Monitored by Capacitance.” Journal of Biotechnology 242 (January): 19–29. https://doi.org/10.1016/j.jbiotec.2016.11.010.
About Hamilton Company
Hamilton Company specializes in the development, manufacturing and customization of precision measurement devices, automated liquid handling workstations, and sample management systems. Hamilton's processes are optimized for quality and flexibility. Whether it's a custom needle with a quick delivery time frame, a special length pH sensor, or a comprehensive solution to fully automate your assay workflow, trust that Hamilton products will always meet your needs.
Hamilton Company has been a leading global manufacturer for more than 60 years, with headquarters in Reno, Nevada; Franklin, Massachusetts; Timișoara, Romania; Bonaduz, Switzerland; and subsidiary offices throughout the world.
Sponsored Content Policy: News-Medical.net publishes articles and related content that may be derived from sources where we have existing commercial relationships, provided such content adds value to the core editorial ethos of News-Medical.Net which is to educate and inform site visitors interested in medical research, science, medical devices and treatments.