This article is based on a poster originally authored by Lois J Haupt, Leah Logan, Cody Hendren, Seema Muranjan, Rahul Baghla, and Anuja Bhalkikar.
Understanding the clearance and metabolic stability of therapeutic candidates is critical for the drug research and development process. In vitro metabolic stability studies employing human liver microsomes are a useful tool for this understanding, although clearance measurements must be as close to in vivo clearance as possible.
The ionic strength of incubation buffers can influence the metabolism of CYP substrates in vitro tests; however, it can also influence sample analysis by LC-MS/MS because buffers with greater ionic strengths can generate ion suppression and reduce instrument sensitivity.
In this investigation, CYP substrates were incubated with NADPH-fortified human liver microsomes in buffer solutions containing 20, 50, or 100 mM potassium phosphate.
The goal was to find the appropriate potassium phosphate level for samples tested with the SCIEX 7500+ system, Echo® MS+ system, and ZenoTOF 7600 system while retaining CYP activity.
By comparing half-life values across buffer conditions, the study discovered ideal assay parameters that maintain CYP activity while providing the highest analytical sensitivity for the assay.
Methods
Sample preparation
Sample preparation at BioIVT involved incubating known CYP substrates with a Tecan liquid handler. In triplicate 0.2 mL incubations, substrate (1 µM), human liver microsomes (0.1 or 0.5 mg/mL), MgCl2 (3 mM), and EDTA (1 mM, pH 7.4) were added, along with a potassium phosphate buffer (20, 50, or 100 mM, pH 7.4).
Incubations began with the insertion of the NADPH-regenerating system and lasted 0, 15, 30, and 60 minutes. After incubation, the reactions were stopped by adding an equal volume (0.2 mL) of acetonitrile, followed by an equal volume (0.2 mL) of water.
The samples were centrifuged (920 rcf for 10 minutes at 10 °C) and diluted 40 times with 30 % acetonitrile before LC-MS analysis.
Sample analysis
Chromatography: Analytical separation was performed using the Exion LC AE system using a Phenomenex Kinetex XB-C18 (2.1 × 50 mm, 2.6 µm) column at a 0.8 mL/min flow rate. Mobile phases A and B contained 0.1 % (v/v) formic acid in water and 0.1 % (v/v) formic acid in acetonitrile. The column temperature was set at 50 °C, and 2 µL of injection volume was employed for analysis. The gradient conditions are summarized in Table 1.
Table 1. LC gradient conditions. Source: BioIVT
| Time (min) |
Mobile phase A (%) |
Mobile Phase B (%) |
| 0.0 |
90 |
10 |
| 0.2 |
90 |
10 |
| 1.1 |
5 |
95 |
| 1.5 |
5 |
95 |
| 1.6 |
90 |
10 |
| 2 |
90 |
10 |
Acoustic ejection method: The samples were transferred to an Echo® MS-qualified 384-well plate and centrifuged at 2000 rpm for 2 minutes. The optimal volume of sample was expelled in standard mode at a 2-second period. The analysis was performed using a carrier solvent of 70:30 (v/v) acetonitrile/1 mM ammonium fluoride in water at a flow rate of 400 µL/min.
Mass spectrometry: MRM, Zeno MRMHR, and Zeno MS1 techniques were applied on SCIEX mass spectrometers under optimum settings. Table 2 compiles the list of chemicals, techniques, and mass transitions.
Table 2. List of compounds, methodology, and transitions used for analysis. Source: BioIVT
| Compound |
Methodology (LC-MS,
Echo® MS+ system) |
LC-MS transitions |
Echo® MS+
transitions |
| Bupropion |
MRM, MRMHR |
240.1/184.0 |
240.1/184.0528 |
| Dextromethorphan |
MRM, MRMHR |
272.2/215.1 |
272.2/147.0790 |
| Midazolam |
MRM, MRMHR |
326.1/291.1 |
326.1/291.1164 |
| 7-Ethoxycoumarin |
MRM, MRMHR |
191.1/163.0 |
191.1/163.0390 |
| Testosterone |
MRM, ZenoMS1 |
289.2/109.1 |
289.2/289.2155 |
| Diclofenac |
MRM, MRMHR (Negative) |
296.1/214.0 |
294.0/250.0203 |
Data processing: Data acquisition was carried out using SCIEX OS software, version 3.4.5. Data processing was carried out utilizing AI Quantitation software.
Data
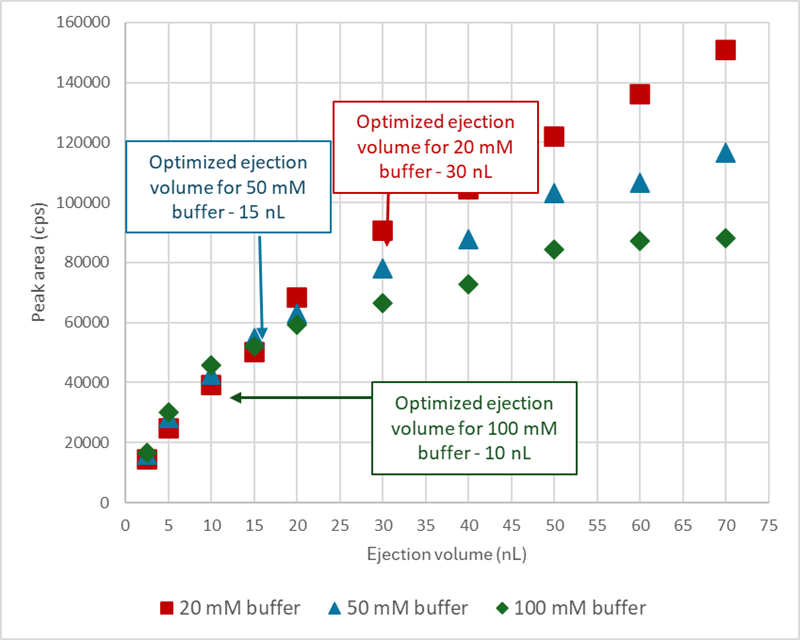
Figure 1. Ejection volume optimization chart for bupropion, showing ejection volume vs. peak area across the three buffer compositions. Image Credit: BioIVT
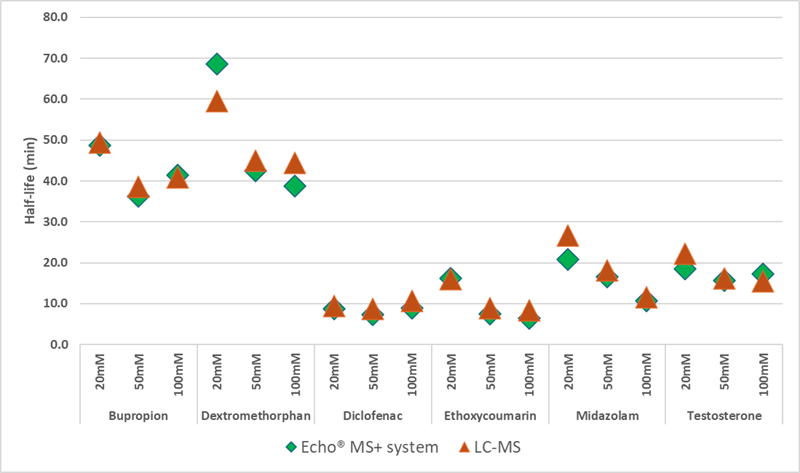
Figure 2. Evaluating half-life (min) equivalency. Half-life was calculated using Echo® MS+ sample analysis and compared to half-life calculated using analysis by conventional LC-MS system. Image Credit: BioIVT
Table 3. Half-life comparison and differences between Echo® MS+ system and the LCMS methodologies for 6 analytes used in this experiment. Source: BioIVT
| Compounds |
Buffer
strength |
Echo® MS+
system t1/2
(min) |
% CV |
LC-MS
t1/2 (min) |
% CV |
% Bias |
| Bupropion |
20 mM |
48.7 |
14.7 |
49.4 |
13.2 |
-1.42 |
| 50 mM |
36.4 |
38.6 |
-5.88 |
| 100 mM |
41.4 |
41.0 |
1.05 |
| Dextromethorphan |
20 mM |
68.7 |
32.8 |
59.6 |
17.3 |
15.19 |
| 50 mM |
42.4 |
44.9 |
-5.48 |
| 100 mM |
38.7 |
44.5 |
-12.97 |
| Diclofenac |
20 mM |
8.7 |
9.8 |
9.4 |
10.1 |
-7.32 |
| 50 mM |
7.4 |
8.8 |
-15.60 |
| 100 mM |
8.9 |
10.7 |
-16.82 |
| 7-Ethoxycoumarin |
20 mM |
16.2 |
53.5 |
16.0 |
37.6 |
1.25 |
| 50 mM |
7.5 |
9.0 |
-16.63 |
| 100 mM |
6.4 |
8.5 |
-24.79 |
| Midazolam |
20 mM |
20.8 |
31.6 |
26.7 |
40.2 |
-22.01 |
| 50 mM |
16.6 |
18.2 |
-8.76 |
| 100 mM |
10.7 |
11.6 |
-8.10 |
| Testosterone |
20 mM |
18.6 |
8.8 |
22.2 |
20.5 |
-16.25 |
| 50 mM |
15.6 |
16.2 |
-3.71 |
| 100 mM |
17.3 |
15.5 |
11.40 |
Results
Method optimization
Optimizing ionization efficiency is crucial for sample analysis, as it impacts total sensitivity. This optimization technique for the Echo® MS+ system consists of two steps:
Step 1: Use multiple chemical modifiers in the carrier solvent and analyze the sample's overall signal to select the most effective modifiers.
Step 2: Fine-tune the sample ejection volume within the optimized carrier solvent to find the ideal ejection volume for maximum sensitivity while avoiding matrix suppression.
The buffer composition in the final sample has a considerable impact on ejection volume optimization, as increased buffer strength limits the ability to expel bigger volumes. This is necessary to attain increased sensitivity.
In this work, buffer strengths of 20 mM, 50 mM, and 100 mM in the incubation mixture were tested to see how they affected ionization efficiency and enzyme activity by measuring each compound's half-life. The optimized ejection volumes varied depending on the three buffer compositions examined.
The optimal volume for bupropion was 30 nL in 20 mM phosphate buffer, compared to 15 nL and 10 nL in 50 and 100 mM phosphate buffers, respectively.
Because of the increased injection volume, the sample in the 20 mM phosphate buffer had a higher overall signal intensity than the samples in the 50 and 100 mM phosphate buffers (Figure 1).
Half-life results
The two types of instruments employed for sample analysis had equivalent half-life results, with less than 20 % bias found (Figure 2).
Furthermore, the half-life values for bupropion, diclofenac, and testosterone were identical regardless of potassium phosphate content in the incubation, as demonstrated by % CV ≤ 20 % (Table 3).
Dextromethorphan, 7-ethoxycoumarin, and midazolam had longer half-lives in the presence of 20 mM potassium phosphate buffer than in the presence of 50 or 100 mM buffer.
Conclusions
The Echo® MS+ system can perform a high-throughput metabolic stability experiment 60 times quicker than typical LC-MS, resulting in significant time savings.
Half-life results were consistent across all three buffer compositions compared to conventional LC-MS methodology. However, using 20 mM potassium phosphate buffer may result in slightly longer half-life values for some substrates than standard 50 or 100 mM concentrations.
Lower buffer concentrations increased ejection volumes and sensitivity. Specifically, the 20 mM buffer sample with a 30 nL ejection volume outperformed the 50 mM and 100 mM buffer samples in terms of sensitivity.
References
- Rapid MS/MS analysis with acoustic ejection mass spectrometry (AEMS), SCIEX technical note, RUO-MKT-02-11385-A.
- Streamlined analysis: Combining mass spectral data analysis and endpoint calculations for drug discovery insights, SCIEX technical note MKT-35086-A.
- SCIEX. (2025). Redefining quantitative analysis: Reducing high resolution mass spectral data complexity for quick and accurate insights. (online) Available at: https://sciex.com/tech-notes/pharma/redefining-quantitative-analysis-reducing-high-resolution-mass.
About BioIVT
BioIVT, formerly BioreclamationIVT, is a leading global provider of high-quality biological specimens and value-added services. We specialize in control and disease state samples including human and animal tissues, cell products, blood and other biofluids. Our unmatched portfolio of clinical specimens directly supports precision medicine research and the effort to improve patient outcomes by coupling comprehensive clinical data with donor samples.
Our Research Services team works collaboratively with clients to provide in vitro hepatic modeling solutions. And as the world’s premier supplier of ADME-Tox model systems, including hepatocytes and subcellular fractions, BioIVT enables scientists to better understand the pharmacokinetics and drug metabolism of newly discovered compounds and the effects on disease processes. By combining our technical expertise, exceptional customer service, and unparalleled access to biological specimens, BioIVT serves the research community as a trusted partner in ELEVATING SCIENCE®.
Sponsored Content Policy: News-Medical.net publishes articles and related content that may be derived from sources where we have existing commercial relationships, provided such content adds value to the core editorial ethos of News-Medical.Net which is to educate and inform site visitors interested in medical research, science, medical devices and treatments.
Last Updated: Apr 24, 2026