Zeta potential is proportional to the charge on the surface of particles and this value can be used to measure the stability of colloidal dispersions. The larger the zeta potential, the stronger the repulsive forces between the particles.
The existence of such large repulsive forces prevents the diffusing particles from forming aggregates by avoiding the random collision between them. This article discusses the evaluation of a blood separation device using zeta potential. In Nicomp 380 ZLS, electrophoretic techniques are applied to measure the zeta potential of a dispersed system.
Zeta potential
The potential at a particle’s shear plane is known as its zeta potential. This plane is the distance, near the surface below which the surrounding solvent molecules and counter-ions move along with the particles.
Therefore, all the associated surface groups, solvent molecules, counter-ions, contaminates, and surfactants present between the particle surface and the shear plane, influence the actual surface potential. Zeta potential is highly sensitive to diluent conditions, including pH, chemical composition, ionic strength, and contaminate level.
Zeta potential measurement
To measure zeta potential, two electrodes are immersed in a cuvette containing the sample (the open cell design) and an appropriate electric field is applied. The particles within the electric field will migrate upon charging, with a specific velocity along the field lines toward the electrode with the opposite charge.
A scattered laser beam’s Doppler shift corresponding to a reference signal is measured to determine the mobility or velocity of these particles. The Smoluchowski approximation directly correlates the velocity or mobility of particles to their zeta potential, and this correlation is valid for larger particles present in high-conductivity liquids.
Advantages of Nicomp 380 ZLS
The open cell design of the 380 ZLS is advantageous in many ways over a traditional closed-cell design. The electro-osmosis phenomenon arising out of liquid movement caused by the charged surfaces of the closed cell poses a challenge to this design. The liquid movement affects the observed velocity of the particle movement in the electric field.
The liquid remains almost motionless at a certain point in the capillary, where the view volume to be illuminated by the laser is optimum. In closed-cell design, the laser needs to be aligned to the so-called ‘stationary plane’ in order to obtain an accurate measurement, which is a very cumbersome process.
The open cell design of the 380 ZLS is not affected by the electro-osmosis phenomenon owing to the large distance between the cell walls and the electrodes and moving particles.
Therefore, the 380 ZLS does not require laser alignment, meaning the position of the cells is no longer important. Moreover, inexpensive disposable cuvettes can be used in the 380 ZLS owing to the avoidance of cell cleaning or cross contamination.
Representative results
In this analysis, a device that separates blood into its fractions was used to prepare the blood cell samples. The cell fractions ranged from fractions that were almost exclusive of red blood cells to fractions with almost exclusive of red blood cells.
Figure 1 illustrates a power spectrum collected from one of the fractions. Two spectra can be seen in Figure 1: one is the reference spectrum collected with the electric field on and the other with the electric field off. The velocity of the particles moving across the electric field lines causes the second peak to shift.
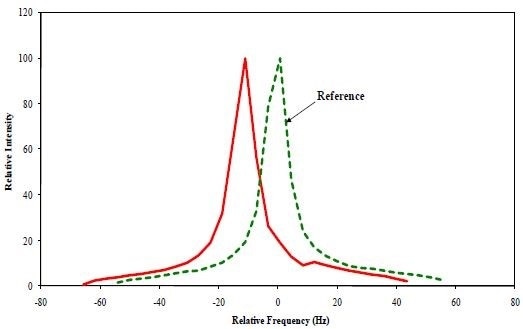
Figure 1. Zeta Potential Power spectra obtained from Fraction 4.
A plot of the zeta potential for each fraction (4 through 9) is shown in Figure 2, demonstrating the general trend. From the results, it is evident that the zeta potential turns out to be less negative for successive fractions (from 4 to 9) because the mobility of white blood cells is smaller than that of red blood cells.
This indicates an increase in the white blood cell content in each subsequent fraction (from Fraction 4 through Fraction 9). These results agree well with the data obtained from other measurements.
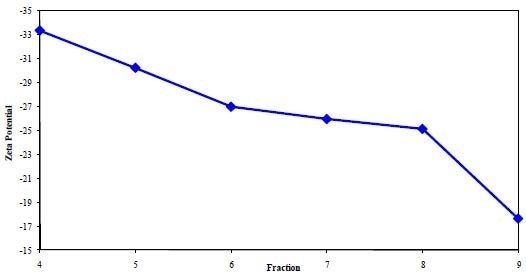
Figure 2. A plot of the Zeta Potential from each blood fraction.
Conclusion
From the results, it is evident that the Nicomp 380 ZLS can measure zeta potential of particles larger than 5µm. The results also confirm the suitability of using the Nicomp 380 ZLS in the analysis of blood cell aggregation and blood component separation.
About Entegris
For over 35 years Entegris has been committed to helping customers find solutions to their particle sizing problems. We offer products with unique capabilities that can size particles from single digit nanoparticles to particles that are thousands of microns in diameter. Whether you need a particle size distribution or to find that needle in a hay stack, our team of engineers and sales staff are available to provide the product knowledge and scientific expertise necessary to solve your sizing issues.
Sponsored Content Policy: News-Medical.net publishes articles and related content that may be derived from sources where we have existing commercial relationships, provided such content adds value to the core editorial ethos of News-Medical.Net which is to educate and iform site visitors interested in medical research, science, medical devices and treatments.