In 1919, the term 'biotechnology' was coined by the Hungarian agricultural engineer Karl Ereky.1 Fermentation is a vital element of biotechnology is utilized to create a large variety of key products over a number of industries, including:
- Pharmaceuticals: antibiotics, prophylactics, vaccines, hormones such as human insulin
- Biomaterials: biodegradable, energy-efficient plastics
- Bioenergy: bioalcohol fuels based on low value, non-food based feedstocks
- Animal nutrition: feed supplements, amino acids
Online process analytical technology (PAT) has grown in popularity in the biotechnology industry in recent years. Many fermentation scientists have been using Thermo Scientific™ process mass spectrometers as PAT tools since the early 1980s.
These tools can quickly and precisely monitor the composition of gas streams into and out of bioreactors and fermenters. Other essential fermentation products include food additives, vitamins, and industrial enzymes.
Fermentation
The term ‘fermentation’ is used by microbiologists to describe the production of a product by utilizing the mass culture of a microorganism. The product could be the microorganism’s own metabolite, a foreign product, or even the cell itself (biomass production).
Microorganisms that carry out their metabolism via oxygen are known as aerobic microorganisms. Some microorganisms exist which can substitute sulfate or nitrate for oxygen, enabling them to grow in the absence of oxygen and these are known as anaerobic microorganisms.
Types of fermentation process
Fermentation processes fall into one of three key categories outlined below.
Batch fermentation
Prior to being incubated in the fermenter, a sterilized nutrient solution is inoculated with microorganisms. Oxygen will be added together with base or acid to control the pH during the fermentation if the microorganisms are aerobic.
Typically, cell activity will lead to constant alterations in metabolite concentration, biomass concentration, and composition of the culture medium.
Fed-batch fermentation
In fed-batch fermentation, a substrate is added in increments as the fermentation progresses. This process is an enhancement of the closed batch process.
Continuous fermentation
An open system is put in place, with sterile nutrient solution constantly added to the bioreactor, while an equivalent volume of converted nutrient solution with microorganisms is harvested off of the system at the same time.
Historically, both fermenters and bioreactors have been designed for repeated use, meaning that it was necessary to sterilize the vessel carefully between batches to avoid possible contamination.
Single-use vessels have recently become more common, thus eliminating the requirement to manage time-consuming and costly sterilization schedules. A HyPerforma™ 50 liter Single-Use Bioreactor (S.U.B.) from Thermo Scientific™ is shown in Figure 1.
.")
Figure 1. Thermo Scientific™ HyPerforma™ 50 L Single-Use Bioreactor (S.U.B.). Image Credit: Thermo Fisher Scientific – Environmental and Process Monitoring Instruments
While this particular instrument is utilized in mammalian cell culture fermentation, it is also available in 100, 250, 500, 1000 and 2000 liter models, ensuring consistent scalability over a large range of applications.
Thermo Scientific™ also provides Single-Use Fermentors (S.U.F.) of 30 and 300-liter sizes which are ideal for utilization in bacterial or fungal fermentation. There are three types of host organism which are suitable for fermentation processes:
Microbial
Microbial organisms which are suitable for fermentation processes include molds and yeasts like Saccharomyces cerevisiae (Brewers’ yeast). These microorganisms are considered to be safe and so have been in use for many years.
This makes product approval using microbial organisms much easier and they are able to generate high product volumes relatively inexpensively.
Bacteria
Bacteria that are suitable for fermentation processes include E coli, Bacillus and lactic acid bacteria. These bacteria provide numerous advantages, including high cell densities, fast growth, and cheap substrates.
They are fairly simple to cultivate and scale up, but a large amount of these bacteria are considered to be unsafe as pathogens. This can make product recovery a lot more tricky.
Mammalian
Chinese Hamster Ovary (C.H.O.) cells and hybridomas are two of the mammalian organisms which are suitable for fermentation processes. These organisms can produce highly dedicated products in active, highly specific forms, for instance, interferons, vaccines, monoclonal antibodies and recombinant therapeutic proteins.
These organisms need more complex production routes than bacterial and microbial processes. In addition to being more sensitive to shear and stress, the cell lines are less robust.
Thermo Scientific™ Gas Analysis Mass Spectrometers have been used with bacterial and microbial processes for more than 30 years. Interest has grown in mammalian cell culture more recently, as these provide the potential for revolutionary advances in vaccines, gene therapy, and monoclonal antibodies.
While the needs of mammalian cell fermentation processes pose key challenges for an off-gas analyzer, mass spectrometers from Thermo Scientific™ have already proven to be invaluable in improving the understanding of mammalian cell cultures and increasing yields.
The need for gas analysis
It is crucial that the state of the culture in any fermentation is monitored as it is the health of this culture that dictates the formation of unwanted by-products, the conversion rate of nutrients, and in the worst case scenario, the onset of poisoning.
Analysis of respiratory gases being fed into and removed from the fermenter provides an ideal way to characterize the fermentation process.
This non-invasive technique enables the effective monitoring of the fermentation’s physiological state, including growth kinetics and substrate consumption. It can also help to establish the most effective point at which to stop the process to ensure maximum yield.
Why use mass spectrometry for gas analysis?
A number of fermentations are characterized by small changes to oxygen and carbon dioxide concentrations at key phases of the fermentation, for instance when the nutrients and microorganisms exist in equilibrium during the lag phase.
So, in order to capture these subtle changes, it is crucial that the method used for measuring off-gas is capable of fast, accurate analysis.
The speed of M.S. makes it perfect for these types of fermentation applications, but it is crucial that speed is not at the expense of accuracy because precise data collection is also vital or the technique will fail to record small changes in concentration.
There are two assumptions that are common but untrue regarding fermentation applications. The first is that only the quantification of oxygen and carbon dioxide in off-gas is required to make the first steps towards process control and the second is that it is possible to acquire enough accuracy using only discrete measurement technology.
External biology will lead to ongoing differences in the sparge gas. Humans and animals consume O2 and generate CO2 when they undergo respiration, but during daylight hours, plant photosynthesis also consumes CO2 while generating O2.
Depending on where they currently are within the regeneration cycle, twin-tower desiccant dryer systems will either absorb or regurgitate CO2.
These effects are summarized in Figure 2, which shows an example of night and day variations in sparge gas levels of O2 and CO2. These measurements were collected by utilizing a Prima PRO process mass spectrometer over a 24 hour period.
An accurate comparison of effluent gas and sparge gas is the only way that accurate pre-screening for potential contamination can only be achieved. Accurate comparison is also needed to provide real-time information around culture respiration and the availability of nutrients.

Figure 2. Example of day and night variations in sparge gas levels of CO2 and O2 measured with Prima PRO over 24 hours. Image Credit: Thermo Fisher Scientific – Environmental and Process Monitoring Instruments
Benefits of aagnetic sector MS
Two varieties of M.S. have been used to monitor fermentation processes. These are magnetic sector, which sees charged particles separated in a variable magnetic field, and quadrupole, which sees charged particles separated in a variable R.F. field.
Thermo Scientific™ has over thirty years’ industrial experience in the production of both magnetic sector and quadrupole mass spectrometers. Rigorous testing has established that the magnetic sector-based analyzer provides the best performance for fermentation off-gas analysis.2,3
Magnetic sector analyzers provide many advantages. These include:
- Improved Accuracy
- Improved precision
- Long intervals between required calibrations.
- Resistance to contamination
Depending on the complexity of the mixtures and the gases under analysis, analytical precision is usually between two and ten times better than a quadrupole analyzer.
Signal intensity can be seen as a flat top peak at any specific position on a magnetic sector analyzer, which means that a minor drift in the mass scale will not lead to a change in signal intensity. As they supply rounded peaks, this is not the case with quadrupole mass spectrometers.
The magnetic sector analyzers which are used in Thermo Scientific’s Prima range of mass spectrometers are laminated, which enables them to scan at speeds equivalent to those of quadrupole analyzers while supplying a distinct combination of rapid analysis and high stability.
The fast and extremely stable analysis of an unlimited number of user-defined gases is permitted using this technique. The excellent long-term stability of magnetic sector M.S. is confirmed in Table 1.
Table 1. Analysis of compressed air cylinder over 7 days by Prima BT magnetic sector MS. Source: Thermo Fisher Scientific – Environmental and Process Monitoring Instruments
| |
Nitrogen %mol |
Oxygen %mol |
Argon %mol |
Carbon dioxide ppm |
| Mean |
Std dev |
Mean |
Std dev |
Mean |
Std dev |
Mean |
Std dev |
| Day 1 |
78.0807 |
0.0028 |
20.9459 |
0.0026 |
0.9337 |
0.0003 |
396.84 |
1.31 |
| Day 2 |
78.0767 |
0.0023 |
20.9494 |
0.0023 |
0.9342 |
0.0003 |
397.46 |
1.25 |
| Day 3 |
78.0761 |
0.0024 |
20.9500 |
0.0023 |
0.9342 |
0.0003 |
397.34 |
1.28 |
| Day 4 |
78.0798 |
0.0023 |
20.9469 |
0.0023 |
0.9337 |
0.0003 |
396.31 |
1.31 |
| Day 5 |
78.0777 |
0.0030 |
20.9487 |
0.0028 |
0.9339 |
0.0003 |
396.76 |
1.34 |
| Day 6 |
78.0741 |
0.0023 |
20.9518 |
0.0022 |
0.9344 |
0.0003 |
397.47 |
1.27 |
| Day 7 |
78.0750 |
0.0023 |
20.9512 |
0.0022 |
0.9342 |
0.0003 |
397.23 |
1.30 |
In the example shown here, a Prima BT benchtop gas analysis mass spectrometer was configured to analyze argon, nitrogen, oxygen, and carbon dioxide in a cylinder of compressed air. This analysis was carried out for seven days continuously, with no recalibration or interruption.
The analysis time was set at 5 seconds and the day-to-day mean values for carbon dioxide were found to vary by 1 ppm or less, while day-to-day mean values for nitrogen and oxygen were found to vary by 0.005 %.


Figure 3. Long-term stability data from Prima BT magnetic sector MS. Image Credit: Thermo Fisher Scientific – Environmental and Process Monitoring Instruments
Rapid multistream sampling
A fast, reliable means of switching between streams is needed for monitoring multiple bioreactors using M.S. Yet, solenoid valve manifolds include too much dead volume, while rotary valves suffer from poor reliability.
In order to address these issues, Thermo Scientific™ has developed the unique Rapid Multistream Sampler (R.M.S.). The instrument supplies an unparalleled combination of reliability and sampling speed to facilitate sample selection from up to 64 streams.
Stream settling times are fully user-configurable and application-dependent and the R.M.S. provides digital sample flow recording for each individual stream chosen. This feature can be used to trigger an alarm if the sample flow drops, for instance, if a filter in the sample conditioning system becomes blocked. The R.M.S. is also heated, ensuring a quick response to even the most ‘sticky’ volatiles.
Respiratory quotient
Respiration is the term that is employed to describe the process whereby an organism oxidizes food to generate energy. The Respiratory Quotient (R.Q.) is a crucial control parameter within the fermentation process.
R.Q. is the ratio of the Carbon Dioxide Evolution Rate (C.E.R.) to the Oxygen Uptake Rate (OUR). The complete calculation of R.Q. is shown in Table 2. A high R.Q. confirms the production of high levels of CO2, which confirms that the metabolism is working at high efficiency.
Table 2. The respiratory quotient for fermentation off-gas analysis. Source: Thermo Fisher Scientific – Environmental and Process Monitoring Instruments
CER
(CO2 Evolution Rate) |
= |
(%Volume of CO2 out × flow out) |
- |
(%Volume CO2 in × Flow in) |
OUR
(O2 Uptake Rate) |
= |
(%Volume of O2 in × flow in) |
- |
(%Volume O2 out x Flow out) |
RQ
(Respiratory Quotient) |
= |
CER/OUR |
|
|
R.Q. is also a great way to identify and control the carbon source that is currently being metabolized. For instance, if the carbon source is composed of glucose or other carbohydrates, the R.Q. would theoretically be one.
C6H12O6 + 6O2 → 6CO2 + 6H2O
In this equation, the production of biomass or product formation is not covered; it only relates to combustion. So, the R.Q. for glucose is unlikely to be 1.00; it could be around 1.04.
Establishing R.Q. accurately depends on determining the ratio of the flows in and out of the bioreactor successfully. Scanning MS can easily establish this ratio as it can measure N2 and Ar as well as CO2 and O2.
A minimum of one of these two gases will be inert to the process, which means that it can be used to correct for any humidity change that happens as the dry air feed gas is bubbled through the fermentor liquid.
Errors will be introduced into the headspace data without this correction because of dilution by the additional water vapor.4 Table 3 includes the R.Q. calculation using nitrogen as the flow correction. Thermo Scientific’s GasWorks® software can also calculate R.Q. as a standard feature for a fermentation application.
Table 3. Respiratory Quotient calculated by MS. Source: Thermo Fisher Scientific – Environmental and Process Monitoring Instruments
| = |
{CO2out |
x |
(N2in / N2out)} |
– |
CO2in |
| _________________________________________________________________________________________________________ |
| |
O2in |
– |
{O2out |
x |
(N2in / N2out )} |
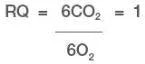
Data from an E. coli fed-batch fermentation is shown in Figure 4. Thermo Scientific’s M.S. can be utilized to measure carbon dioxide, oxygen, argon and nitrogen in both inlet and outlet, in addition to having the ability to calculate R.Q.
A reagent is introduced to induce cells at temperature to change from multiplying to expressing the chosen product.
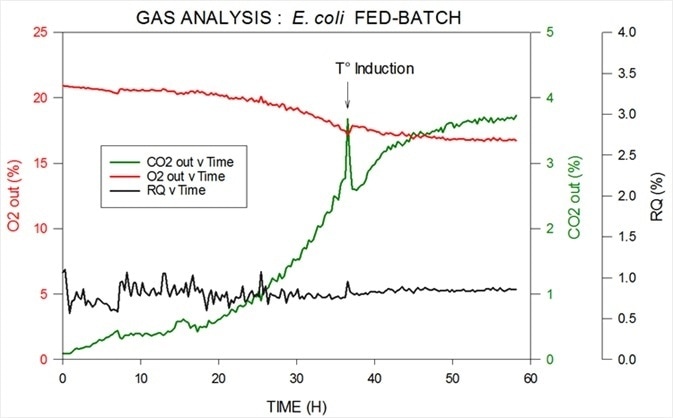
Figure 4. Off-gas and RQ data generated by MS from E. coli fed-batch fermentation. Image Credit: Thermo Fisher Scientific – Environmental and Process Monitoring Instruments
Analysis of volatiles
In off-gas, respiratory gases are not the only species of interest which can be found. Volatile organics such as ethanol, ethyl acetate, methanol and even hydrogen sulfide can be seen at ppm levels in the headspace and the analysis of these volatile organics can provide vital information on the well-being of the fermentation.
Some technical challenges are posed by the analysis of volatile organics and these must be circumvented if the analytical data is to be meaningful and useful. For instance, measurement of the CH2OH+ fragment at mass 31 is required for the measurement of trace levels of ethanol and methanol.
It should be considered that there is an extremely large peak at mass 32 from the percentage levels of O2 in the vent gas. In order to carry out an accurate measurement of trace alcohol levels the tail from the 32 peak should be corrected.
The intensity of the tail from O2 at mass 31 compared with the intensity of the peak at mass 32 is around 0.02 %. The signal at mass 31 would be equivalent to around 40 ppm if the concentration of O2 was around 20 %. During calibration this interference is recorded to allow the proper correction in any subsequent analysis.
This interference level on a quadrupole M.S. is much higher and variable, leading to excessive uncertainty in low level ethanol measurement. Essentially, a low level ethanol signal would be ‘lost’ in the noise from the oxygen peak.
The measurement is highly reproducible by utilizing a magnetic sector instrument with ethanol and methanol quantifiable with a precision as low as 10 ppm. Data collected from an S. cerevisiae fed-batch fermentation is shown in Figure 5.
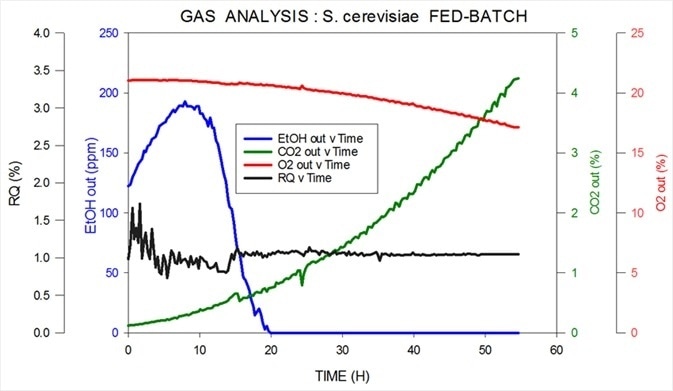
Figure 5. Off-gas and RQ data generated by MS from S. cerevisiae fed-batch fermentation. Image Credit: Thermo Fisher Scientific – Environmental and Process Monitoring Instruments
The MS from Thermo Scientific measures carbon dioxide, oxygen, nitrogen and argon in the inlet while measuring ppm levels of ethanol in the headspace in the outlet. It also calculates R.Q. Ethanol is consumed as the initial carbon source; then, in order to express the desired product this is switched over to glucose.
At the very beginning of the fermentation, precision is lower as the volume of oxygen consumption is low and the signal-to-noise ratio is correspondingly low. This timeframe where the cell count is extremely low is known as the ‘lag phase’. As the organisms begin to multiply precision improves quickly.
The standard performance specifications for the Prima PRO magnetic sector M.S. from Thermo Scientific are shown in Table 4. Precision is the standard deviation seen over 16 hours. The extremely high precision of 0.05 % relative over 16 hours for oxygen should be noted.
Including stream switching time the analysis time is 30 seconds per stream for all six components. Analysis time decreases to 10 seconds per stream if ethanol and methanol are removed from the analysis.
Table 4. Example of a standard performance specification for Prima PRO Process MS. Source: Thermo Fisher Scientific – Environmental and Process Monitoring Instruments
| Component |
Concentration range
%mol |
The precision of analysis by Prima PRO
(single standard deviation) ≤ |
| Nitrogen |
0 – 100 |
0.005 %mol |
| Oxygen |
0 – 100 |
0.005 %mol |
| Argon |
0 – 1 |
0.001 %mol |
| Carbon dioxide |
0 – 10 |
0.1% relative or 0.0003 %mol* |
| Methanol |
0 – 1 |
2% relative or 0.001 %mol* |
| Ethanol |
0 – 1 |
2% relative or 0.001 %mol* |
*-Whichever is greater
Mammalian cell culture
Feed gas composition is fairly constant in bacterial and microbial fermentation as it is either air or air enriched with oxygen. However, in mammalian cell fermentation, the feed gas composition is a continually changing mixture of numerous compounds, for instance, oxygen, nitrogen, and carbon dioxide.
Feed gas concentration ranges are also very different, for instance carbon dioxide can vary from tens of parts per million to tens of percent. The use of an overlay gas introduces more complications as the overall inlet gas composition will be a mixture of sparge gas and overlay gas.
Another factor which could contribute to carbon dioxide levels in the outlet is using sodium bicarbonate as a pH buffer. All of these factors contribute to a difficult set of needs for the off-gas analyzer if the instrument is to supply meaningful online data.
This is particularly crucial if it is to effectively complement off-line data like metabolite concentration and viable cell count data. Figure 6 supplies details on how a magnetic sector’s speed and precision affect its ability to provide this valuable data.
In the following example, a Prima BT was employed to monitor two 5 liter bioreactors where modified Chinese Hamster Ovary (C.H.O.) cells were being utilized to express monoclonal antibodies.
The MS analyzed inlet and outlet gases for O2, CO2, N2 and Ar in each bioreactor. Glucose levels, cell count (both viable and total), lactate levels and were also analyzed off-line. There was only one inlet for each bioreactor (sparge gas) which fed a combination of O2, CO2, N2 and Air.
In order to control pH, carbon dioxide was used, while oxygen feed was utilized to control the dissolved oxygen. Including settling time, M.S. cycle time was 15 seconds per point. To allow for a reduction in noise caused by perturbations in sparge gas concentrations they were averaged across 99 readings.
As there was not much activity at the start of the run, Figure 6 shows data from 100 hours onwards. Bio 1 shows a very different inlet CO2 profile despite both bioreactors being controlled with the same controller. This was because large volumes of CO2 were injected to adjust pH.
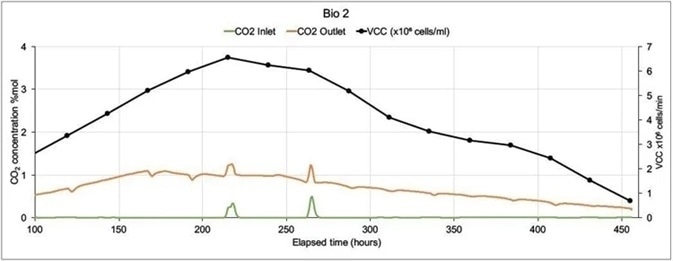
Figure 6. On-line CO2 inlet and outlet data and off-line Viable Cell Count data from two mammalian cell culture bioreactors. Image Credit: Thermo Fisher Scientific – Environmental and Process Monitoring Instruments
Bio 2’s more stable CO2 profile resulted in a higher Viable Cell Count with an extended culture duration. In subsequent runs the control strategy was altered which led to increases in VCC levels and extensions in culture durations.
Scale-up from laboratory to bulk production
Typically, manufacturing processes begin with cell cultures grown in a laboratory. Cells will be transferred sequentially to increasingly large fermenters, ultimately being moved into production vessels which can hold up to 20000 liters of cells and growth media.
It is crucial that the precise environment needed by specific cells remains healthy and growth is maintained. The collection of precise off-gas analytical data is needed at each stage of the scale-up process, from laboratory to pilot plant and eventual bulk production.
It may be necessary to use separate M.S. analyzers in the laboratory and the plant in some applications, while in others a single mass spectrometer equipped with an appropriate R.M.S. multi-stream inlet will be enough to monitor all of the fermentors.
Figure 7. Prima BT process development MS. Image Credit: Thermo Fisher Scientific – Environmental and Process Monitoring Instruments
To attain a smooth transition throughout the various stages of scale-up it is crucial that results from the two analyzer platforms correlate. Figure 7 shows an example of a mass spectrometer suitable for fermentation process development, the Prima BT, while Figure 8 shows the Prime PRO, an example of a mass spectrometer suitable for production process monitoring.
Figure 8. Prima PRO process MS. Image Credit: Thermo Fisher Scientific – Environmental and Process Monitoring Instruments
Both of these systems use Thermo Scientific’s magnetic sector analyzer for high precision multi-component gas analysis, while each system can also supply the distinctly reliable Rapid Multistream Sampler.
Summary
For fermentation off-gas analysis, magnetic sector mass spectrometers have demonstrated the highest levels of precision. These instruments have been efficiently monitoring fermentor off-gas at a variety of leading biotechnology and pharmaceutical companies around the globe for many years.
The magnetic sector analyzer combines excellent stability with high speed, lending itself to this demanding application perfectly.
Thermo Fisher Scientific’s gas analysis M.S. product range includes the Prima BT and Prima PRO, both of which offer fast, precise off-gas analysis through each stage of fermentation and cell culture processes, whether these are in a pilot plant, laboratory, or during bulk production.
The Prima PRO can monitor over 60 bioreactors with no compromise in sterility, while the Prima BT offers an ideal benchtop solution for smaller-scale bioreactors because of its ability to be configured with 15 samples and 6 calibration ports.
The extremely precise, comprehensive gas composition measurements which were supplied by each of these models can be incorporated into an A.P.C. system with ease. It is possible to achieve significant process control improvements very quickly, usuallly within a day or two of a start-up.
References
- M.G. Fári, U.P. Kralovánszky, The founding father of biotechnology: Károly (Karl) Ereky. Int. J. Hortic. Sci., Vol 12, n.1, p.9-12, 2006.
- David Pollard, Jens Christensen, Vent Gas Analysis, Encyclopaedia of Industrial Biotechnology: Bioprocess, Bioseparation and Cell Technology 2010, John Wiley & Sons.
- Joseph S. Alford, Bioprocess control: Advances and challenges, Computers & Chemical Engineering Volume 30, September 2006.
- P.C. van der Aar, A.H. Stouthamer, H.W. van Verseveld, Possible misconceptions about O2 consumption and CO2 production measurements in stirred microbial cultures, Journal of Microbiological Methods Volume 9, Issue 4, June 1989.
Acknowledgments
Produced using materials originally authored by Graham Lewis from Thermo Fisher Scientific.
About Thermo Fisher Scientific – Environmental and Process Monitoring Instruments
 We design and manufacture industry-leading products for Gas & particulate pollutants, Flow, gas and liquid measurement, Process analytical measurements, and Industrial Hygiene.
Technologies have proven to help customers improve efficiency, ensure process and quality control, maintain regulatory compliance, and increase worker safety.
Process mass spectrometers
Maximize product yield and increase profitability with process mass spectrometry analysis. Process gas analyzers are engineered to meet a number of challenging process applications in the petrochemical, iron, and steel, and biotechnology industries. Highly reliable and easy-to-own, Thermo Fisher Scientific process gas analysis technologies deliver faster, more complete, lab-quality online gas analysis and process analytics. Learn More
Process analytical technology/Biopharma
Process Analytical Technology (PAT) is a regulatory framework initiated by the United States’ Food and Drug Administration (FDA) that encourages pharmaceutical manufacturers to improve the process of pharmaceutical development, manufacturing, and quality control.
PAT aims to improve process efficiency by defining Critical Process Parameters (CPP) and monitoring these CPPs to stay within a defined limit, either in-line or on-line to maintain a product’s Critical Quality Attributes (CQA). Monitoring CPPs with process mass spectrometry gas analysis reduces over-processing, pinpoints contaminants, and increase product consistency. Learn More
Industrial hygiene
Industrial hygiene instruments keep your investments secure, your facilities compliant with local regulations, and your workers safe from leaking pollutants, gases, or toxic vapors. Make sure you have the most updated technology, with access to repair and calibration support to maintain reliable gas monitoring. With our environmental expertise, you can breathe easy knowing your company, workers, and neighboring communities have cleaner, safer, and healthier air quality. Learn More
Sulfur analyzers
Online sulfur analyzers replace expensive and time-consuming laboratory sampling. Get fast responses and wide measurement ranges of trace sulfur and total sulfur in flare gas, liquid, and vapor for reliable emissions monitoring. Learn More
Gas & particulate analyzers
Increasingly stringent regulatory requirements are making it more difficult to maintain regulatory compliance and optimal process performance. Air quality monitoring and reporting requirements in the U.S., China, India, Europe, and Latin America are shifting and being redefined. Together we can arrive at solutions that make sound business sense. Learn More
Flow measurement
Flow measurement and process control are critical aspects of producing, handling, and transporting hydrocarbons around the world. With our Thermo Scientific suite of flow computers and flow meters, we enable our customers to reduce cost, decrease lost material, automate, and monitor critical points in processes. From field to control room and upstream to downstream, our products provide greater control, confidence, and reliability. Learn More
Sponsored Content Policy: News-Medical.net publishes articles and related content that may be derived from sources where we have existing commercial relationships, provided such content adds value to the core editorial ethos of News-Medical.Net which is to educate and inform site visitors interested in medical research, science, medical devices and treatments.