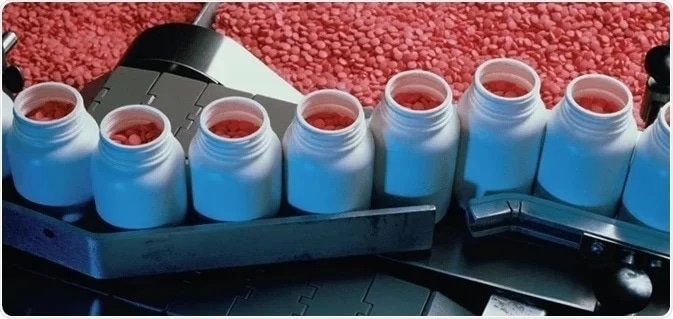
Image Credit: Thermo Fisher Scientific – Environmental and Process Monitoring Instruments
A vital stage for a wide range of pharmaceutical processes is the partial or total removal of a solvent or solvents from a product or an intermediate. The drying process required can occur in a number of process vessels, including tray dryers, vacuum dryers, and rotary dryers.
The success of the completed drying process was measured by simply taking a sample for laboratory analysis, until now. In order to measure organic solvent concentrations in the active pharmaceutical ingredient (API) or intermediate gas chromatography was utilized and a Karl Fischer titration was usually performed to assess residual water levels.
The loss on drying (LOD) was used to determine the quantity of residual solvent. The drying process had to be completely reset If the sample failed the LOD test for one or more of the solvents. If the drying was performed under a vacuum more complications were likely to happen in terms of both sampling the API and restarting the dryer.
In order to prevent a failed LOD test this risk led to the tendency to increase drying times, but more process challenges happened. As the drying stage is generally a rate-limiting step during manufacture, a longer drying time had an extreme effect on production lead times.
In a number of instances, the only way to stop this bottleneck was to extend drying capacity, at a great cost. There were also some cases when over-drying of the product happened. This leads to a heightened risk of damaging influences on the polymorphic form of the final product and production problems later in the process.
The PAT initiative
In 2004, The Federal Drug Administration’s Process Analytical Technology (PAT) initiative highlighted the implementation of process analytical techniques to enhance process understanding across the pharmaceutical industry.
The drying process was the perfect candidate for the study and PAT teams began looking for appropriate techniques for continuous process analysis.
Disadvantages of spectroscopic techniques
Firstly, numerous PAT teams investigated spectroscopic techniques like near infra-red (NIR) technology for product drying. These techniques seemed attractive on the surface, as direct sampling was performed in the bulk API. However, there were some limitations to this approach. These included:
- The probe only produces a ‘spot’ sample and is not representative of the complete residual solvent in the product.
- To prevent damage to the probe caused by the rotating paddles in the case of paddle dryers retractable probes are required.
- The API coats the sampling probes.
- A number of API drying processes require the removal of two or more solvents from a potential list of over 30 compounds, necessitating complex chemometric modeling to turn the spectroscopic data into process-friendly concentration data.
Advantages of mass spectrometry techniques
Gas analysis that utilizes process mass spectrometry gives simple benefits across both data manipulation and sampling, including:
- Assembling samples at the dryer outlet, either in the vacuum suction line or outlet airline, is a simple procedure which only requires a Swagelok™ type connection, a heated sample line, and a standard particulate filter with a disposable element.
- The ability to simplify the analysis of even complex mixtures by utilizing the fragmentation patterns of the molecules in the mass spectrometer’s ion source, which are effective ‘fingerprints.’ For instance, figure 1 highlights the fragmentation pattern for n-propanol while figure 2 shows that of isopropanol.
- Verification of vacuum integrity, either by looking for air leaks or by helium leak checking.
- Feasible sampling from vacuum drying processes functioning at high vacuum pressure usually ranges 10-5 to 10-6 mbar.
- Acquisition of samples from the headspace above the product to confirm effective measurement of the bulk product in the dryer and to decrease the amount of problems that arise from a lack of homogeneity in the product.
Although a good range of understanding and data was delivered by implementing gas analysis mass spectrometers on drying processes, a number of users experienced problems over time from three main categories:
- Difficulty sampling over wide pressure ranges
- Contamination of the mass spectrometry analyzer
- Converting mass spectrometry data into concentration data
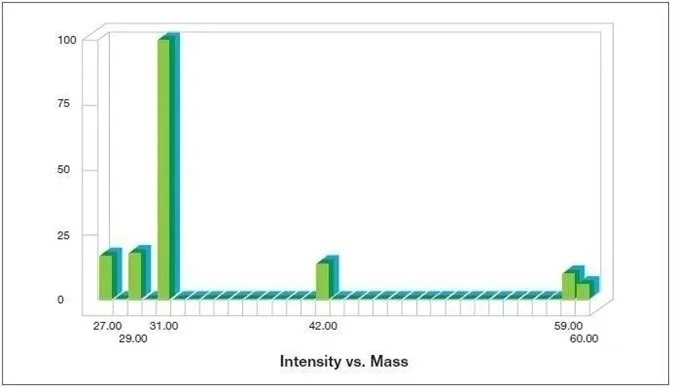
Figure 1. Fragmentation pattern for n-propanol as generated by the Thermo Scientific™ GasWorks Software. Image Credit: Thermo Fisher Scientific – Environmental and Process Monitoring Instruments
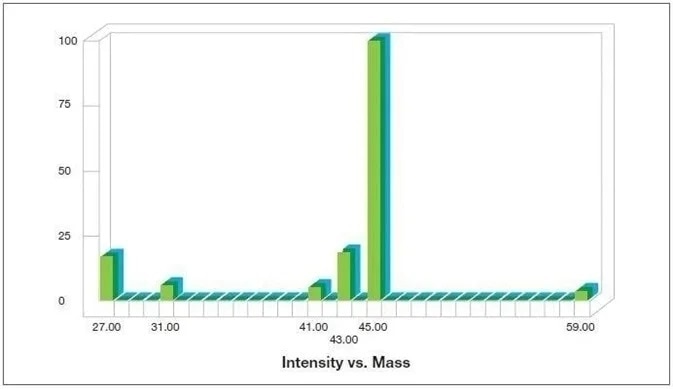
Figure 2. Fragmentation pattern for isopropanol as generated by the Thermo Scientific™ GasWork Software. Image Credit: Thermo Fisher Scientific – Environmental and Process Monitoring Instruments
Analyzer contamination
The early mass spectrometers utilized for solvent drying were universally based on quadrupole analyzers. This kind of analyzer is infamously prone to contamination by hydrocarbons which result in analyzer drift and necessitate taking the mass spectrometer offline for cleaning.
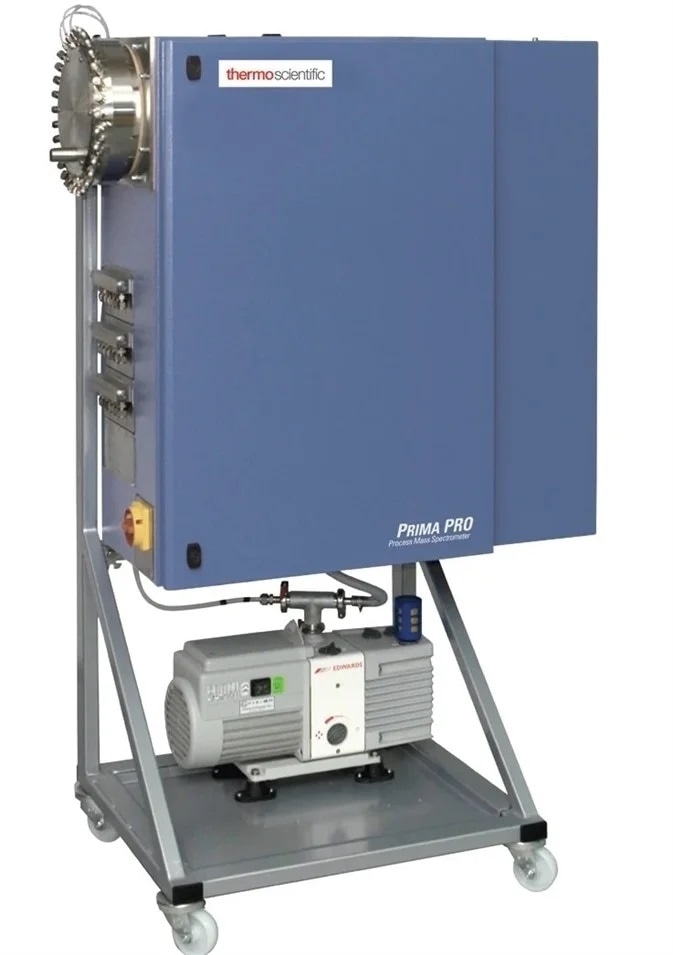
The Thermo Scientific™ Prima™ PRO Process Mass Spectrometer is an alternative which is extremely dependable and has great accuracy while featuring a magnetic sector analyzer, this can be seen in Figure 3.

Figure 3. The magnetic sector analyzer within the Prima PRO Process Mass Spectrometer. Image Credit: Thermo Fisher Scientific – Environmental and Process Monitoring Instruments
The magnetic sector analyzer has been proven to provide unparalleled performance for online industrial gas analysis and is predicated on experience spanning thirty years of industrial mass spectrometry.
Some key benefits of the magnetic sector analyzer include better precision and accuracy, resistance to contamination and long intervals between calibrations. Usually, depending on the gases and complexity of the mixture being analyzed, analytical accuracy is between 2 and 10 times better than a quadrupole analyzer.
One special feature of the analyzer’s magnet is that it is laminated, and its scanning speed is equivalent to that of quadrupole analyzers, providing the unique combination of rapid analysis and high stability. This combination facilitates extremely stable analysis of an unlimited amount of user-defined gases at high-speeds.
The scanning magnetic sector is managed with 24-bit precision via a magnetic flux measuring device in order to achieve exceptionally stable mass alignment. The ion source encapsulated within the analyzer also facilitates minimum background interference, high sensitivity, and optimal contamination resistance.
This high-energy (1000 eV) analyzer has the ability to monitor high percent level concentrations of organic compounds without coming up against contamination or drift and provides a robust performance which is extraordinary in the presence of gases and vapors which can potentially contaminate the internal vacuum components.
Sampling from vacuum drying processes
As the analyzer itself is functioning at a high vacuum, in principle, the mass spectrometer is ideal for monitoring vacuum processes. Although, it is crucial that the pressure in the mass spectrometer remains constant as the process pressure adjusts from atmospheric down to the vacuum levels required to dry the product.
If the pressure within the mass spectrometer is not managed The signals will fluctuate in line with the sample pressure, resulting in the output data being rendered useless. Early mass spectrometry vacuum drying systems used a single control valve, usually a voltage-sensitive orifice (VSO) valve, which was connected to a gauge monitoring the sample pressure.
As the sample pressure adjusted, the VSO valve opened and closed in order to sustain a persistent pressure in the mass spectrometer. Its function was enough for simple vacuum processes, but it suffered from a range of critical limitations, these included:
- At low pressures, usually lower than 10 mbar, the valve was nearly fully open which limited the amount of control available. At around 5 mbar, The valve was completely open meaning that control of the mass spectrometer pressure was non-existent below this point
- For users who needed to monitor a number of dryers, it was necessary to switch the mass spectrometer between a dryer at high pressure at the start of the drying cycle and a dryer at low pressure at the end of its cycle. The control valve was forced to balance these pressure swings immediately, but the response characteristics of a single valve are not appropriate for this kind of duty; long delays have to be integrated into the stream switching times, particularly as the solvents are at the extreme opposite ends of the concentration range.
Thermo Scientific Prima PRO Process Mass Spectrometer. Image Credit: Thermo Fisher Scientific – Environmental and Process Monitoring Instruments
Variable pressure inlet
The variable pressure inlet inside the Prima PRO mass spectrometer analyzer consists of two control valves that function in opposition; one valve closes as the other opens. This combination supplies fast control with an accurate and wide dynamic range. The inlet manages the analyzer pressure at just 0.1 mbar, so it can withstand sample pressures as low as 0.3 mbar.
Figure 4 illustrates the variable pressure inlet is in schematic form and Figure 5 demonstrates the Prima PRO mass spectrometer equipped with the multipoint inlet that has the capacity to sample from up to 10 dryers. A single point inlet is also available for R&D and pilot plant users.
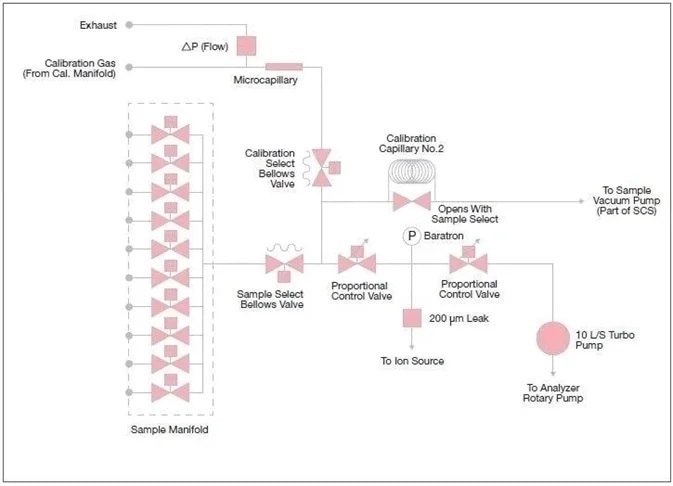
Figure 4. A schematic diagram of the variable pressure inlet within the Prima PRO Process Mass Spectrometer. Image Credit: Thermo Fisher Scientific – Environmental and Process Monitoring Instruments

Figure 5. The Prima PRO Process Mass Spectrometer with the multipoint variable pressure inlet attached. Image Credit: Thermo Fisher Scientific – Environmental and Process Monitoring Instruments
Using mass spectrometry data to control the drying process
Early mass spectrometers used for solvent drying only provided qualitative information as they monitored ion currents from the principal peaks of the solvents of interest.
Although users were aided by this information by gaining more knowledge of the dynamics of the drying process, the analyzer drift and the lack of repeatability it caused between drying runs inhibited the acceptability of the technique for process control.
The nitrogen signal at mass 28 was employed as an internal standard to produce a ‘relative response,’ in some cases, but this data was not consistently accessible. It was not helpful in the cases where one peak could not be uniquely assigned to one solvent as there was large overlap between the fingerprints of the solvent.
The variable pressure inlet enables the introduction of calibration gases under software control when using the Prima PRO mass spectrometer, allowing the Thermo Scientific GasWorks software to supply solvent concentrations instead of solvent ion currents.
The special combination of magnetic sector stability, accurate inlet pressure control, and GasWorks quantitative software ensures that the process data supplied by the Prima PRO mass spectrometer is both reliable and precise.
There is a wide range of industry-standard communication protocols which facilitate the transfer of this data to process control systems to enhance drying processes – with which GasWorks software is fully CFR 21 Part11 compliant.
An example of a standard two-solvent drying curve is shown in Figure 6. It shows the removal of water and isopropanol as the pressure falls from atmospheric to 2 mbar. The inlet pressure stays the same, at 0.1 mbar, during the process.
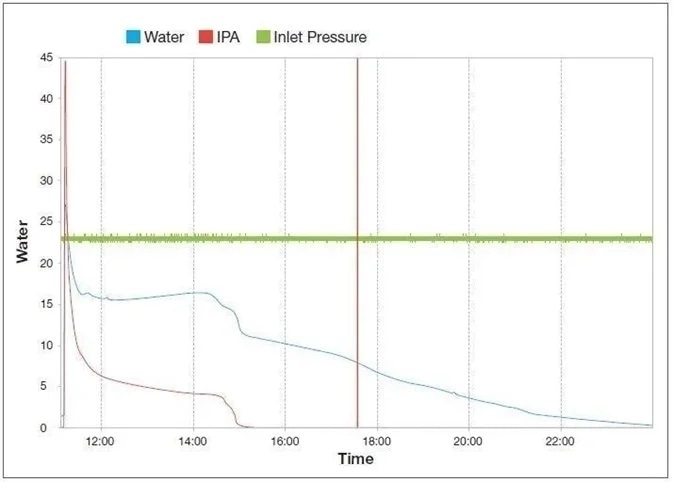
Figure 6. Two-solvent vacuum drying curve indicating the removal of water (blue line) and iso-propanol (red line) as the pressure drops from atmospheric to 2 mbar while the inlet pressure (green line) remains constant at 0.1 mbar. Image Credit: Thermo Fisher Scientific – Environmental and Process Monitoring Instruments
Summary
The Prima PRO process mass spectrometer provides the best online measurement precision and stability available for dryer process monitoring and control. Its fault-tolerant design, together with extended intervals between maintenance and simplified maintenance procedures, facilitate maximum availability of the analyzer.
Figure 7 illustrates the plug-n-play standard service kit which is supplied with each unit. The dependability of the Prima PRO mass spectrometer is expressed via the industry-best three-year parts and labor warranty.
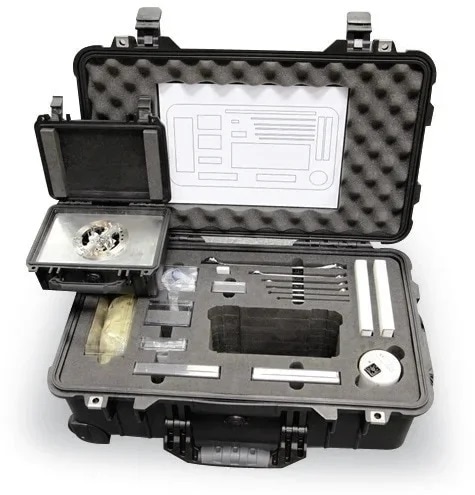
Figure 7. Prima PRO Process Mass Spectrometer service kit. Image Credit: Thermo Fisher Scientific – Environmental and Process Monitoring Instruments
Acknowledgments
Produced from materials originally authored by Graham Lewis from Thermo Fisher Scientific.
About Thermo Fisher Scientific – Environmental and Process Monitoring Instruments
 We design and manufacture industry-leading products for Gas & particulate pollutants, Flow, gas and liquid measurement, Process analytical measurements, and Industrial Hygiene.
Technologies have proven to help customers improve efficiency, ensure process and quality control, maintain regulatory compliance, and increase worker safety.
Process mass spectrometers
Maximize product yield and increase profitability with process mass spectrometry analysis. Process gas analyzers are engineered to meet a number of challenging process applications in the petrochemical, iron, and steel, and biotechnology industries. Highly reliable and easy-to-own, Thermo Fisher Scientific process gas analysis technologies deliver faster, more complete, lab-quality online gas analysis and process analytics. Learn More
Process analytical technology/Biopharma
Process Analytical Technology (PAT) is a regulatory framework initiated by the United States’ Food and Drug Administration (FDA) that encourages pharmaceutical manufacturers to improve the process of pharmaceutical development, manufacturing, and quality control.
PAT aims to improve process efficiency by defining Critical Process Parameters (CPP) and monitoring these CPPs to stay within a defined limit, either in-line or on-line to maintain a product’s Critical Quality Attributes (CQA). Monitoring CPPs with process mass spectrometry gas analysis reduces over-processing, pinpoints contaminants, and increase product consistency. Learn More
Industrial hygiene
Industrial hygiene instruments keep your investments secure, your facilities compliant with local regulations, and your workers safe from leaking pollutants, gases, or toxic vapors. Make sure you have the most updated technology, with access to repair and calibration support to maintain reliable gas monitoring. With our environmental expertise, you can breathe easy knowing your company, workers, and neighboring communities have cleaner, safer, and healthier air quality. Learn More
Sulfur analyzers
Online sulfur analyzers replace expensive and time-consuming laboratory sampling. Get fast responses and wide measurement ranges of trace sulfur and total sulfur in flare gas, liquid, and vapor for reliable emissions monitoring. Learn More
Gas & particulate analyzers
Increasingly stringent regulatory requirements are making it more difficult to maintain regulatory compliance and optimal process performance. Air quality monitoring and reporting requirements in the U.S., China, India, Europe, and Latin America are shifting and being redefined. Together we can arrive at solutions that make sound business sense. Learn More
Flow measurement
Flow measurement and process control are critical aspects of producing, handling, and transporting hydrocarbons around the world. With our Thermo Scientific suite of flow computers and flow meters, we enable our customers to reduce cost, decrease lost material, automate, and monitor critical points in processes. From field to control room and upstream to downstream, our products provide greater control, confidence, and reliability. Learn More
Sponsored Content Policy: News-Medical.net publishes articles and related content that may be derived from sources where we have existing commercial relationships, provided such content adds value to the core editorial ethos of News-Medical.Net which is to educate and inform site visitors interested in medical research, science, medical devices and treatments.