The NanoDrop™ One microvolume UV-Vis spectrophotometer from Thermo Scientific™ can facilitate the accurate quantification of nucleic acid or protein samples, despite the presence of a number of frequently encountered contaminants.
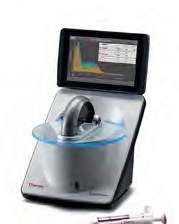
Image Credit: Thermo Fisher Scientific – Materials & Structural Analysis
Thermo Scientific’s novel Acclaro™ Sample Intelligence technology is at the core of the NanoDrop One instrument, enabling the provision of comprehensive sample quality information by identifying common contaminants and determining genuine sample concentrations.
Having this information available empowers users to make better-informed decisions in regard to downstream experiments and troubleshooting challenging extractions.
This article outlines how the Acclaro Contaminant Identification (ID) feature identifies protein contamination in nucleic acid samples.
Methods of quantifying nucleic acids
Nucleic acid quantification is conventionally conducted via absorbance measurements at 260 nm - a straightforward, popular method for many molecular biology laboratories looking to acquire concentration and purity information from nucleic acid samples.
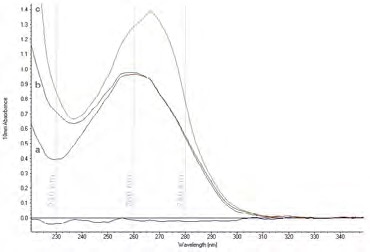
Figure 1. Contaminants can affect the UV absorbance spectrum of a nucleic acid preparation. The UV absorbance spectrum of a) a pure nucleic acid sample (with a peak at 260 nm and a trough at 230 nm), b) a nucleic acid sample contaminated with guanidine, and c) a nucleic acid sample contaminated with phenol. Image Credit: Thermo Fisher Scientific – Materials & Structural Analysis
When evaluating samples, many contaminants from the nucleic acid extraction process also absorb in different regions of the UV spectrum (Figure 1). This poses challenges when the contaminant absorption is in an identical UV range to the nucleic acids.
When this happens, quantification results can be impacted in a number of ways. The A260 value can become artificially inflated, resulting in an inaccurate concentration. Purity ratios may also be impacted, hindering the method’s capacity to assess the presence of UV-absorbing contaminants.
While relying solely on purity ratios cannot fully assess potential contaminants in nucleic acid samples, the use of purity ratios with full-spectral data improves determinations of nucleic acid sample purity and improves A260 measurement accuracy.
Table 1. Generally accepted purity ratio ranges for “pure” nucleic acid samples in TE buffer. Source: Thermo Fisher Scientific – Materials & Structural Analysis
| Samples |
260/280 |
260/230 |
| DNA |
1.8–2.0 |
1.8–2.2 |
| RNA |
2.0–2.2 |
1.8–2.2 |
Confirmation that purity ratios are within an acceptable range (Table 1) for a ‘pure’ nucleic acid sample is generally adequate, but visual analysis of a sample spectrum or further technical support may become necessary when purity ratios fall outside this range.
Historically, the analysis of a sample’s spectrum had been entirely qualitative, with the identification of specific contaminants highly dependent on the researcher’s experience and expertise.
The Acclaro sample intelligence technology is built into the NanoDrop One spectrophotometer, offering researchers a quantitative method for contaminant identification.
A chemometric approach is used to evaluate the sample spectrum using a reference library of spectra, predicting both the presence and identity of potential contaminants.
The Acclaro contaminant ID feature is able to detect phenol, protein and guanidine salts in RNA and dsDNA samples.
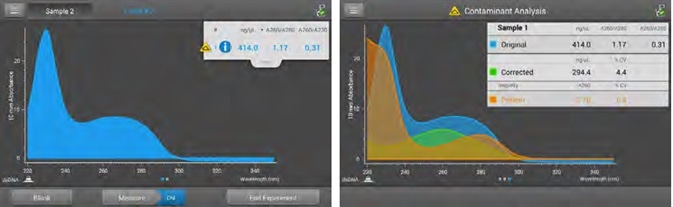
Figure 2. Acclaro Contaminant ID. Measurement screen (left) displays the Acclaro Contaminant ID icon when the Acclaro algorithms have detected a contaminant in this dsDNA sample. 3b) Contaminant Analysis screen (right) shows the absorbance spectra of the Original (DNA plus contaminant), Corrected (DNA minus contaminant, with the characteristic peak at 260 nm and trough at 230 nm), and Impurity (identified contaminant, with the characteristic peak at 280 nm and an increase in absorbance below 250 nm) and includes data on concentration, 260/280 and 260/230 ratios. To ensure reproducible results, the Corrected value should be used in planning downstream experiments. Image Credit: Thermo Fisher Scientific – Materials & Structural Analysis
The software provides real-time alerts upon the detection of a contaminant, displaying a yellow contaminant ID icon (Figure 2) alongside the sample number.
Selecting this icon will provide full contaminant analysis (Figure 2), including any identified contaminants, deconvolved spectra, corrected DNA concentration and a %CV which represents the confidence of the prediction.
Contaminants in nucleic acid samples
Protein is a common and major contaminant in nucleic acid preparations, contributing to the absorbance at 260 nm and inflating the nucleic acid concentration.
This is typically identified via a notable decrease in the 260/280 purity ratio, occurring due to amino acid residues (tyrosine, tryptophan and phenylalanine) and cystine disulfide bonds in protein which will absorb at 280 nm.
The 260/280 ratio was initially regarded as a sensitive detection method for DNA contamination in protein preparations1 and has seen wide adoption by the molecular biology community in the detection of protein contamination in nucleic acid preparations.
This approach does have some limitations, however. The extinction coefficients of proteins are much smaller than nucleic acids, meaning that a significant amount of protein is necessary to affect the 260/280 purity ratio.2,3,4
Yet, scientists have observed nucleic acid preparations with low 260/280 purity ratios, despite these challenges.
Phenol is another significant contaminant found in purified nucleic acids. Phenol has historically been employed in the separation of protein from nucleic acids since the 1950s.
Several protocols and formulations have been developed, but the most prevalent and widely used method was developed in the 1980s – a combination of phenol, guanidinium thiocyanate and chloroform to facilitate the acquisition of highly pure, undegraded total RNA in a single step.1,2
This approach has served as the development model for several RNA extraction kits using various formulations of guanidium thiocyanate, phenol and chloroform to successfully denature proteins and lyse cells such as RNases and DNases.
The conventional approach to detecting phenol contamination requires calculating and assessing a purity ratio (using absorbances at 260/280 or 260/230).
However, this method offers limited effectiveness due to phenol’s absorbance peak (270 nm) and the purity ratios of pure phenol being similar to the ratios observed for pure RNA and DNA (Table 1).
Materials and methods
Double-stranded DNA (dsDNA) stock was prepared via the dilution of salmon sperm DNA solution (Invitrogen™, #15632-011) in Tris-EDTA (TE) buffer (Fisher BioReagents™, pH 7.6, BP-2474- 500).
A protein stock was prepared via the dilution of a solution of bovine serum albumin (BSA, Sigma Aldrich®, #A7284) in TE buffer. Stock concentrations were determined using the NanoDrop One spectrophotometer, comparing these against a TE blank.
Mass calculations were performed using the factor 50 ng-cm/µL for dsDNA and an extinction coefficient E1% 6.7 for BSA.
Five replicates for each of the nine mixtures of protein and DNA were prepared to generate the mixtures shown. These were measured on the NanoDrop One spectrophotometer against a TE blank. A fresh 1.5 µL aliquot of the appropriate mixture for each replicate was used.
A combination of software-calculated concentrations (corrected and original/uncorrected) and Acclaro Contaminant identity data was employed in the generation of data sets (Table 2).
A comparison was made between the original (uncorrected) concentrations and the software-corrected concentrations.
Since mixtures 1 to 4 did not contain sufficient levels of protein to trigger an Acclaro Contaminant ID result, corrected DNA concentration for mixtures 1 through 4 were determined via Acclaro spectral analysis using the TQ Analyst™ software package from Thermo Scientific™.
Table 2. DNA and protein mixtures were analyzed with the NanoDrop One instrument. Uncorrected DNA concentration was determined using the dsDNA application and corrected values for mixtures 5–9 were obtained directly from NanoDrop One Acclaro contaminant analysis results. The contaminant ID icon ( ) denotes mixtures having protein contamination levels high enough to trigger an Acclaro result. Source: Thermo Fisher Scientific – Materials & Structural Analysis
| Mixture |
1 |
2 |
3 |
4 |
5 |
6 |
7 |
8 |
9 |
| % DNA (by mass) |
100.0 |
57.1 |
40.0 |
28.6 |
16.7 |
10.0 |
7.1 |
4.8 |
1.6 |
| % Protein (by mass) |
0.0 |
42.9 |
60.0 |
71.4 |
83.3 |
90.0 |
92.9 |
95.2 |
98.4 |
Uncorrected DNA
[conc] ng/μL |
531.8 |
534.7 |
542.1 |
571.5 |
591.3 |
644.4 |
672.9 |
740.4 |
1097.6 |
Corrected DNA
[conc] ng/μL |
526.8 |
523.9 |
525.9 |
540.4 |
541.1 |
554.6 |
549.2 |
547.3 |
560.1 |
| 260/280 Purity Ratio |
1.94 |
1.89 |
1.84 |
1.74 |
1.60 |
1.45 |
1.34 |
1.21 |
0.89 |
| 260/230 Purity Ratio |
2.45 |
1.67 |
1.34 |
0.90 |
0.61 |
0.41 |
0.32 |
0.26 |
0.19 |
| Acclaro Flag |
No |
No |
No |
No |
|
|
|
|
|
Results and discussion
Table 2 displays an overview of the Acclaro Contaminant ID data acquired for nine mixtures containing DNA and varying levels of contamination (protein in this instance).
As levels of contamination increase, there is a greater discrepancy between the corrected and the original (uncorrected) results, highlighting the tendency for protein contamination to inflate an A260 concentration result.
The software-corrected results illustrate the algorithm’s capacity to quantitatively correct for these levels of protein contamination and ensure a more accurate DNA concentration than is possible using only the A260 value.
A significant amount of protein contamination is necessary before a notable change in the 260/280 purity ratios can be seen - protein contaminant levels must increase to above 72% in weight in order for the 260/280 ratio to exhibit a considerable reduction.
The Acclaro software flags the sample and displays a corrected concentration when dealing with high levels of contamination - within 10% of the result for the DNA only control.
Mixture 9 demonstrated the highest amount of protein contamination - >98% of the analyte mass in the sample – and the largest difference between the corrected and uncorrected concentration results. The software-corrected value was able to bring this result within 10% of the actual DNA concentration.
The Acclaro Contaminant ID feature of the NanoDrop One spectrophotometer offers clear benefits for the analysis of nucleic acid samples thanks to its ability to provide corrected DNA concentration results and robust contaminant identification.
Conclusions
Experiments utilizing nucleic acids must ensure that samples’ concentrations and purity are determined. The UV-Vis method typically employed in the quantification of nucleic acid preparations is reliant on the absorbance of nucleic acid molecules at 260 nm to ascertain nucleic acid concentrations in solution.
Contaminants co-purified with nucleic acids may also absorb light in the UV region of the spectrum, often resulting in an overestimation of calculated nucleic acid concentrations.
Purity ratios are often relied upon as an indication of the presence of contaminants in nucleic acid samples. While ‘out of range’ purity ratios may signify the presence of contaminants, these do not provide details on the identity and amounts of contaminants in the sample.
The Acclaro sample intelligence technology available via the NanoDrop One spectrophotometer affords users a robust chemometric approach to contaminant identification via UV spectrum analysis.
This powerful feature allows researchers to accurately identify the type of contaminant present in their sample, ascertain the level of contamination and acquire a corrected nucleic acid concentration.
The Acclaro sample intelligence technology empowers researchers to make more informed decisions, better troubleshoot sample preparations to reduce contamination and determine the optimum approach to any downstream experiments.
References
- Warburg, O. and W. Christian. 1942. Isolation and crystallization of Enolase. Z. Biochem. 1942. 310:384-421.
- Glasel, J.A. 1995. Validity of nucleic acid purities monitored by 260 nm/280 nm absorbance ratios. Biotechniques 18:62–63.
- Huberman, J.A. 1995. Importance of measuring nucleic acid absorbance at 240 nm as well as at 260 nm and 280 nm. Biotechniques 18:636.
- Manchester, K.L. 1995. Value of A260/A280 Ratios for the Measurement of Purity of Nucleic Acids. Biotechniques 19:208-210.
Acknowledgments
Produced from materials originally authored by Sean Loughrey and Brian Matlock from Thermo Fisher Scientific.
About Thermo Fisher Scientific – Materials & Structural Analysis
 Thermo Fisher Materials and Structural Analysis products give you outstanding capabilities in materials science research and development. Driving innovation and productivity, their portfolio of scientific instruments enable the design, characterization and lab-to-production scale of materials used throughout industry.
Sponsored Content Policy: News-Medical.net publishes articles and related content that may be derived from sources where we have existing commercial relationships, provided such content adds value to the core editorial ethos of News-Medical.Net which is to educate and inform site visitors interested in medical research, science, medical devices and treatments.