The NanoDrop™ One microvolume UV-Vis spectrophotometer from Thermo Scientific™ is able to facilitate the accurate quantification of nucleic acid or protein samples in the presence of frequently encountered contaminants such as protein.
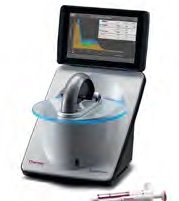
Image Credit: Thermo Fisher Scientific – Materials & Structural Analysis
Thanks to the novel Thermo Scientific™ Acclaro™ Sample Intelligence technology, the NanoDrop One delivers comprehensive sample quality information via the identification of common contaminants and the provision of true sample concentrations.
Using this information, researchers can make more informed decisions around downstream experiments and troubleshooting problematic extractions.
This article explores the use of the Acclaro Contaminant Identification (ID) feature in the detection of protein contamination in nucleic acid samples.
It also demonstrates the capacity of the Acclaro Contaminant ID feature to accurately identify protein contamination – doing so by subtracting the contaminant’s contribution from the original absorbance value to offer an accurate nucleic acid concentration.
This feature also minimizes the impact of protein components in purified nucleic acid samples on downstream workflows.
The quantification of nucleic acids was historically performed via absorbance measurements acquired at 260 nm - a rudimentary yet popular method in an array of molecular biology laboratories looking to determine the concentrations and purity of nucleic acid samples.
One key consideration when evaluating samples is that a significant number of contaminants from the nucleic acid extraction process also tend to absorb in different regions of the UV spectrum.
The widely accepted purity ratio ranges for ‘pure’ nucleic acid samples in TE buffer for DNA are 1.8–2.0 in the 260/280 ratio and 1.8–2.2 in the 260/230 ratio. For RNA, the acceptable ranges are 2.0–2.2 for the 260/280 ratio and 1.8–2.2 for the 260/230 ratio.
Should contaminants absorb in an identical UV range as nucleic acids, this can directly impact quantification results, artificially inflating the A260 value and leading to an inaccurate concentration measurement.
This can also impact the purity ratios that have long been a means of assessing the presence of UV-absorbing contaminants.
Sole reliance on purity ratios alone will not afford researchers a full assessment of the potential contaminants in nucleic acid samples. It is possible, however, to utilize purity ratios alongside full-spectral data to better determine nucleic acid sample purity and ensure a more accurate A260 concentration measurement.
Ensuring that purity ratios fall into an acceptable range for a ‘pure’ nucleic acid sample is usually adequate, but when purity ratios do fall outside this accepted range, it may be necessary to perform a visual analysis of the sample spectrum or seek further technical assistance.
Previously, any analysis of a sample’s spectrum had been entirely qualitative, with the experience of the researcher being the key factor in any successful identification of specific contaminants.
The NanoDrop One spectrophotometer offers built-in Acclaro sample intelligence technology, providing a robust quantitative method for contaminant identification in a sample.
Acclaro uses a chemometric approach to analyze any chemical components present in the sample, leveraging powerful algorithms to evaluate the sample spectrum against a reference library of spectra. The software then makes predictions about the presence and identity of contaminants based on this evaluation.
The Acclaro contaminant ID feature is able to detect contaminants in dsDNA and RNA samples, providing users with software notifications to alert them of the presence of a contaminant in real-time.
This takes the form of a yellow contaminant ID icon next to the sample number, which users can expand to view comprehensive contaminant analysis details, including identified contaminants, deconvolved spectra, corrected DNA concentration and a %CV representing the confidence of the prediction.
Contaminants in nucleic acid samples
Protein is a significant and frequently encountered contaminant in nucleic acid preparations. Protein contributes to the absorbance at 260 nm, artificially increasing the nucleic acid concentration, and is detected by noting a decrease in the 260/280 purity ratio.
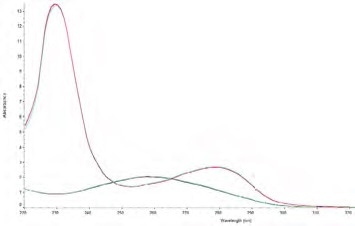
Figure 1. Pure DNA and pure protein spectra overlaid on the same graph. The DNA spectrum (greenblue) has the characteristic peak at 260 nm and trough at 230 nm, whereas, the protein spectrum (red-blue) has the characteristic peak at 280 nm and an increase in absorbance below 250 nm. Image Credit: Thermo Fisher Scientific – Materials & Structural Analysis
The decrease in this ratio takes place due to the presence of amino acid residues (tyrosine, tryptophan and phenylalanine) and the cystine disulfide bonds in protein absorb at 280 nm (Figure 1).
The 260/280 ratio is a sensitive means of detection for DNA contamination in protein preparations,1 which was later implemented by the wider molecular biology community in the detection of protein contamination in nucleic acid preparations.
Despite its popularity, the 260/280 ration method does have known limitations.
The extinction coefficients of proteins are very small compared to those of nucleic acids, meaning that it takes a significant amount of protein to affect the 260/280 purity ratio.2,3,4 Scientists do observe nucleic acid preparations with low 260/280 purity ratios, however.
The utilization of phenol in the separation of protein from nucleic acids has been a widely used method since the 1950s, seeing the development of a range of protocols and formulations since that time.
The 1980s saw the development of a popular technique using a mixture of guanidinium phenol, thiocyanate and chloroform to acquire highly pure, undegraded total RNA in a single step.1,2
Many commercially available RNA extraction kits have been modeled after this technique with different formulations for cell lysis and protein denaturation.
The calculation and assessment of phenol contamination by one of the aforementioned purity ratios have seen widespread use.
This method is not exclusively effective due to phenol’s absorbance peak at 270 nm and the fact that the purity ratios of pure phenol are similar to those of the acceptable ratios observed for pure DNA and RNA.
Materials and methods
Double-stranded DNA (dsDNA) stock was prepared via the dilution of salmon sperm DNA solution (Invitrogen™, #15632-011) in Tris- EDTA (TE) buffer (Fisher BioReagents™, pH 7.6, BP-2474-500).
A protein stock was prepared using a diluted solution of bovine serum albumin (BSA, Sigma Aldrich®, #A7284) in TE buffer. The NanoDrop One spectrophotometer was used to determine stock concentrations against a TE blank. Mass calculations were performed using the factor 50 ng-cm/µL for dsDNA and an extinction coefficient of E1% 6.7 for BSA.
A total of five replicates for each of nine mixtures of DNA and protein were prepared in order to generate the mixtures displayed here. These were also measured on the NanoDrop One spectrophotometer against a TE blank.
Table 1. DNA and protein mixtures analyzed with the NanoDrop One instrument. Uncorrected DNA concentration was determined using the dsDNA application and corrected values for mixtures 5–9 were obtained directly from NanoDrop One Acclaro contaminant analysis results. The contaminant ID icon ( ) denotes mixtures having protein contamination levels high enough to trigger an Acclaro result. Source: Thermo Fisher Scientific – Materials & Structural Analysis
| Mixture |
1 |
2 |
3 |
4 |
5 |
6 |
7 |
8 |
9 |
% DNA
(by mass) |
100.0 |
57.1 |
40.0 |
28.6 |
16.7 |
10.0 |
7.1 |
4.8 |
1.6 |
% Protein
(by mass) |
0.0 |
42.9 |
60.0 |
71.4 |
83.3 |
90.0 |
92.9 |
95.2 |
98.4 |
Uncorrected DNA
[conc] ng/μL |
531.8 |
534.7 |
542.1 |
571.5 |
591.3 |
644.4 |
672.9 |
740.4 |
1097.6 |
Corrected DNA
[conc] ng/μL |
526.8 |
523.9 |
525.9 |
540.4 |
541.1 |
554.6 |
549.2 |
547.3 |
560.1 |
260/280
Purity Ratio |
1.94 |
1.89 |
1.84 |
1.74 |
1.60 |
1.45 |
1.34 |
1.21 |
0.89 |
260/230
Purity Ratio |
2.45 |
1.67 |
1.34 |
0.90 |
0.61 |
0.41 |
0.32 |
0.26 |
0.19 |
Acclaro
Flag |
No |
No |
No |
No |
|
|
|
|
|
A fresh 1.5 µL aliquot of the corresponding mixture was utilized for each individual replicate. A combination of software-calculated concentrations (corrected and original/uncorrected) and Acclaro Contaminant identity data was used to generate data sets (Table 1).
A comparison was made between the original (uncorrected) concentrations and the software-corrected concentrations.
Since mixtures 1 to 4 did not contain sufficient levels of protein to trigger an Acclaro Contaminant ID result, the corrected DNA concentration for mixtures 1 through 4 were ascertained via Acclaro spectral analysis using the Thermo Scientific™ TQ Analyst™ software package.
Results and discussion
Table 1 displays the Acclaro Contaminant ID data acquired for each of the nine DNA/protein mixtures.
It was noted that as the level of contamination increased. There was also an increased discrepancy between the corrected and the original (uncorrected) results – this highlighted the way in which protein contamination can inflate an A260 concentration result.
The software-corrected results illustrate the algorithm’s ability to quantitatively correct for these levels of protein contamination, ensuring a more accurate DNA concentration than the A260 value alone.
It should be noted that a large amount of protein contamination is necessary before it is possible to observe a significant change in the 260/280 purity ratios.
Samples with as much as ~72% protein by weight will still exhibit an acceptable 260/280 purity ratio, but as protein contaminant levels increase from ~72% to 98%, the 260/280 ratio drops gradually from 1.74 to 0.89.
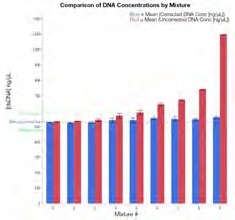
Figure 2. DNA concentration calculation comparisons. The average (N=5) is shown with error bars representing one SD from the mean for uncorrected (red), corrected (blue), actual dsDNA concentration (DNA-only control; dotted blue), and ±10% range from the average actual concentration (531.8 ng/μL; dotted green). Image Credit: Thermo Fisher Scientific – Materials & Structural Analysis
Figure 2 displays a comparison between uncorrected and corrected DNA concentration data in the presence of various levels of protein contamination. The presence of protein can potentially inflate the originally reported concentration.
The data also confirms that where there is a contaminant concentration above ~72% protein by weight, Acclaro is able to flag the sample and provide a corrected concentration (Table 1).
These corrected DNA concentrations were all found to be within 10% of the result for the DNA only control. Mixture 9 (containing the highest amount of protein contamination) exhibits the largest difference between corrected and uncorrected concentration results.
Yet, even this highly contaminated mixture containing protein representing >98% of the analyte mass in the sample returns a software-corrected result within 10% of the actual DNA concentration. These results were also found to be highly reproducible with standard deviations averaging under 1 ng/μL.
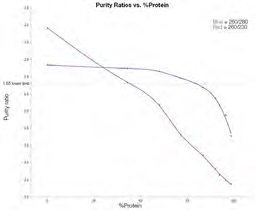
Figure 3. Average purity ratios for dsDNA/Protein mixtures 1–9. 260/230 purity ratio (red line); 260/280 purity ratio (blue line). Image Credit: Thermo Fisher Scientific – Materials & Structural Analysis
Figure 3 highlights the way that purity ratios shift in line with increasing levels of protein. As anticipated, the percentage of protein contamination increasing causes the 260/280 purity ratio to decrease.
The amount of protein must still be larger than 75% of the sample in order to observe a notable decrease in the 260/280 purity ratio (below 1.65) - the lower limit typically accepted for use in downstream experiments.
The 260/230 purity ratio can be seen to steadily decrease as the percentage of protein in the mixture increases. This data also highlights that the 260/230 ratio could be a more sensitive indicator of protein contamination.
A key challenge of leveraging this ratio in the detection of protein contamination is that many other common contaminants can also affect this ratio, for example, common salt buffers, guanidine salts and polysaccharides. Due to this, the 260/230 ratio alone is not an accurate confirmation of protein contamination.
The Acclaro Contaminant ID feature built into the NanoDrop One spectrophotometer offers a clear advantage to researchers in an array of settings thanks to its ability to provide a corrected DNA concentration and its capacity to identify contaminants present in a nucleic acid sample.
Conclusions
Experiments working with nucleic acids necessitate the accurate measurements of sample concentration and purity.
The UV-Vis method has been frequently employed in the quantification of nucleic acid preparations, but this relies on the absorbance of nucleic acid molecules at 260 nm to ascertain the concentration of nucleic acids in solution.
Contaminants, such as protein, that are co-purified with nucleic acids are also able to absorb light in the UV region of the spectrum, leading to a potential overestimation of calculated nucleic acid concentration. Purity ratios have historically been relied upon to highlight the presence of contaminants in nucleic acid samples.
‘Out of range’ purity ratios may indicate the presence of contaminants, but these are unable to offer comprehensive information on the identity and quantity of any contaminant present.
The Acclaro sample intelligence technology in the NanoDrop One spectrophotometer offers researchers a robust chemometric approach to protein contaminant identification via UV spectrum analysis.
This powerful feature enables researchers to identify the type of protein contaminant present in a sample and determine the level of contamination and obtain a corrected nucleic acid concentration.
Researchers can use the Acclaro sample intelligence technology to make informed decisions on how best to troubleshoot sample preparations to reduce contamination and how best to proceed using a sample in further downstream experiments.
References
- Warburg, O. and W. Christian. 1942. Isolation and crystallization of Enolase. Z. Biochem. 1942. 310:384-421.
- Glasel, J.A. 1995. Validity of nucleic acid purities monitored by 260 nm/280 nm absorbance ratios. Biotechniques 18:62–63.
- Huberman, J.A. 1995. Importance of measuring nucleic acid absorbance at 240 nm as well as at 260 nm and 280 nm. Biotechniques 18:636.
- Manchester, K.L. 1995. Value of A260/A280 Ratios for the Measurement of Purity of Nucleic Acids. Biotechniques 19:208-210.
Acknowledgments
Produced from materials originally authored by Sean Loughrey and Brian Matlock from Thermo Fisher Scientific.
About Thermo Fisher Scientific – Materials & Structural Analysis
 Thermo Fisher Materials and Structural Analysis products give you outstanding capabilities in materials science research and development. Driving innovation and productivity, their portfolio of scientific instruments enable the design, characterization and lab-to-production scale of materials used throughout industry.
Sponsored Content Policy: News-Medical.net publishes articles and related content that may be derived from sources where we have existing commercial relationships, provided such content adds value to the core editorial ethos of News-Medical.Net which is to educate and inform site visitors interested in medical research, science, medical devices and treatments.