The innovative, novel Thermo Scientific™ Acclaro™ Sample Intelligence technology is built into the Thermo Scientific™ NanoDrop™ One microvolume UV-Vis spectrophotometer.
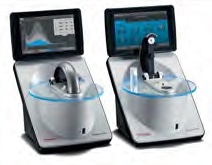
Thermo Scientific™ NanoDrop™ One and OneC Microvolume UV-Vis spectrophotometers. Image Credit: Thermo Fisher Scientific – Materials & Structural Analysis
This enables the accurate quantification of nucleic acid samples, despite the presence of frequently encountered contaminants that have been carried over from nucleic acid extraction methods.
A recent study aimed to measure DNA concentration in the presence of different levels of phenol contamination, comparing uncorrected and software-corrected concentration values.
Results confirmed that corrected DNA concentrations fell within 10% of the DNA-only control’s concentration, highlighting the software algorithm’s effectiveness in terms of its ability to identify phenol contamination, correct DNA concentration values and provide a more accurate concentration than that available using the A260 value alone.
With this information on hand, users can make more informed decisions around sample use in downstream experiments and troubleshoot extractions.
This article provides a basic introduction to the use of the Acclaro Contaminant ID feature, outlining how it can accurately identify phenol, guanidine and other reagent contaminants.
The feature achieves this by subtracting the contribution of the contaminant from the original absorbance value to provide an accurate nucleic acid concentration while minimizing the impact of reagent components in purified nucleic acid samples on downstream workflows.
The quantification of nucleic acids is a central technique in an array of experimental biomedical and biological techniques, as well as workflows involving nucleic acid samples.
Cutting-edge techniques, including PCR, qPCR, next-generation sequencing and cloning, necessitate the accurate determination of sample purity and awareness of variables that may potentially impact nucleic acid samples’ viability for use in downstream experiments.
Sample concentration, purity and quality remain the key sample variables that can be attained via a range of instruments.
Quantification of nucleic acids has historically seen the measurement of absorbance at 260 nm. This method’s limitation stems from the fact that contaminants from the nucleic acid extraction process will also absorb in some regions of the UV spectrum, directly impacting the quantification result’s accuracy and reliability.
Table 1. Purity ratio ranges generally accepted for pure nucleic acid samples in TE buffer. Notice that the purity ratio for pure phenol does not deviate greatly from the purity ratios for pure nucleic acids. Source: Thermo Fisher Scientific – Materials & Structural Analysis
| Samples |
260/280 |
260/230 |
| DNA |
1.8–2.0 |
1.8–2.2 |
| RNA |
2.0–2.2 |
1.8–2.2 |
| Pure Phenol |
1.6 |
2 |
The primary means of assessing the presence of UV-absorbing contaminants involves the review of purity ratios to confirm that these fall into an acceptable range (Table 1).
Sole reliance on purity ratios will not offer a full assessment of potential contaminants, however, and it is advisable to combine purity ratios with full-spectral data.
Doing so not only enhances an instrument’s capacity to determine the purity of a nucleic acid sample but can also provide an accurate concentration via A260 absorbance.
The analysis of a sample spectrum was historically a qualitative task that relied heavily on a researcher’s expertise and experience to identify specific contaminants present.
The Acclaro technology included with the NanoDrop One spectrophotometer offers users a cutting-edge quantitative means of contaminant identification, leveraging the power of chemometric analysis to determine any chemical components present.
This information assists scientists in making informed decisions around sample use in downstream reactions and or labor intensive workflows, reducing the risk of wastage for expensive or rare samples.
The Acclaro contaminant ID feature can detect contaminants in dsDNA and RNA samples, providing users with real-time software alerts to highlight the presence of a contaminant by displaying a yellow contaminant ID icon next to the sample number.
Users can expand this information to show complete contaminant analysis details, including identified contaminants, deconvolved spectra, corrected DNA concentration and a %CV which represents the confidence of the prediction.
Data obtained using the Acclaro Contaminant ID feature is shown here, highlighting the ability of this technology to accurately detect phenol contamination in nucleic acid samples and deliver accurate DNA concentration values to users.
Phenol contamination in nucleic acid samples
Phenol has been used to separate protein from nucleic acids since the 1950s, seeing numerous protocols and formulations developed since this time.
The most popular of these techniques was developed in the 1980s, employing a mixture of guanidinium thiocyanate, phenol and chloroform that permitted scientists to obtain highly pure, undegraded total RNA in a single step.1,2
This model has provided the foundations for various RNA extraction kits, including the TRIzol™ kit (Thermo Fisher Scientific), the TRI Reagent® kit (Molecular Research Center, Inc), the QIAzol® kit (Qiagen), the TriPure™ kit (Sigma-Aldrich), the TRISure™ kit (Bioline) and the RNAzol® kit (Molecular Research Center).
Each kit employs varying formulations of phenol, guanidium thiocyanate and chloroform in order to lyse cells and denature proteins, such as DNases and RNases. Unfortunately, however, traces of these reagents can still be found in purified nucleic acid samples, potentially impacting downstream workflows.
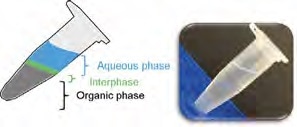
Figure 2. Phase separation typically observed when performing a conventional phenol-based nucleic acid extraction. The photograph shows how difficult it is to see the phase separation. Image Credit: Thermo Fisher Scientific – Materials & Structural Analysis
This extraction procedure (Figure 2) results in the generation of an organic phase and an aqueous phase, with the pH of the extraction solution defining which specific nucleic acid species will be extracted.
An acidic solution will lead to the extraction of RNA into the aqueous phase, while an alkaline solution will extract both DNA and RNA into the aqueous phase. Partially denatured proteins will tend to congregate in the interphase.
To ensure the proper separation of nucleic acids from the denatured protein, it is necessary to remove the aqueous phase while ensuring the interphase is not disturbed.
Avoiding contamination of purified nucleic acid with protein, phenol or guanidium requires the effective removal of the aqueous phase – a process that must leverage experience and precise technique to be successful.3,4,5
Phenol contamination can effectively denature proteins in nucleic acid samples, impacting downstream enzymatic steps. A high extinction coefficient at 270 nm can result in low contamination causing overestimated sample concentration.
The conventional approach to detecting phenol contamination requires the calculation and assessment of a purity ratio using absorbances at 260/280 or 260/230.
This method has limited effectiveness, however, because phenol exhibits an absorbance peak at 270 nm, and the purity ratios of pure phenol are very similar to the ratios of pure DNA and RNA (Table 1).
Different amounts of phenol contamination will affect 260/280 or 260/230 purity ratios and nucleic acid quantification results.
The Acclaro Contaminant ID feature offers users the ability to accurately identify phenol contamination, achieving this via the subtraction of phenol’s contribution from the original absorbance value to provide an accurate nucleic acid concentration.
Materials and methods
Several DNA and phenol stocks were prepared, including a double stranded DNA (dsDNA) stock which was prepared by diluting a salmon sperm DNA solution (Invitrogen, #15632-011) in Tris-EDTA (TE) buffer (Fisher BioReagents, pH 7.6, BP- 2474-500).
A further phenol stock was prepared by diluting a buffer-saturated phenol (Fisher BioReagents, BP-1750) in TE buffer.
Table 2. The DNA concentration of each dsDNA and phenol stock mixture and the DNA-only control (mixture 1) were determined with the NanoDrop One spectrophotometer using the dsDNA application. The corrected DNA concentration for mixtures 3 through 9 was obtained directly from the Acclaro contaminant analysis screen. The contaminant ID icon ( ) denotes mixtures that have levels of phenol contamination high enough to trigger an Acclaro result. **Mixtures 1 and 2 did not contain high enough concentrations of phenol to trigger an Acclaro result, therefore, the corrected DNA concentrations for these mixtures were determined by performing the Acclaro spectral analysis algorithm using the Thermo Scientific™ TQ Analyst™ software package. Source: Thermo Fisher Scientific – Materials & Structural Analysis
| Mixture |
1 |
2 |
3 |
4 |
5 |
6 |
7 |
8 |
9 |
Target DNA
conc ng/μL |
225.0 |
225.0 |
225.0 |
225.0 |
225.0 |
225.0 |
225.0 |
225.0 |
225.0 |
Original
(Uncorrected)
DNA conc ng/μL |
245.75 |
253.50 |
264.34 |
284.75 |
318.35 |
387.55 |
523.59 |
851.29 |
1041.50 |
Corrected DNA
conc ng/μL |
240.56** |
238.67** |
240.61 |
243.26 |
244.38 |
242.51 |
245.26 |
265.96 |
265.45 |
Corrected DNA
conc ng/μL
Std dev |
0.61 |
0.95 |
0.79 |
1.24 |
0.76 |
0.85 |
0.87 |
5.47 |
3.26 |
260/280
Purity Ratio |
1.89 |
1.85 |
1.83 |
1.79 |
1.75 |
1.70 |
1.71 |
1.53 |
|
260/230
Purity Ratio |
2.43 |
2.38 |
2.32 |
2.27 |
2.19 |
2.11 |
2.08 |
1.89 |
0.19 |
Acclaro
Flag |
No |
No |
|
|
|
|
|
|
|
Stock concentrations were determined via the NanoDrop One spectrophotometer against a TE blank. A total of nine mixtures were prepared via the addition of various amounts of DNA and phenol stocks (Table 2).
A total of five replicates for each of the nine DNA and protein mixtures were prepared in order to generate the mixtures outlined here. These were measured using the NanoDrop One spectrophotometer against a TE blank.
A fresh 1.5 µL aliquot of the corresponding mixture was utilized for each replicate, with a combination of software-calculated concentrations (corrected and original/uncorrected) and Acclaro Contaminant identity data used to generate data sets (Table 1).
Results and discussion
Table 2 highlights the Acclaro Contaminant ID data acquired for the nine aforementioned mixtures. The phenol component is expressed in parts per million (ppm).
This conversion was necessary because its molar extinction coefficient is far larger than the extinction coefficient of dsDNA - a 0.1% solution of phenol is equivalent to 1000 ppm.
It can be observed that as the level of phenol increases from 37.5 ppm to 1600 ppm, there is also an increased discrepancy between corrected and uncorrected values. This highlights how even minuscule levels of phenol contamination have the potential to inflate an A260 concentration result.
The software-corrected results presented here showcase the effectiveness of the algorithm in terms of its ability to identify phenol contamination and correct concentration values to ensure a more accurate concentration result than the A260 value alone.
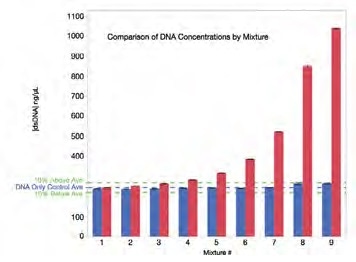
Figure 3. The DNA concentration after Acclaro correction is within 10% of the actual DNA concentration (DNA-only control) for all mixtures. Red bars represent the uncorrected DNA concentrations. The blue bars represent the corrected DNA concentrations reported by the Acclaro software (or as described in Material and Methods). The blue line is the average concentration for the phenol-free, DNA-only control (mixture 1: 245.75 ng/μL). The green dotted lines represent +/- 10% from the DNA-only control. Each data point represents the average of five measurements. Error bars represent one standard deviation from the mean. Image Credit: Thermo Fisher Scientific – Materials & Structural Analysis
Figure 3 features a comparison of uncorrected and corrected DNA concentration data in the presence of varying levels of phenol contamination – as can be seen here, the presence of phenol considerably inflates the concentration value.
The Acclaro feature is able to flag and highlight any samples where phenol contamination is higher than ~18.75 ppm, confirming the high sensitivity of the software.
It should also be noted that in all cases, corrected DNA concentrations fell within 10% of the concentration of the DNA-only control. Concentration results were also confirmed to be highly reproducible, with average standard deviations consistently under 5 ng/μL.
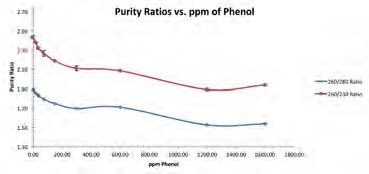
Figure 4. Average purity ratios were plotted for each dsDNA/phenol mixture. 260/230 purity ratio (red line); 260/280 purity ratio (blue line). Image Credit: Thermo Fisher Scientific – Materials & Structural Analysis
Figure 4 demonstrates that increasing the amount of phenol contamination has a minor impact on both purity ratios. For example, a DNA sample with phenol contamination of 600 ppm has a 260/280 ratio of 1.71 and a 260/230 ratio of 2.08 – both these values are within the range of typically accepted values for pure nucleic acid samples.
This level of phenol contamination results in the DNA concentration result being off by a factor of more than two-fold.
The results presented here highlight the importance of not solely relying on these ratios in order to detect contamination or assess the purity of a nucleic acid sample.
Conclusions
There is a growing trend towards the use of complex and challenging high-throughput genomic workflows which require stringent quality control checks around the nucleic acid used; for example, qPCR, next-generation sequencing, short tandem repeat (STR) analysis and digital PCR.
These sophisticated workflows require users to verify the concentration and purity of the sample, ensuring that these are sufficient to pass vital quality control checks.
UV measurements are frequently employed in the determination of nucleic acid sample concentration prior to setting up genomic workflows. UV absorbance is rapid and dependable and currently the only quantification method able to offer this purity information, including spectra, 260/280 and 260/230 absorbance ratios.
Contaminants from nucleic acid extraction kits – for example, phenol – have the potential to absorb UV light in a similar region of the UV spectrum to nucleic acids, meaning that their presence can result in artificially inflated nucleic acid concentration measurements.
The use of 260/280 and 260/230 ratios has traditionally provided an indication of the presence of contaminants in nucleic acid solutions. Purity ratios are able to indicate the presence of some contaminants, but these are unable to provide definitive identification or quantification of the contaminant.
Acclaro sample intelligence technology built into the NanoDrop One spectrophotometer offers users a robust chemometric approach to contaminant identification via UV spectrum analysis.
The Acclaro Contaminant ID feature can accurately identify and calculate phenol contamination in nucleic acid samples, providing corrected nucleic acid concentration values that are more accurate than those available using absorbance at 260 nm alone.
References
- Chomczynski, P. and Sacchi, N. Anal. Biochem. 162: 156-159. 1987.
- Chomczynski, P. and Sacchi, N. Nature Protocols Vol. 1 No.2: 581-585. 2006.
- Oswald, N. BiteSize Bio. July 9th 2016. http://bitesizebio.com/384/the-basics-how-phenol-extraction-works
- Plank, J. BiteSize Bio. May 3rd 2010. http://bitesizebio.com/3651/practical-application-of-phenolchloroform-extraction
- Jankovic, J. BiteSize Bio. Nov. 23rd 2016. http://bitesizebio.com/31609/acid-phenol-chloroform-extraction
Acknowledgments
Produced from materials originally authored by Sean Loughrey and Brian Matlock from Thermo Fisher Scientific.
About Thermo Fisher Scientific – Materials & Structural Analysis
 Thermo Fisher Materials and Structural Analysis products give you outstanding capabilities in materials science research and development. Driving innovation and productivity, their portfolio of scientific instruments enable the design, characterization and lab-to-production scale of materials used throughout industry.
Sponsored Content Policy: News-Medical.net publishes articles and related content that may be derived from sources where we have existing commercial relationships, provided such content adds value to the core editorial ethos of News-Medical.Net which is to educate and inform site visitors interested in medical research, science, medical devices and treatments.