NanoDrop™ Microvolume UV-Vis Spectrophotometers from Thermo Scientific™ are robust, useful analytical tools, ideal for measuring absorbance when working with small sample volumes.
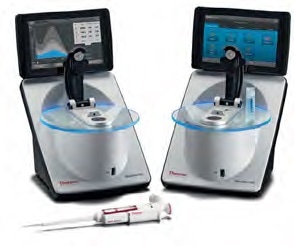
Thermo Scientific NanoDrop One/OneC Microvolume UV-Vis Spectrophotometer. Image Credit: Thermo Fisher Scientific – Materials & Structural Analysis
The instrument must be blanked prior to performing sample measurements. Employing the buffer in which the sample is suspended to perform the blank measurement enables the software to properly account for any buffer solution absorbance and, therefore, report accurate analyte absorbance.
The most suitable buffers for UV-Vis spectroscopy exhibit minimal absorbance at the analyte’s analysis wavelength.
This article outlines how blanking with a buffer that is able to absorb a considerable amount of light leads to atypical absorbance measurements, lessening the amount of light available to sample measurements.
A UV-Vis spectrophotometer’s fundamental components include the sample, a light source and a detector. Light is illuminated through the sample with the amount of light reaching the detector is measured.
In order to calculate absorbance, a comparison must be made between the amount of light transmitted through the sample and the amount of light transmitted through a reference substance (a blank).
With this in mind, it is possible to calculate the absorbance of the sample with the following equation:
Absorbance = -log Transmittance of Sample
Transmittance of Blank
The blank measurement can be understood to remove any absorbance added to the sample by the buffer within which the sample is suspended. The software is then able to extract the buffer signal from the sample signal in order to accurately report analyte absorbance.
The equation presented above can, therefore, be rewritten by expanding the logarithmic term to obtain:
Absorbance = - [log (Transmittance of Sample) - log (Transmittance of Blank)]
It is advisable to utilize the buffer in which the sample is suspended to blank the instrument, but not all buffers are appropriate for absorbance spectroscopy.
A suitable buffer for blanking the NanoDrop UV-Vis spectrophotometer should possess no more than ± 0.04 AU (absorbance units at a 10 mm pathlength) at the sample’s analytical wavelength - the absorbance wavelength employed in the calculation of analyte concentration.
The software will automatically select the optimum pathlength using the analytical wavelength.
Radioimmunoprecipitation assay buffer (RIPA) is typically employed in protein lysis preparations, but this will absorb a significant amount of light close to 280 nm. The impact of blanking with RIPA on the measurement of protein absorbance at 280 nm was observed as part of a recent study.
Results
Absorbance spectrum of RIPA buffer
It is advisable to perform a brief buffer analysis in order to determine how much light a buffer absorbs prior to performing absorbance measurements of an analyte in an untested buffer.
This can be done using the application used for analyte measurement to blank the instrument with water and then measure the buffer using the same method used to measure a sample. This buffer should ideally exhibit minimal absorbance.
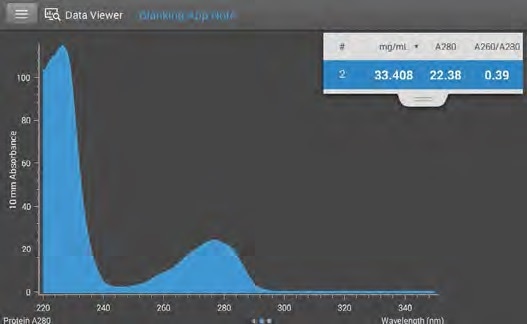
Figure 1. Buffer analysis of RIPA. RIPA absorbs approximately 22 AU at 280 nm, the analytical wavelength of proteins. Image Credit: Thermo Fisher Scientific – Materials & Structural Analysis
Figure 1 displays the absorbance spectrum of RIPA following buffer analysis. At 280 nm (which is the analytical wavelength of proteins), RIPA absorbs approximately 22 AU. To contextualize this value, phosphate buffered saline (PBS) absorbs less than 0.01 AU at 280 nm (not shown).
The NanoDrop™ One/OneC Microvolume UV-Vis Spectrophotometer’s operating software is built on a foundation of Thermo Scientific™ Acclaro™ Sample Intelligence technology.
A key feature of this new technology is its blank absorbance verification capabilities, whereby the software will not permit blanking using a buffer that has increased absorbance at the analysis wavelength.
Instead, the software will display the message “Error: Blank solution absorbance too high. Clean both pedestals and blank again.” This feature has been introduced due to the risk of blanking with a highly absorbent buffer (such as RIPA), adversely affecting the absorbance measurement.
Measuring protein suspended in PBS and RIPA
The Protein A280 application has been designed to measure the absorbance peak at 280 nm, allowing it to use the protein-specific extinction coefficient to calculate a protein concentration. The A280 peak appears due to tyrosine, tryptophan and cysteine double bonds being present in the protein.
PBS and RIPA solutions were prepared with an identical weight of BSA and an identical volume of solvent. Hypothetically, the software should determine the BSA concentration in both samples to be equivalent.
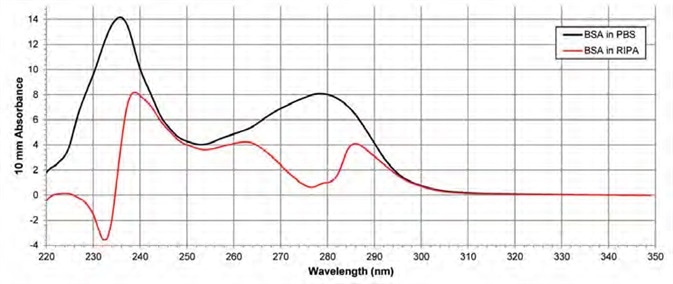
Figure 2. Absorbance spectra of BSA suspended in PBS and RIPA. The black spectrum shows a pure BSA sample in PBS after blanking with PBS. The red spectrum shows a pure BSA sample in RIPA after blanking the instrument with RIPA. Image Credit: Thermo Fisher Scientific – Materials & Structural Analysis
Figure 2 shows the resulting absorbance spectra: BSA suspended in PBS after blanking with PBS (black spectrum) and BSA suspended in RIPA after blanking with RIPA (red spectrum).
The PBS spectrum appears as anticipated, but the RIPA spectrum suffers from distortion. BSA suspended in PBS exhibits a peak at 280 nm, but BSA suspended in RIPA exhibits a trough at 280 nm. There is an approximately 88% difference in the absorbance at 280 nm between these two samples.
RIPA buffer – Limiting available light intensity
The intensity check diagnostic verifies that both the flash lamp and spectrometer are functioning in line with their specifications. An intensity check requires the user to leave the pedestals dry, allowing the detector to measure the amount of light produced by the lamp at a 1 mm pathlength.
The software confirmed that the peaks in the xenon spectrum can be found at their NIST-traceable locations.
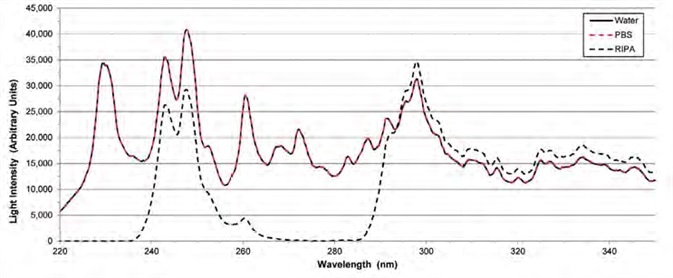
Figure 3. Flash lamp intensities with different solvents on the pedestal. The intensity of the lamp with PBS on the pedestals (red dashes) is the same as the intensity with water on the pedestals (black solid line). The signal with RIPA on the pedestals (black dashes) is attenuated near 280 nm and 220 – 235 nm. Image Credit: Thermo Fisher Scientific – Materials & Structural Analysis
Intensity checks were conducted with deionized water, PBS or RIPA on the pedestals. Figure 3 displays the resulting light intensities for these three solvents – ranging between 220 nm and 350 nm.
Deionized water exhibits high levels of transparency across the UV-Vis spectrum, while RIPA absorbs a significant amount of light, particularly in the low UV region.
Data acquired during this study highlighted overlapping water (black solid line) and PBS (red dashes) intensities, signaling that the light signal is not attenuated by PBS from 200 – 350 nm.
In contrast, the intensity of RIPA (black dashes) displays the complete attenuation of light from 220 – 235 nm and 270 – 285 nm.
Conclusions
It is advisable to blank NanoDrop UV-Vis Spectrophotometers using the same buffer within which the sample is suspended.
In order to ensure accurate analyte measurements, the blank buffer must exhibit minimal absorbance close to the analyte analytical wavelength for Protein A280 and other applications, for example, nucleic acids.
It is possible to determine buffer absorbance by performing a buffer analysis. In this study, the RIPA buffer has been seen to absorb a significant amount of light at the analytical wavelength of proteins.
Absorbing such a high amount of light limits the amount of light available for the analyte measurement, meaning that RIPA is a suboptimal buffer choice when quantifying protein concentration with a direct 280 nm measurement.
Rather than utilizing the Protein A280 application, it is recommended to use a colorimetric assay application available in the NanoDrop Spectrophotometer Software when measuring the concentration of proteins in RIPA.
Full spectrum NanoDrop UV-Vis Spectrophotometers’ operating software is hardcoded with applications able to read results of BCA, Bradford and Thermo Scientific™ Pierce™ 660 nm Protein Assays.
Acknowledgments
Produced from materials originally authored by Patrick Brown and Brian Matlock from Thermo Fisher Scientific.
About Thermo Fisher Scientific – Materials & Structural Analysis
 Thermo Fisher Materials and Structural Analysis products give you outstanding capabilities in materials science research and development. Driving innovation and productivity, their portfolio of scientific instruments enable the design, characterization and lab-to-production scale of materials used throughout industry.
Sponsored Content Policy: News-Medical.net publishes articles and related content that may be derived from sources where we have existing commercial relationships, provided such content adds value to the core editorial ethos of News-Medical.Net which is to educate and inform site visitors interested in medical research, science, medical devices and treatments.