Soft drink products act as a significant revenue stream for food and beverage manufacturers, with a global market size of USD 237 billion in 2021.1
As a result of the popularity and extensive consumption of these products, product consistency, which drives customer satisfaction, is of significant importance.
For quality control and to guarantee product consistency, it is crucial to examine six significant additives at the time of production to guarantee they fall inside specified target concentration ranges.
The six major additives (Figure 1) consist of three artificial sweeteners (saccharin, aspartame, acesulfame K), a stimulant (caffeine) and two preservatives (sorbate, benzoate).
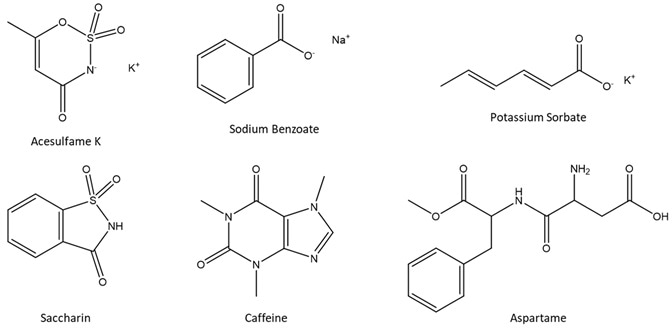
Figure 1. Chemical structures of the six beverage additives analyzed in this study. Image Credit: PerkinElmer
This article illustrates an easy, quick and strong green chemistry technique for the precise quantification of the six additives in diet soft drinks utilizing high performance liquid chromatography (HPLC) with photodiode array (PDA) detection.
The method is ideal for users bottling soft drinks who are seeking an intuitive method that can be executed by users of varying skill levels, while also decreasing dangerous solvent waste in aid of social responsibility initiatives.
Experimental
Hardware/software
Chromatographic separation was carried out with the help of a PerkinElmer LC 300 HPLC system, comprising an LC 300 HPLC Pump and an LC 300 HPLC Autosampler fitted with a combined column oven.
The configuration of the autosampler was done with a 100 µL syringe and 20 µL sample loop. Detection was performed using an LC 300 Photodiode Array (PDA) detector. The SimplicityChrom™ software platform helped execute instrument control, analysis and data processing.
Method parameters
The LC parameters are displayed in Table 1.
Table 1. LC Parameters. Source: PerkinElmer
| . |
. |
| Column |
PerkinElmer Brownlee SPP C18, 2.7 μm,
3.0 x 75 mm (Part Number N9308409) |
| Guard Column |
PerkinElmer Brownlee SPP C18, 2.7 μm,
3.0 x 5 mm (Part Number N9308514) |
| Mobile Phase |
96% 10 mM Sodium Acetate pH 4.7 (±0.05),
4% Absolute Ethanol (Isocratic) |
| Flow Rate |
1.2 mL/minute |
| Analysis Time |
6 minutes |
| Oven Temperature |
40 ºC |
| Sample Temperature |
Ambient |
| Injection Volume |
3 μL (Partial loop) |
| PDA Wavelength |
Analytical: 220 nm Bandwidth: 10 nm
Reference: 400 nm Bandwidth: 20 nm |
| Data Collection Rate |
5 pts/second (Hz) |
| PDA Flow Cell |
10 mm (standard) |
Solvents, standards and samples
All solvents and diluents used were HPLC grade. Unless otherwise specified, standard and sample dilutions were prepared using the mobile phase.
Six standards were achieved from Sigma-Aldrich®, Inc (St. Louis, MO). These included: acesulfame K, sodium benzoate, saccharin, caffeine, potassium sorbate and aspartame.
A mixed stock standard solution was made by integrating 0.0150 g of acesulfame K, 0.0100 g of saccharin, 0.0200 g of sodium benzoate, 0.0200 g of potassium sorbate, 0.0200 g of caffeine and 0.0500 g of aspartame in a 100 mL volumetric flask containing approximately 50 mL of the mobile phase.
Nearly 40 mL of mobile phase was added, and the solution was sonicated until dissolved completely. The solution was then diluted to volume with the mobile phase.
The mixed stock standard solution was diluted serially with the help of the mobile phase to make a 5-level calibration set covering the concentration ranges shown in Figure 3.
Three diet soft drink samples were acquired from a local grocery store and included two various diet colas and one diet lemon-lime soda.
For sample preparation, nearly 10 mL of the soft drink was kept in a 100 mL beaker and sonicated for 5 minutes to degas.
Furthermore, the sample was diluted in the ratio of 1:4 by transferring 300 µL to a 1.5 mL microcentrifuge tube, adding 900 µL of mobile phase diluent and vortexing. The sample was filtered with the help of a 0.22 µm nylon syringe filter (Part Number 02542881) and 3 µL was injected for analysis.
Results and discussion
The chromatogram of the Level 4 standard is displayed in Figure 2, with all six analytes eluting in under 6 minutes, thereby making the method ideal for high throughput production environments. This method offers baseline chromatographic resolution between all peaks.
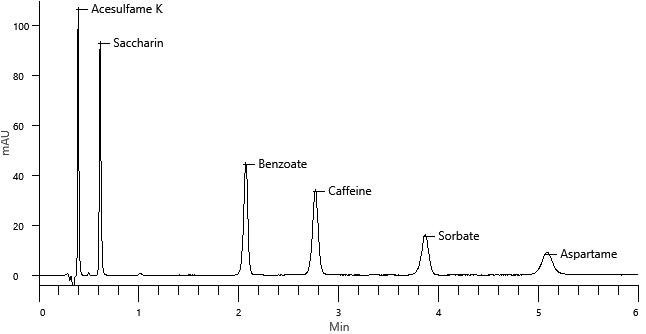
Figure 2. Chromatogram of the Level 4 standard. Image Credit: PerkinElmer
Figure 3 displays the 5-pt calibration curves for the six beverage additives. All analytes tracked a linear (1st order) fit and had r2 coefficients above 0.999 (n = 3 at each level).
.jpg)
Figure 3. Calibration ranges and results of the 5-level calibration sets for the six additives. Image Credit: PerkinElmer
Using the same chromatographic conditions, three various diet soft drinks were examined. Chromatographic results for the three samples are displayed in Figures 4, 5 and 6.
.jpg)
Figure 4. Chromatogram of diet cola A sample. Image Credit: PerkinElmer
.jpg)
Figure 5. Chromatogram of diet cola B sample. Image Credit: PerkinElmer
.jpg)
Figure 6. Chromatogram of diet lemon-lime soda sample. Image Credit: PerkinElmer
Depending on standard calibration, the quantitative results for each sample are displayed in Table 2.
While the particular amounts of ingredients are not listed on the ingredients label for the diet beverages, precise labeling of ingredients is needed. All analytes detected corresponded to the list of ingredients for each sample.
Table 2. Amount (mg/L) and %RSD for the additives found in each diet soft drink. Sample results are based on the average of three analyses. Source: PerkinElmer
| Diet Cola A |
| Analyte |
Average Amount (mg/L) |
%RSD |
| Benzoate |
180.64 |
0.25 |
| Caffeine |
119.75 |
0.59 |
| Aspartame |
481.86 |
0.45 |
| Diet Cola B |
| Analyte |
Average Amount (mg/L) |
%RSD |
| Acesulfame K |
28.92 |
0.10 |
| Benzoate |
202.82 |
0.68 |
| Caffeine |
95.61 |
0.43 |
| Aspartame |
486.69 |
0.35 |
| Diet Lemon-Lime Soda |
| Analyte |
Average Amount (mg/L) |
%RSD |
| Acesulfame K |
72.18 |
0.28 |
| Benzoate |
423.40 |
0.18 |
| Caffeine |
146.97 |
0.49 |
| Aspartame |
234.74 |
0.85 |
Even though a UV/Vis detector could be utilized instead of the PDA detector, the PDA spectral processing abilities raise the confidence in chromatographic peak identification. The two main spectral processing tools available for peak identification are peak purity index and spectral library confirmation.
The Peak purity index compares the upslope and downslope spectra of a peak at a specified % peak height.2
While a peak purity index value of 1.0 denotes that the spectra are precisely the same and thus the chromatographic peak pure, as a measure of practicality, a peak purity index value of 1.5 or less is taken to denote a pure peak.2,3
A peak purity index value of more than 1.5 denotes that two or more components with various spectra are present within the peak and hence the peak is not pure.
Spectral library confirmation makes a comparison of the apex spectrum of a chromatographic peak to an identically named spectrum comprised inside a spectral library and returns a match value.3 Library spectra achieved from pure standards run under the same chromatographic conditions.
A match value of 1000 is considered to be a perfect match, with a preferable match value being 950 or higher.
Being a part of the analysis of the soft drink samples, chromatographic peak identities were verified with the help of the peak purity index and spectral library confirmation spectral processing tools.
As displayed in Table 3, peak purity index values were less than 1.5 and spectral library confirmation match values were above 980 for all analytes.
Table 3. Example purity index and spectral library confirmation values obtained for the three samples analyzed. Source: PerkinElmer
| Diet Cola A |
| Analyte |
Purity Index
(10% Peak Height) |
Spectral Library
Confirmation |
| Benzoate |
1.04 |
998 |
| Caffeine |
1.06 |
998 |
| Aspartame |
1.09 |
984 |
| Diet Cola B |
| Analyte |
Purity Index
(10% Peak Height) |
Spectral Library
Confirmation |
| Acesulfame K |
1.36 |
990 |
| Benzoate |
1.02 |
998 |
| Caffeine |
1.09 |
998 |
| Aspartame |
1.11 |
983 |
| Diet Lemon-Lime Soda |
| Analyte |
Purity Index
(10% Peak Height) |
Spectral Library
Confirmation |
| Acesulfame K |
1.06 |
999 |
| Benzoate |
1.01 |
998 |
| Caffeine |
1.04 |
998 |
| Aspartame |
1.13 |
985 |
Conclusion
This work illustrated the rapid and strong chromatographic separation and quantitation of six additives generally found in diet beverages, as a measure of product quality, with the help of a PerkinElmer LC 300 HPLC system with PDA detection.
The calibration curves exhibit excellent linearity (r2 ≥ 0.999) throughout the complete concentration ranges for each analyte.
The explained technique was utilized to examine three different diet soft drinks, two diet colas, and one diet lemon-lime drink. Analytical results were persistent with the ingredients label for each sample.
Minimal sample preparation and a rapid 6-minute isocratic method help remove the need for column equilibration between runs. This makes this technique ideal for high throughput production surroundings.
The use of absolute ethanol as the organic modifier in the mobile phase, instead of toxic solvents such as acetonitrile or methanol, offers a much greener analytical technique that decreases the cost of solvent waste disposal.
Spectral processing tools like peak purity index and spectral library confirmation, which come with PDA detection, can provide extra confidence in chromatographic peak identification.
Even though this work concentrates on the analysis of finished soft drinks, the technique can be adapted easily to the analysis of syrups or concentrates. This can be done by the additional dilution of the syrup with a mobile phase.
This enables the method to be employed earlier in the production process at beverage bottling plants as a quality measure, guaranteeing that target specifications are addressed before the bottling phase.
Determining a batch that does not meet specifications before bottling can help save the bottling plant thousands of dollars.
References
- Grand View Research, Carbonated Soft Drink Market Size, Share & Trends Analysis Report (2021).
- Poile, A F & Conlon, R D (1981) Numerical Spectroscopy: Absorbance Index Technique and Algorithm for Qualitative Analysis in Liquid Chromatography. Journal of Chromatography A, 204, pp. 149–152.
- IRIS–HPLC Spectral Processing Software User Manual; PerkinElmer: Shelton, CT, 2006.
About PerkinElmer
As a global technology leader, PerkinElmer is taking action to harness the power of insights and transform them into knowledge to deliver innovative, differentiated solutions for our customers.
Sponsored Content Policy: News-Medical.net publishes articles and related content that may be derived from sources where we have existing commercial relationships, provided such content adds value to the core editorial ethos of News-Medical.Net which is to educate and inform site visitors interested in medical research, science, medical devices and treatments.