Raman spectroscopy has a wide range of applications as it can detect subtle changes in intricate aqueous systems, including the analysis of biopharmaceutical processes such as cell growth in bioreactors.
The Raman spectrometer can monitor biopharmaceutical production processes in real-time, in situ, and non-destructively when it is used as a continuous process analyzer of these intricate chemical systems. Raman spectroscopy has become a powerful process analytical tool due to its capacity to identify changes in a wide variety of metabolites during bioreactor processes.
Thermo Fisher™ MarqMetrix™ Bioreactor BallProbe™ with TouchRaman™ immersion technology
Reusable optical probes for Raman spectroscopy analysis provide advantages such as increased process repeatability and reliability by lowering run-to-run variability. There are many different probes that can be used with the MarqMetrix All-In-One Analyzer.
The MarqMetrix All-In-One Process Raman Analyzer can be used with the MarqMetrix Bioreactor BallProbe, which is made to meet the needs of the bioprocess industry. These probes can handle sterility procedures such as offline autoclaving, are quick and simple to swap out, and are also easy to connect.
Thermo Scientific™ HyPerforma™ DynaDrive™ Single-Use Bioreactor (S.U.B.), for perfusion cell culture applications
The most recent development in SUB technology, the DynaDrive Single-Use Bioreactor (SUB), provides enhanced performance and scalability for large-volume bioproduction. The cuboid-shaped tank has several significant advantages over earlier S.U.B. designs, including better mass transfer and mixing capabilities and increased scalability.
This application note explains how to integrate the MarqMetrix All-In-One Process Raman Analyzer system with the 500L HyPerforma DynaDrive bioreactor to carry out in-line measurements of crucial process parameters (CPPs).
This integrated system enabled the development of precise prediction models for many parameters and metabolites using continuously generated spectral data throughout a cell growth culture run.
Materials and methods
Cell culture and feeding strategy
Cell culture was carried out in a 500 L HyPerforma DynaDrive S.U.B. with a working volume of roughly 320 L of cell culture medium and 0.5*106 cells/mL inoculated at 36.5 °C, pH = 6.9+/–0.3, and 50% DO). CO2 gassing and sodium carbonate additions, as necessary, were used to regulate the pH level.
Starting on day three, a two-step feeding procedure was used every day to feed the cells as they grew in a chemically defined medium. Using the initial volume as a starting point, the first feed media was added at 4% by weight, and the second feed media at 0.4%.
On day six, the temperature changed to 33 °C. After 14 days, the run was over. To block stray light, the bioreactor was covered. For in-line, real-time spectral Raman data generation following autoclaving, the MarqMetrix All-In-One Process Raman Analyzer Bioreactor optical ball probe was inserted into the HyPerforma DynaDrive S.U.B.
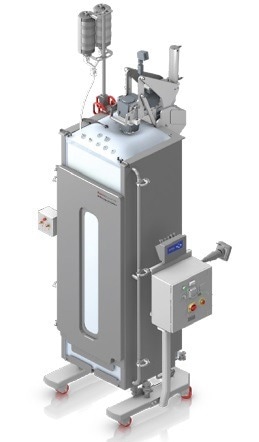
Figure 1. 500 L Thermo Scientific HyPerforma DynaDrive S.U.B. for cell culture applications. Image Credit: Thermo Fisher Scientific
MarqMetrix All-In-One Process Raman Analyzer measurements
The optical bioreactor ball probe of the MarqMetrix All-In-One Process Raman Analyzer was directly submerged in the bioreactors (500 L) D when measurements were made using the MarqMetrix All-In-One Process Raman Analyzer system. Each Raman spectrum was produced using an average of 20 measurements, a 3 second integration/exposure time, and a 450-mW laser.
The MarqMetrix All-In-One Process Raman Analyzer and offline instrument analysis used a timestamp match to determine the total acquisition time per data spectra, which was two minutes.
Chemometrics, model building
Models were built using independent data from various MarqMetrix All-In-One Process Raman Analyzer instruments, probes, and bioreactor types. Each chemometric model was developed using 45 samples per bioreactor from the training datasets. After reviewing the spectral data, cosmic ray-related outlier spectral spikes were eliminated.
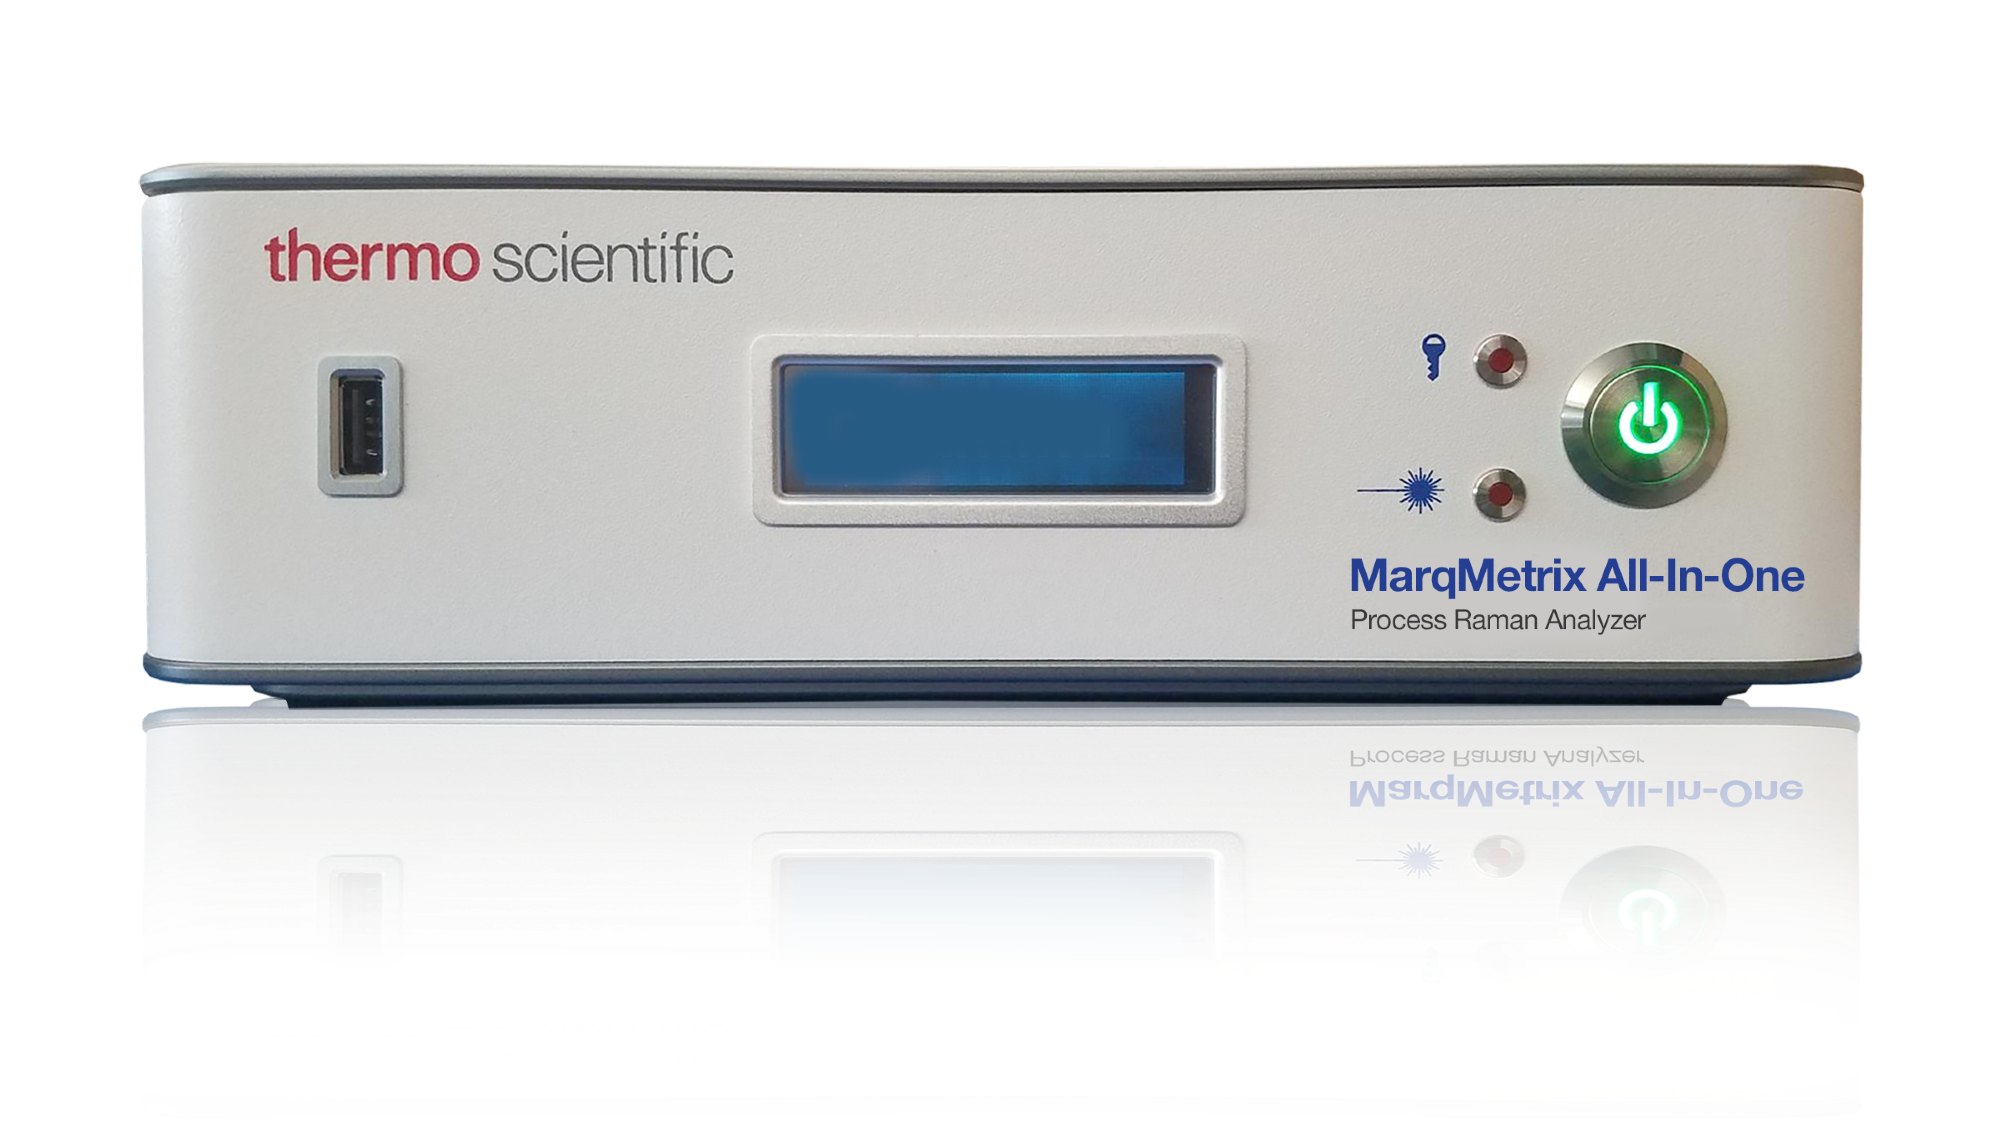
Figure 2. Thermo Fisher MarqMetrix All-In-One Process Raman Analyzer. Image Credit: Thermo Fisher Scientific
The spectra were pre-processed to remove the baseline and increase signal-to-noise after the spectral region of interest was chosen. The Savitzky Golay filter with derivatives, Automatic Whitaker Smoothing, Extended Multiplicative Scatter Correction, SNV, and mean centering were just a few of the pre-processing methods that were tested.
The most effective pre-processing methods varied depending on the particular parameter of interest that was modeled. For each property of interest, partial least squares (PLS) models were made, and cross-validation was used to assess how well each model had been optimized.
During the bioreactor culture run, common metabolites such as glucose, lactate, glutamine, glutamate, TCD, and VCD were produced.
Results
In this study, a fed-batch CHO cell culture process was subjected to continuous in-line Raman spectroscopy. The offline analytical data collected for the relevant parameters and the in-line spectral data were correlated.
Before using Raman spectroscopy to monitor process parameters, chemometric models must be built using a set of externally calibrated data (independent offline data). Bioreactor samples were taken every day and analyzed for comparison to judge the reliability of the MarqMetrix All-In-One Process Raman Analyzer predicted values.
For each parameter, the root mean square error of calibration (RMSEC), root mean square error of cross validation (RMSECV), and root mean square error of prediction (RMSEP) were calculated. To determine the RMSECV, which is used to build the model, the error was averaged based on the model’s prediction.
The model is tested using the RMSEP against “new” data that it has never seen before. Each PLS model’s R2 coefficient of variation was noted. The value is used to calculate the percentage of the Y variable’s variation that the model predictors (X variables) can account for.
It is significant to note that more precise and reliable predictive chemometric models were created when several sizable, independent data sets from bioreactor runs of the same CHO culture process were combined. Five distinct datasets from earlier bioreactor runs were combined for this study to train a sizable chemometric model.
The spectral data collected during this HyPerforma DynaDrive S.U.B bioreactor run was then subjected to the calibration model. The data show that the model was able to predict this new dataset accurately, and those model predictions were highly correlated with data measurements obtained offline for many metabolites, as shown in Table 1.
Table 1. Correlation of model prediction with offline data analysis. Source: Thermo Fisher Scientific-Handheld Elemental & Radiation Detection
| Metabolite Predicted |
R2 Predicted |
RMSEC |
RMSECV |
RMSEP |
| Glucose (g/L) |
0.98 |
0.43 |
0.49 |
0.40 |
| Lactate (g/L) |
0.92 |
0.15 |
0.18 |
0.25 |
| Glutamine (mmol/L) |
0.92 |
0.42 |
0.48 |
0.58 |
| Titer |
0.92 |
0.21 |
0.25 |
0.37 |
| Cell Viability (%) |
0.94 |
1.72 |
2.29 |
1.83 |
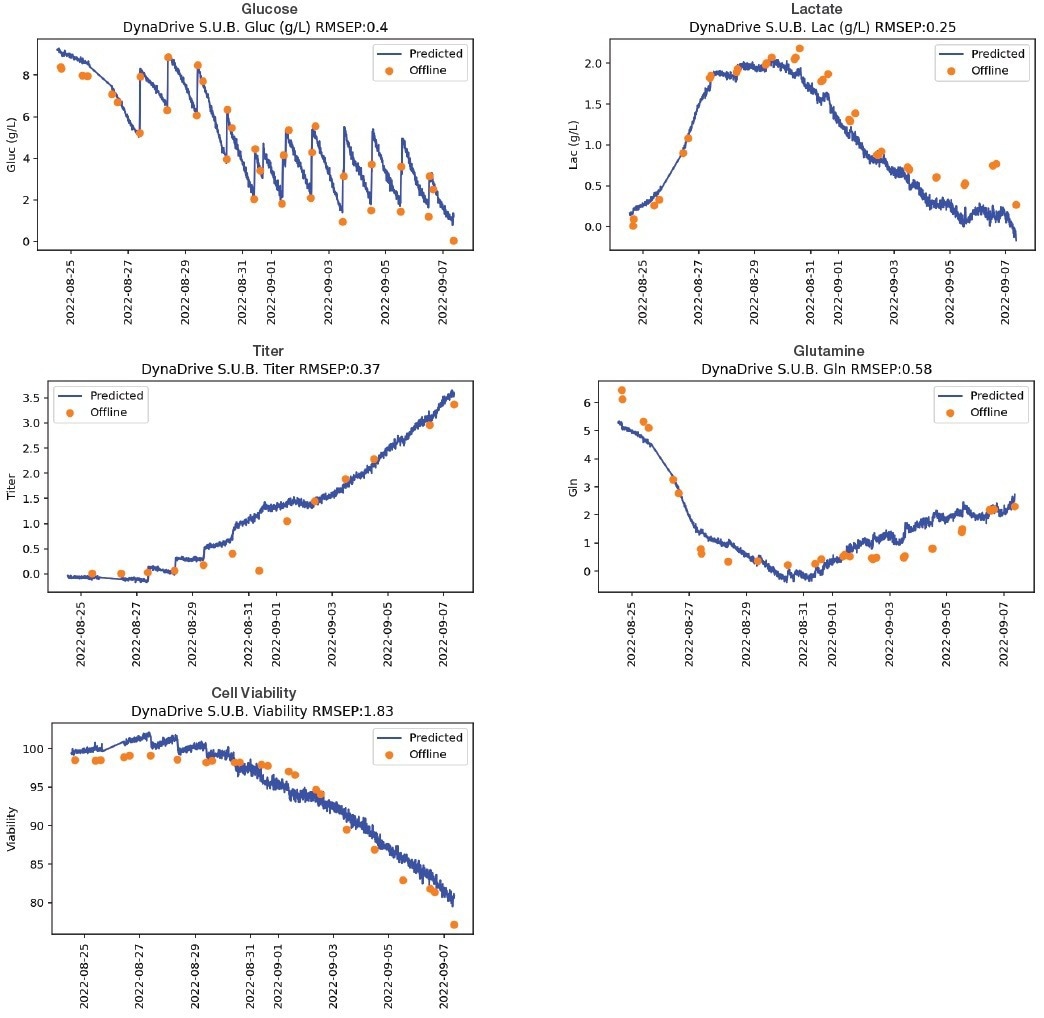
Figure 3. Thermo Scientific HyPerforma DynaDrive S.U.B. Chemometric Model Plots- Comparison of Raman Model vs Offline Analytical Data for Important Bioreactor Parameters. Image Credit: Thermo Fisher Scientific
Conclusions
Utilizing the reusable MarqMetrix Bioreactor BallProbe with TouchRaman immersion technology, the MarqMetrix All-In-One Process Raman Analyzer provides precise in-line, real-time measurements of the vital process parameters glucose, glutamine, and lactate as well as total and viable cell densities in the 500 L HyPerforma DynaDrive S.U.B.
The robustness of the model, when applied to the parameters in Table 1, is demonstrated by the correlation analysis, which demonstrates excellent agreement between the model prediction data and the offline analytical data.
About Thermo Fisher Scientific – Materials and Structural Analysis
Thermo Fisher Materials and Structural Analysis products give you outstanding capabilities in materials science research and development. Driving innovation and productivity, our portfolio of scientific instruments enable the design, characterization and lab-to-production scale of materials used throughout industry.
X-ray fluorescence spectrometers, FTIR spectrometers and X-ray photoelectron spectrometers enable researchers and material analysts to probe the chemical composition of materials ranging from ultra thin-films to bulk powders used in product development and materials troubleshooting. We offer a line of rheometry and viscometry instruments, as well as single- and twin-screw extruders, for laboratory benches that enable you to measure the physical property of semi-solids and liquids for shear flow and yield stress.
No other company offers the breadth of products and the depth of analytical capabilities for materials science and engineering.
Sponsored Content Policy: News-Medical.net publishes articles and related content that may be derived from sources where we have existing commercial relationships, provided such content adds value to the core editorial ethos of News-Medical.Net which is to educate and inform site visitors interested in medical research, science, medical devices and treatments.