Cultivated meat, also called lab-grown or cell-based meat, is part of an innovative and growing field of food technology. This process involves meat products grown from animal cells in a monitored laboratory environment, without the need for conventional animal farming. This field is gaining interest due to the potential to resolve various ethical, environmental, and sustainability challenges associated with traditional meat production.
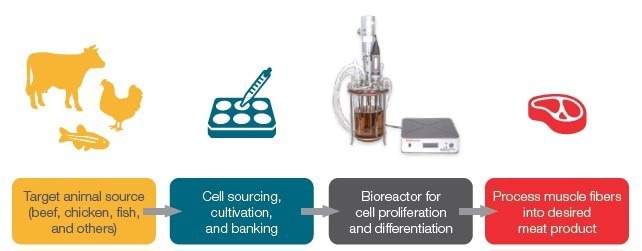
Figure 1. Schematic of process for cultivated meat production. In this study, a Raman process analyzer was used to monitor a bioreactor run. Image Credit: Thermo Fisher Scientific – Portable and Handheld Raman Spectroscopy
A common bioprocess of cultivated meat involves cell culture, cell differentiation, cell sourcing, and tissue engineering, which results in meat products (Figure 1) quite similar to traditional animal-based meat in texture, taste, and nutritional information.3 Bioreactors are crucial in the process, as they offer the controlled environment necessary for tissue development and cell growth.
Several process parameters, such as nutrients, pH, oxygen, temperature, antiapoptotic and differentiation factors, scaling up, and waste removal, must be tightly controlled within the bioreactors to achieve optimal production of high-quality cultivated meat.
Raman spectroscopy is increasingly used as a process analytical technology (PAT) to control and monitor multiple bioreactor parameters simultaneously, particularly in biopharmaceutical development. Established PAT applications for Raman include evaluating elements of the cell culture, amino acid consumption, lactate and glucose concentrations, and titer production.4
For this study, lactate and glucose are of particular interest. Appropriate monitoring of the concentration of nutrients and the measurement of secondary metabolites is critical. Glucose is the primary source of carbon and energy in most bioreactor runs.
The aldehydic functional group of glucose is reactive toward primary amines of biomolecules, resulting in undesirable product glycation. This means that the glucose level in the bioreactor is a critical process parameter requiring monitoring and maintenance at an optimum to ensure high quality and quantity of products.5
Thermo Fisher Scientific recently showed the feasibility of accurate monitoring, control, and automated glucose feeding for the complete CHO cell bioreactor run using process Raman as a real-time sensor.6 Lactate, a byproduct of anoxygenic cell metabolism, is commonly used to indicate cell health in response to oxygen availability. Excessive lactate negatively affects cell viability and product yield.
A proof-of-concept study for monitoring glucose and lactate in cultivated meat production is presented here. The study utilizes a Thermo Scientific™ MarqMetrix™ All-In-One Process Raman Analyzer. The research was conducted collaboratively with Ivy Farm Technologies using one of their bench-scale processes. The transferability of chemometric models for lactate and glucose across bioprocesses and various instruments is also demonstrated.
Experimental
Cultivated meat bioreactor runs
Bovine cells were seeded at a low density of 1x10⁵ cells/mL to culture for one week in a batch bioreactor at around 3 g/L glucose. No further glucose was contributed to the bioreactor. Sensors integrated into the bioreactor runs controlled the dissolved oxygen, temperature, pH, and agitation speed. A MarqMetrix All-In-One Process Raman Analyzer with an immersible probe was also introduced into the bioreactor to monitor progress.
Each Raman spectrum was obtained from acquisition (ACQ) parameters of power 450 mW, integration time 3000 ms, and 20 averages. All data acquisition was completed using the Thermo Scientific™ Lykos™ PAT Software with built-in cosmic ray removal. The software makes use of Open Platform Communication Unified Architecture (OPC™ UA) that enables users to:
- Connect multiple instruments within the workflow (machine-to-machine communication)
- Pass chemometric predictions in real-time to an OPC client
- Streamline results into a separate software system
- Use the results in an automated feedback loop
The samples were pooled throughout the runs, and the reference values were measured offline. The reference values and the prediction from the model were used to calculate the root mean square error of prediction (RMSEP).
Chemometric models
The chemometric partial least square (PLS) models for glucose and lactate used in this study were constructed beforehand using the Raman data obtained from various bioreactor runs, including viral vector production and mAb production. The ACQ parameters for the training data were identical to those previously mentioned.
Following data acquisition, five spectra with timestamps similar to the reference values were averaged to improve the signal-to-noise ratio before constructing the chemometric models. The training dataset was preprocessed utilizing normalization to water band, Sav-Gol First derivative filter (order=2, smoothing window=13), and mean centering.
The PLS models were constructed with the appropriate region selection for lactate and glucose. The amount of latent variables for the PLS models was chosen through a leave-out-one-run cross-validation strategy. Each run was excluded once throughout the cross-validation for these models.
The five latent variables of the PLS model were chosen for lactate and glucose, aiming to limit the root mean square error of cross-validation. No data from cultivated meat was considered in the training set. The chemometric models were applied to the Raman data obtained on the cultivated meat bioreactor following preprocessing using the same method as the training data.
Different instruments collected the training data and monitored the cultivated meat bioreactor; however, the transfer function was not applied to mitigate inter-instrument variances.
Results and discussion
Initial data assessment
Figure 2 shows the representative Raman spectra obtained from the bioreactor run of the cultivated meat. Utilizing the correct ACQ, the intensity of the peaks in the whole spectrum was maintained under 45,000 counts (intensity in the Y axis) throughout the run to escape signal saturation. All spectra were unaffected by cosmic ray interference as the Lykos PAT software included an inbuilt cosmic ray removal algorithm.
The cell density rises as the bioreactor run progresses, causing a baseline shift caused by background scattering and the fluorescence effect. For this study, water band normalization and Sav-Gol filters were applied to the spectra to remove the baseline and adjust for the path length differences before building the chemometric models or completing test sample predictions.
Figure 3 indicates the Sav-Gol Second derivative (order=2; window width=13) plot of Raman spectra from the bioreactor run for cultivated meat production, highlighting characteristic Raman peaks corresponding to lactate and glucose. All traces have been color-coded to consider the reference analyte concentration, indicated as the gradient bar in the measured range, with yellow representing high and blue representing low.
The inverted peak at 1,125 cm-1 is predominantly ascribed to the stretching of C-O and C-C and asymmetric out-of-plane vibration of the C-O-C bond in the glucose molecule.7 The peak at 855 cm-1 can be attributed to the C-C symmetric stretching of the C-COO- bond (deprotonated form) in the lactate molecule.8 These characteristic peaks show that lactate and glucose are present in the cultivated meat bioreactor.
Variable importance in projection (VIP) analysis of PLS calibration models
The calibration PLS models for lactate and glucose were constructed utilizing Raman data collected mainly on the CHO cell bioreactors for monoclonal antibody (mAb) production. Before applying the model to the cultivated meat process, variable importance in projection (VIP) analysis was completed to guarantee the model specificity for the target analytes; this offers a measure of transferability over bioprocesses.
The VIP score analysis is the statistical approach to estimate the significance of each predictor variable (or the independent variable) alongside the response variable. In the PLS model used here, the Raman shift is the independent variable, and the concentration of analytes is the response variable.9
Not all Raman shifts have equal importance; variables with a high VIP score are essential to the model. For example, the VIP plot for the glucose-specific model will exhibit high VIP scores for the Raman shift that corresponds to the vibrational modes of glucose molecules. In this regard, the VIP scores plot also indicates model specificity, which is critical for transferability across processes.
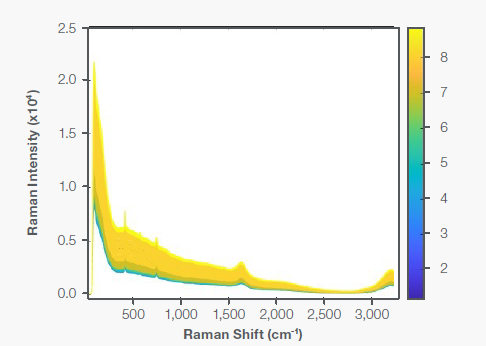
Figure 2. Raman spectra of cultivated meat bioreactor run; color-coded by days. The baseline increased with the days’ progress primarily due to cell density increase and background fluorescence. Image Credit: Thermo Fisher Scientific – Portable and Handheld Raman Spectroscopy
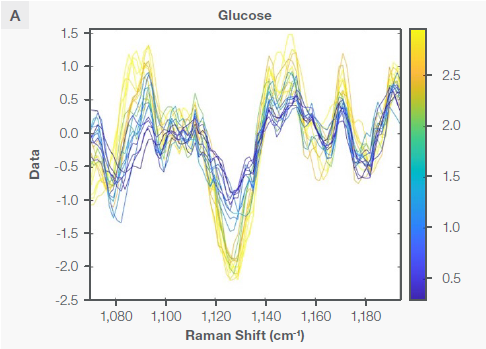
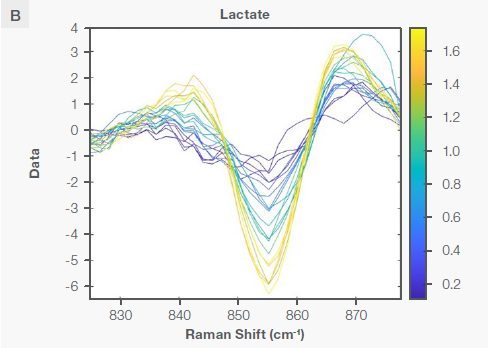
Figure 3. The Sav-Gol filter 2nd derivative plot of the Raman spectra of the bioreactor run for cultivated meat production, highlighting the characteristic Raman peaks for (A) glucose and (B) lactate as explained in the text. Image Credit: Thermo Fisher Scientific – Portable and Handheld Raman Spectroscopy
Figure 4 shows the VIP score plot for the study’s lactate and glucose PLS models. Despite the complexity of the Raman spectra in the bioreactor due to the presence of multiple substances, the PLS models show that the spectral regions of 1100–150 cm-1 for glucose and 830–870 cm-1 for lactate have high VIP scores, indicating that these areas are “important” for the models. These regions have Raman features specific to lactate and glucose.
Even with the complicated workings of bioreactors with several overlapping Raman signals, the PLS models offer excellent specificity to the analytes of interest, allowing them to be independent of other variables in the processes. Therefore, the models can potentially be transferable to an independent future dataset.
Predictive performance of PLS models
Figure 4 indicates the performance of the PLS lactate and glucose on the bioreactor run for the cultivated meat. Table 1 summarizes the key performance statistics.
Figure 5 displays the correlation plot of reference value vs. predicted value. The RMSEPs are 0.24 g/L for the glucose model and 0.21 g/L for the lactate model, respectively, demonstrating exceptional correlation between the reference and predicted values.
The prediction R2 is 96 % for glucose and 87 % for lactate, indicating that the models can account for 96 % of any variances seen for glucose and 87 % for lactate. The low RMSEP and high prediction R2 show excellent model transferability over different instruments and processes.
Source: Thermo Fisher Scientific – Portable and Handheld Raman Spectroscopy
| |
Glucose |
Lactate |
| RMSEC |
0.337 g/L |
0.181 g/L |
| RMSECV |
0.413 g/L |
0.250 g/L |
| RMSEP |
0.239 g/L |
0.212 g/L |
| R2 (Pred.) |
96.1 % |
87.4 % |

Figure 4. The variable importance plot (VIP) analysis for the (A) glucose and (B) lactate PLS models. A Raman shift with values greater than 1 (above the dotted line) is considered significant for the model. Image Credit: Thermo Fisher Scientific – Portable and Handheld Raman Spectroscopy
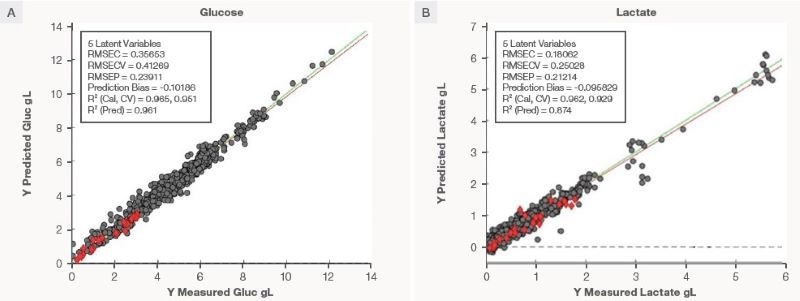
Figure 5. The correlation plot of prediction value vs. measured value for (A) glucose and (B) lactate in the bioreactor run for cultivated meat. The grey circles are training samples, and the red diamonds are the test samples. Image Credit: Thermo Fisher Scientific – Portable and Handheld Raman Spectroscopy
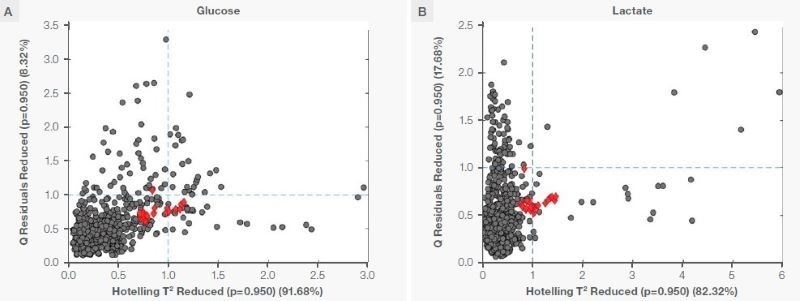
Figure 6. Q residual (reduced) vs. Hotelling T2 (reduced) plot for (A) glucose and (B) lactate. The grey circles are training samples, and the red diamonds are the test samples. Image Credit: Thermo Fisher Scientific – Portable and Handheld Raman Spectroscopy
The PLS model prediction was evaluated for validity by analyzing the Q-residual-versus-Hotelling T2 plots, as seen in Figure 6. Q-residuals account for the residual in the test data following projection into the model space, while Hotelling’s T2 measures the data distance from the middle of the distribution of calibration data.
Low Q-residuals and Hotelling’s T2 scores indicate that the test data is within the model space. These guidelines must be met before a model is applied to the test data or the predicted result is accepted with high confidence.
For this study, the test samples (from the cultivated meat bioreactor) have Q-residual (reduced) and Hotelling T2 (reduced) scores of ~1 when projected into the model space. These test samples are within the model space with 95 % confidence, even considering the training and test samples are two unique datasets.
The models can only be effective when they are analyte-specific and devoid of other process dependence. This offers the validity of prediction from models and corroborates their successful transferability.
Conclusions
Raman spectroscopy can provide real-time and simultaneous monitoring of lactate and glucose in cultivated meat bioreactors.
The chemometric models created for mAb productions were successfully transferred to the cultivated meat bioreactor. The transferability was largely due to the model's specificity for the analyte of interest, as highlighted by the statistical analysis.
The model transferability over instruments also reflected low inter-instrument variance. An intricate study on inter-instrument model transferability is reported in previous works.10
The synergic operation of Lykos PAT software with transferable models, alongside the reliable and calibration-free MarqMetrix All-In-One Process Raman Analyzer, was demonstrated as an efficient PAT solution for bioprocess development and monitoring.
References
- Broucke, K.; Van Pamel, E.; Van Coillie, E.; Herman, L.; Van Royen, G. Cultured Meat and Challenges Ahead: A Review on Nutritional, Technofunctional and Sensorial Properties, Safety and Legislation. Meat Sci. 2023, 195, 109006.
- Gaydhane, M. K.; Mahanta, U.; Sharma, C. S.; Khandelwal, M.; Ramakrishna, S. Cultured Meat: State of the Art and Future. Biomanufacturing Rev. 2018, 3 (1), 1.
- Hong, T. K.; Shin, D.-M.; Choi, J.; Do, J. T.; Han, S. G. Current Issues and Technical Advances in Cultured Meat Production: A Review. Food Sci. Anim. Resour. 2021, 41 (3), 355–372.
- Abu-Absi, N. R.; Kenty, B. M.; Cuellar, M. E.; Borys, M. C.; Sakhamuri, S.; Strachan, D. J.; Hausladen, M. C.; Li, Z. J. Real-Time Monitoring of Multiple Parameters in Mammalian Cell Culture Bioreactors Using an In-Line Raman Spectroscopy Probe. Biotechnol. Bioeng. 2011, 108 (5), 1215–1221.
- Gibbons, L.; Maslanka, F.; Le, N.; Magill, A.; Singh, P.; Mclaughlin, J.; Madden, F.; Hayes, R.; McCarthy, B.; Rode, C.; O’Mahony, J.; Rea, R.; O’Mahony-Hartnett, C. An Assessment of the Impact of Raman Based Glucose Feedback Control on CHO Cell Bioreactor Process Development. Biotechnol. Prog. 2023, 39 (5), e3371.
- Villa, J.; Zustiak, M.; Kuntz, D.; Zhang, L.; Khadka, N.; Broadbelt, K.; Woods, S. Use of Lykos and TruBio Software Programs for Automated Feedback Control to Monitor and Maintain Glucose Concentrations in Real Time.
- Bell, A. F.; Barron, L. D.; Hecht, L. Vibrational Raman Optical Activity Study of D-Glucose. Carbohydr. Res. 1994, 257 (1), 11–24.
- Vibrational spectra of lactic acid and lactates - Cassanas - 1991 - Journal of Raman Spectroscopy - Wiley Online Library. https://analyticalsciencejournals.onlinelibrary.wiley.com/doi/10.1002/jrs.1250220709 (accessed 2024-04-30).
- Chong, I.-G.; Jun, C.-H. Performance of Some Variable Selection Methods When Multicollinearity Is Present. Chemom. Intell. Lab. Syst. 2005, 78 (1), 103–112.
- Bates, M.; Khadka, N.; Kuntz, D.; Zhang, L.; Woods, S. Thermo Scientific Ramina Process Analyzer – Chemometric Model Transferability across Instruments.
About Thermo Fisher Scientific – Portable and Handheld Raman Spectroscopy
Thermo Fisher Scientific offers innovative solutions that help our customers solve complex analytical challenges, accelerate life sciences manufacturing, deliver medicines to market, and increase laboratory productivity. Our Thermo Scientific portable and handheld process Raman analyzers enable accurate, real-time results for process monitoring.
Our Thermo Scientific™ MarqMetrix™ All-In-One Process Raman Analyzer is an all-in-one system purpose-built for rapid deployment, ease of use, and scalability in markets where time-to-results is critical. The Ramina Process Analyzer is designed for:
- Analysis without sample preparation, delivering Raman spectral results in real-time
- Easy setup and deployment by non–Raman spectroscopists
- Non-destructive workflows to protect precious samples
- Non-invasive handling to minimize contamination of samples
- Small footprint for convenient deployment
- Factory calibration for hardware stability and portability
Our Thermo Scientific TruScan G3 Handheld Raman Analyzer includes state-of-the-art optics paired with a patented multivariate residual analysis that offers an effective chemometric solution for material identification, with two spectral pre-processing options. The analyzer’s non-destructive point-and-shoot sampling principle facilitates rapid verification of a broad range of chemical compounds, including cellulose-based products.
The Thermo Scientific TruScan G3 Handheld Raman Analyzer takes pharmaceutical manufacturing QA/QC to the next level with:
- Enhanced 21 CFR Part 11 and cGMP compliance with biometric login, complex password options, and full audit trail features
- Non-contact analysis through plastic bags, glass containers, blister packs and clear gel caps
- Intuitive workflow adapted to production environment through PDF batch reports and ease of data input using barcode scanners
- Easy fleet management feature that enables cloning of instruments and identification methods
Sponsored Content Policy: News-Medical.net publishes articles and related content that may be derived from sources where we have existing commercial relationships, provided such content adds value to the core editorial ethos of News-Medical.Net which is to educate and inform site visitors interested in medical research, science, medical devices and treatments.