Bioreactors have become irreplaceable tools in bioprocessing, revolutionizing the production of many biotechnological products.1,2 They offer optimized and controlled environments to enhance cell cultivation and are commonly used in various industries, including biopharmaceuticals and food production.
Bioreactors produce consistent, high-quality products, so the emphasis remains on the appropriate control of critical process parameters (CPPs), such as temperature, pH, dissolved oxygen, cell density/viability, nutrient availability, and many others.
Identifying the significance of real-time monitoring and control of CPPs, the U.S. Food and Drug Administration (FDA) has emphasized integrating process analytical technology (PAT) into pharmaceutical manufacturing using the principles of quality by design.3
The PAT framework encourages using advanced analytical technologies in a collaborative synergy with physical, chemical, microbial, mathematical, and risk analyses to allow comprehension and control of CPPs. The FDA guidance outlines the following objectives of PAT:
- Control process variability and guarantee product consistency and quality
- Reduce production cycle time
- Prevent rejection, scrap, and reprocessing
- Introduce the potential for real-time release
- Raise automation for better safety and decrease human error
- Facilitate continuous processing for improved efficiency, managed variability, and improved capacity
Process Raman spectroscopy is a PAT solution rapidly gaining traction across various industries.4 It has numerous competitive advantages compared to other technologies for bioprocess monitoring.
Process Raman spectroscopy provides advantages like high molecular specificity, low water background interference, clear spectral interpretation caused by fewer overtones and combination bands, non-destructive analysis, rapid measurements, the capability of probing biomolecules in their native state, and easy integration with automation.5
These characteristics make process Raman spectroscopy an impressive PAT tool for monitoring cell cultures in a bioreactor. By integrating a process Raman analyzer into bioreactors, operators benefit from quick, accurate, and actionable insights on CPPs, leading to timely adjustments and optimization of bioprocess parameters. Monitoring in real-time allows for efficient process control, reduces batch-to-batch variations, and guarantees universal product quality during manufactured batches.6
The success of process Raman analysis in monitoring and controlling bioreactors relies on the performance of chemometric models.7 These models interpret the spectral data and present it as meaningful and actionable information. The chemometric models are created through a multi-stage and iterative process (shown in Figure 1) that demands a great deal of time, resources, cost, and technical knowledge.
The composition of chemicals inside bioreactors is highly complex because there are multiple elements, each with its own Raman signature. The resulting mixture has overlapping spectral features.
Bioreactor systems are also dynamic, with continuous alterations in element concentrations and interactions (e.g., an array of feeding materials and schedules), which adds even more complexity to the Raman spectra. A large amount of training data with the associated off-line reference values is needed for building robust, accurate, and reliable chemometric models.
These models will undergo numerous rounds of validation and optimization before being confidently employed for process monitoring. Following deployment, model performance must be monitored.
With any change in processes, the models could need updates or re-optimization with additional data, as seen in Figure 1. The widespread adoption of process Raman technology is often hindered by the difficulty of creating accurate and dependable chemometric models.
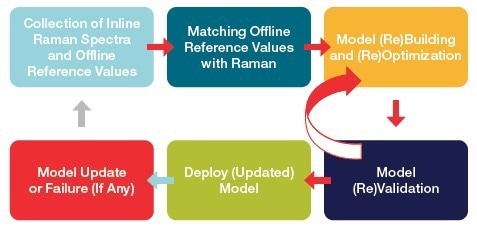
Figure 1. A general workflow of chemometric model building and implementation. Image Credit: Thermo Fisher Scientific – Portable and Handheld Raman Spectroscopy
To address this issue, Thermo Fisher Scientific has gathered the Raman data from various bioreactor runs and developed the chemometric “core” models for real-time monitoring of lactate and glucose. These core models have been tested on many cell lines, scales, media, and diverse processes and instruments.
As previously shown, the core model demonstrated exceptional transferability. This article offers detailed information on these core models to assist the simple integration of process Raman for bioreactor monitoring.
Experimental details
1. Data collection
Raman data was collected in the “in-line” mode with a Thermo Scientific™ MarqMetrix™ All-In-One Process Raman Analyzer integrated with an immersible probe (Figure 2). The signal acquisition parameters were initially optimized and set to a power level of 450 mW, exposure time of 3000 ms, and 20 averages for all runs. The data was continuously obtained over two weeks, with one Raman spectrum recorded every two minutes.
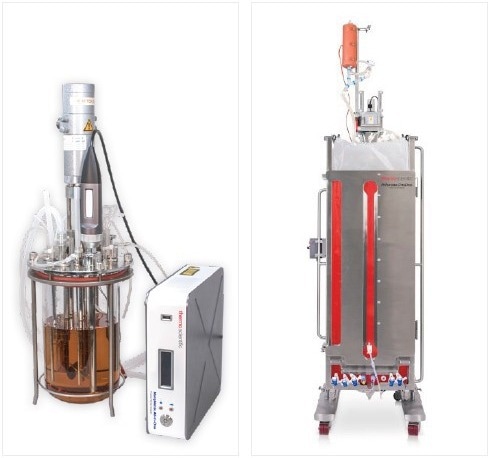
Figure 2. MarqMetrix All-In-One Process Raman Analyzer with immersible probe. Image Credit: Thermo Fisher Scientific – Portable and Handheld Raman Spectroscopy
Training data was collected in multiple bioreactors through different cell lines and assorted initial and feed media, as indicated in Table 1. Various operation modes were used, including fed-batch, hybrid perfusion, and perfusion, with a range of feeding strategies such as continuous, bolus, or both.
In addition, the data was obtained from bioreactors of various scales, including 3 L and 5 L glass bioreactors and a 500 L Thermo Scientific™ DynaDrive™ Single-Use Bioreactor (S.U.B.) Lastly, six unique instruments were used to collect the data. All training dataset variations were introduced to acquire changes in process, scales, and instruments.
Table 1. Source: Thermo Fisher Scientific – Portable and Handheld Raman Spectroscopy
| Run # |
Cell
Line |
Initial
Media |
Feed
Media 1 |
Feed
Media 2 |
Feed
Media
Type |
Glucose
Feeding
Type |
Run
Mode |
Reactor
Type |
| 1 |
ExpiCHO 1C6 |
ExpiCHO SPM + 6 mM L-Glutamine + 2 g/L pluronic |
EFC 2X 3 %
Weight/Day |
None |
Bolus |
Bolus |
Fed Batch |
5L Glass |
| 2 |
ExpiCHO 1C6 |
ExpiCHO SPM + 6 mM L-Glutamine + 2 g/L pluronic |
EFC 2X 3 %
Weight/Day |
None |
Bolus |
Bolus |
Fed Batch |
5L Glass |
| 3 |
CHO-M |
Balance CD CHO growth A + 6 mM L-glutamine + 1 g/L pluronic |
Cell Boost 7a |
Cell Boost 7b |
Bolus |
Bolus |
Fed Batch |
500L Dyna Drive |
| 4 |
ExpiCHO 1C6 |
ExpiCHO SPM + 6 mM L-Glutamine + 2 g/L pluronic |
EFC 2X 3 %
Weight/Day |
None |
Bolus |
Bolus |
Fed Batch |
5L Glass |
| 5 |
ExpiCHO 1C6 |
ExpiCHO SPM + 6 mM L-Glutamine + 2 g/L pluronic |
ExpiCHO SPM + 6 mM L-Glutamine + 2 g/L pluronic |
None |
Continuous |
Bolus |
Hybrid Perfusion |
500L Dyna Drive |
| 6 |
ExpiCHO 1C6 |
ExpiCHO SPM + 6 mM L-Glutamine + 2 g/L pluronic |
EFC 2X 3 %
Weight/Day |
None |
Bolus |
Bolus |
Fed Batch |
500L Dyna Drive |
| 7 |
ExpiCHO 1C6 |
ExpiCHO SPM + 6 mM L-Glutamine + 2 g/L pluronic |
EFC 2X 3 %
Weight/Day |
None |
Bolus |
Bolus |
Fed Batch |
5L Glass |
| 8 |
ExpiCHO 1C6 |
ExpiCHO SPM + 6 mM L-Glutamine + 2 g/L pluronic |
Continuous, EFC 2X 3 %
Weight/Day |
None |
Continuous |
Continuous/
Bolus |
Fed Batch |
5L Glass |
| t9 |
ExpiCHO 1C6 |
ExpiCHO SPM + 6 mM L-Glutamine + 2 g/L pluronic |
EFC 2X 3 %
Weight/Day |
None |
Bolus |
Bolus |
Fed Batch |
500L Dyna Drive |
| 10 |
ExpiCHO 1C6 |
ExpiCHO SPM + 6 mM L-Glutamine + 2 g/L pluronic |
ExpiCHO SPM + 6 mML-Glutamine + 2 g/L pluronic |
None |
Bolus |
Bolus |
Perfusion |
500L Dyna Drive |
| 11 |
ExpiCHO 1C6 |
ExpiCHO SPM + 6 mM L-Glutamine + 2 g/L pluronic |
Continuous, EFC 2X 3 %
Weight/Day |
None |
Continuous |
Continuous/
Bolus |
Fed Batch |
5L Glass |
| 12 |
ExpiCHO 1C6 |
ExpiCHO SPM + 6 mM L-Glutamine + 2 g/L pluronic |
Continuous, EFC 2X, VCV Model |
None |
Continuous |
Continuous |
Fed Batch |
500L Dyna Drive |
| 13 |
ExpiCHO 1C6 |
ExpiCHO SPM + 6 mM L-Glutamine + 2 g/L pluronic |
Continuous, EFC 2X, VCV Model |
None |
Continuous |
Continuous/
Bolus |
Intensified Fed Batch |
5L Glass |
| 14 |
ExpiCHO 1C6 |
ExpiCHO SPM + 6 mM L-Glutamine + 2 g/L pluronic |
Continuous, EFC 2X Glucose free, 3 %
Weight/Day |
None |
Continuous |
Continuous/
Continuous |
Fed Batch |
5L Glass |
| 15 |
ExpiCHO 1C6 |
ExpiCHO SPM + 6 mM L-Glutamine + 2 g/L pluronic |
ExpiCHO SPM + 6 mML-Glutamine + 2 g/L pluronic |
None |
Continuous |
Continuous |
Perfusion |
5L Glass |
| 16 |
CHO K1 |
ExpiCHO SPM + 6 mM L-Glutamine + 2 g/L pluronic |
EFC 2X 51 ml |
None |
Bolus |
Bolus |
Fed Batch |
3L TruBio6 |
| 17 |
ExpiCHO 1C6 |
ExpiCHO SPM + 6 mM L-Glutamine + 2 g/L pluronic |
ExpiCHO SPM + 6 mML-Glutamine + 2 g/L pluronic |
None |
Continuous |
Continuous |
Perfusion |
5L Glass |
| 18 |
NistCHO |
EX-CELL® Advanced™ CHO Fed Batch medium |
NISTCHO is EX-CELL® Advanced™ Feed |
None |
Bolus |
Bolus |
Fed Batch |
3L TruBio6 |
| 19 |
HEK293 |
Expi293 expression media |
Expi293 expression media |
None |
Continuous |
Continuous |
Perfusion |
5L Glass |
| 20 |
ExpiCHO 1C6 |
HipCHO media |
HipCHO media |
None |
Continuous |
Continuous |
Perfusion |
5L Glass |
| 21 |
ExpiCHO 1C6 |
ExpiCHO SPM + 6 mM L-Glutamine + 2 g/L pluronic |
EFC 2X 3 %
Weight/Day |
None |
Continuous |
Continuous |
Fed Batch |
500L Dyna Drive |
| 22 |
ExpiCHO 1C6 |
ExpiCHO SPM + 6 mM L-Glutamine + 2 g/L pluronic |
ExpiCHO SPM + 6 mML-Glutamine + 2 g/L pluronic |
None |
Continuous |
Continuous |
Perfusion |
5L Glass |
| 23 |
ExpiCHO 1C6 |
ExpiCHO SPM + 6 mM L-Glutamine + 2 g/L pluronic |
EFC 2X 3 %
Weight/Day |
None |
Continuous |
Continuous |
Fed Batch |
3L TruBio6 |
| 24 |
ExpiCHO 1C6 |
ExpiCHO SPM + 6 mM L-Glutamine + 2 g/L pluronic |
EFC 2X 3 %
Weight/Day |
None |
Bolus/
Continuous |
Bolus/
Continuous |
Fed Batch |
5L Glass |
| 25 |
ExpiCHO 1C6 |
ExpiCHO SPM + 6 mM L-Glutamine + 2 g/L pluronic |
ExpiCHO SPM + 6 mML-Glutamine + 2 g/L pluronic |
None |
Continuous |
Continuous |
Perfusion |
3L TruBio6 |
| 26 |
ExpiCHO 1C6 |
ExpiCHO SPM + 6 mM L-Glutamine + 2 g/L pluronic |
EFC 2X, Capacitance VCV model |
None |
Continuous |
Continuous |
Fed Batch |
500L Dyna Drive |
| 27 |
ExpiCHO 1C6 |
HipCHO media |
HipCHO media |
None |
Continuous |
Continuous |
Perfusion |
3L TruBio6 |
| 28 |
ExpiCHO 1C6 |
ExpiCHO SPM + 6 mM L-Glutamine + 2 g/L pluronic |
EFC 2X 3 %
Weight/Day |
None |
Continuous |
Continuous |
Fed Batch |
3L TruBio6 |
| 29 |
CHO-K1 |
HyCell CHO Medium |
CellBoost 7A |
Cell Boost 7b |
Bolus |
Bolus |
Fed Batch |
5L Glass |
| 30 |
ExpiCHO 1C6 |
HipCHO media |
HipCHO media |
None |
Continuous |
Continuous |
Perfusion |
500L Dyna Drive |
| 31 |
ExpiCHO 1C6 |
ExpiCHO SPM + 6 mM L-Glutamine + 2 g/L pluronic |
EFC 2X spiked Met and Phe, Capacitance VCV model |
None |
Continuous |
Continuous |
Fed Batch |
500L Dyna Drive |
| 32 |
ExpiCHO 1C6 |
HipCHO media |
HipCHO media |
None |
Continuous |
Continuous |
Perfusion |
5L Glass |
| 33 |
ExpiCHO 1C6 |
HipCHO media |
HipCHO media |
None |
Continuous |
Continuous |
Perfusion |
5L Glass |
| 34 |
CHO-K1 |
Efficient PRO |
Efficient PRO Feed 2 |
None |
Continuous |
Continuous |
Fed Batch |
500L Dyna Drive |
| 35 |
ExpiCHO 1C6 |
Efficient PRO |
Efficient PRO |
None |
Continuous |
Continuous |
Perfusion |
5L Glass |
Throughout the bioreactor run, the samples were aseptically pooled and sent for off-line or at-line reference value analysis. The pooled sample timestamp was recorded for data analysis.
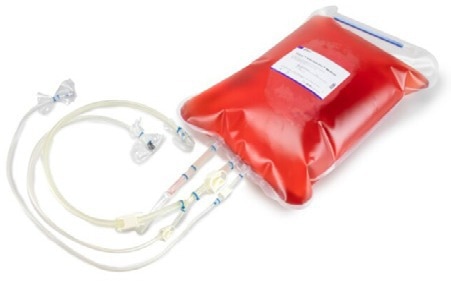
Gibco™ High-Intensity Perfusion CHO Medium. Image Credit: Thermo Fisher Scientific – Portable and Handheld Raman Spectroscopy
Gibco™ Efficient-Pro™ Feed 2. Image Credit: Thermo Fisher Scientific – Portable and Handheld Raman Spectroscopy
Gibco™ Efficient-Pro™ Medium. Image Credit: Thermo Fisher Scientific – Portable and Handheld Raman Spectroscopy
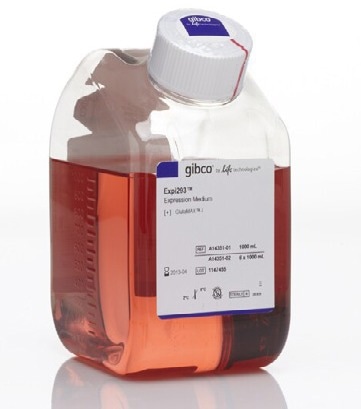
Gibco™ Expi293™ Expression Medium. Image Credit: Thermo Fisher Scientific – Portable and Handheld Raman Spectroscopy
Table 2. Source: Thermo Fisher Scientific – Portable and Handheld Raman Spectroscopy
| Analyte |
Model
Type |
No. of Latent
Variables |
Region
Selection cm-1 |
Preprocessing |
| Glucose |
PLS |
5 |
1065-1232;
1595-1863;
704-3078 |
Sav-Gol filter
(1st Derivative; order = 2;
Window width = 13)
+ SNV + Mean Center |
| Lactate |
PLS |
5 |
800 - 1750 |
Sav-Gol filter
(1st Derivative; order = 2;
Window width = 11)
+ L-1 Norm (Area = 1 for
1540-1750 cm-1)
+ Mean Center |
2. Data management
The Python platform was used for the initial data management. Over 9000 Raman spectra were obtained in .spc file format for each bioreactor run. The timestamp of each spectrum was found in the metadata and lined up with the reference values timestamp for the target analytes.
For a better signal-to-noise ratio (SNR), five Raman data with timestamps based on the time of each reference were chosen and averaged. Each averaged Raman spectrum had a total exposure time of five minutes.
The averaged Raman spectra were utilized for chemometric modeling, which was created with Python and Eigenvector SOLO software. These steps were repeated for all target analytes.
3. Chemometric calibration model development
Before constructing the chemometric models, the spectra quality was visually assessed. The bioreactor Raman data contains both Raman scattering, fluorescence background signal, and baseline shift caused by Mie scattering. Occasionally, the detector became saturated or reached saturation because of the high background signal, which meant adding non-linear noise to the Raman spectra.
To avoid including low SNR Raman spectra in the training data, the Raman spectra were plotted and then visually inspected. Any spectra exhibiting an intensity over 50,000 counts in the 800 to 3250 cm-1 spectral range were not included in the training set.
The data was subsequently preprocessed by removing the baseline with the Savitzky-Golay (Sav-Gol) filter and then normalized either by standard normal variate (SNV) or using peak or area intensity of the water band, as seen in Table 2. The data was mean-centered before developing the partial least square (PLS) regression models.
The PLS regression models were created with only the chosen regions as indicated in Table 2. A leave-one-out (leave-a-run-out) cross-validation (LOOCV) strategy was employed to internally validate the models. Initially, each model was constructed with a unique number of latent variables (LVs) from 1 to 20.
The root mean square error of calibration (RMSEC) and cross-validation (RMSECV) were derived for each model with different numbers of latent variables. The PLS model with the ideal number of latent variables was chosen so that adding more latent variables did not significantly improve the RMSECV and the ratio of RMSEC and RMSECV was near 1.
Chemometric models development
Glucose “Core” model
The PLS regression model for glucose was created utilizing the area of the Raman spectra that corresponds to certain vibrational modes of the glucose, as seen in Figure 3. The Raman spectra of glucose in water and in the bioreactor following the application of the Sav-Gol filter (second derivative, order=2, window width=13) are seen in Figures 3A and 3B, respectively.
The negative peak at ~1125 cm-1 is attributed to the stretching vibrational mode of CO and CC and in-plane bending of COH bonds (ν [CO], ν [CC], β [COH]) of a glucose molecule. Table 2 and Figure 4A state that the glucose model was created utilizing three spectral regions: 1065–1232 cm-1, 1595–1863 cm-1, and 2704–3078 cm-1.
The 1065–1232 cm-1 spectral region contains the characteristic Raman glucose peak. The spectral region of 1595–1863 cm-1 contains the Raman water peak. The concentration of water stays the same during the bioreactor run. The 1595–1863 cm-1 spectral region becomes the reference for spectral normalization.
Throughout preprocessing, the mathematical operation of SNV mostly uses the dominant intensity from the spectral region of 1595–1863 cm-1 to normalize each spectrum by adjusting the differences in path length.
Similarly, the spectral region of 2704–3078 cm-1 contains a Raman peak attributed to the antisymmetric and symmetric stretching vibration modes of CH2 and CH bonds of glucose. Including these regions in the model ensured its accuracy and selectivity for predicting glucose concentration.
The glucose PLS model was created with five latent variables in the 0 to 12 g/L concentration range, as seen in Figure 4B. The RMSECV was unchanged following five latent variables, as seen in Figure 4C. Due to this, a five-latent-variable PLS model was chosen. The loadings for these latent variables that possess glucose information are seen in Figure 4D. Table 3 shows the overall model statistics.
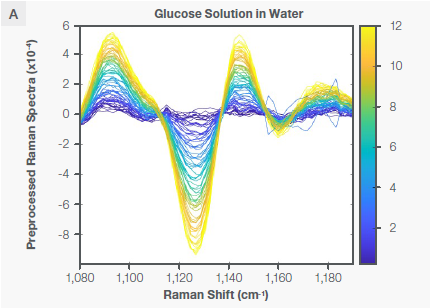
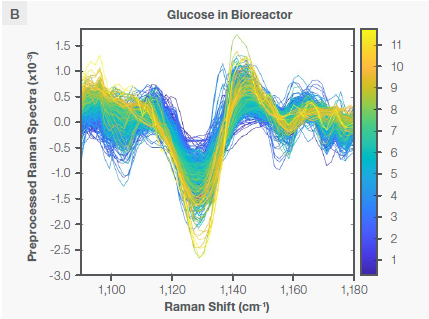
Figure 3. Characteristic Raman peaks of glucose at ~1125 cm-1 in aqueous solution (plot A) and bioreactor (plot B) as second derivative (negative peaks) spectra. The spectra are color coded by the concentration shown as the vertical bar. Image Credit: Thermo Fisher Scientific – Portable and Handheld Raman Spectroscopy
Table 3. Source: Thermo Fisher Scientific – Portable and Handheld Raman Spectroscopy
| Glucose Core Model Parameters |
Statistics |
| Model Range |
0-12 g/L |
| Number of Latent Variables |
5 |
| RMSEC |
0.43 g/L |
| RMSECV |
0.49 g/L |
| R² CV |
0.94 |
| CV Bias |
-0.013 g/L |
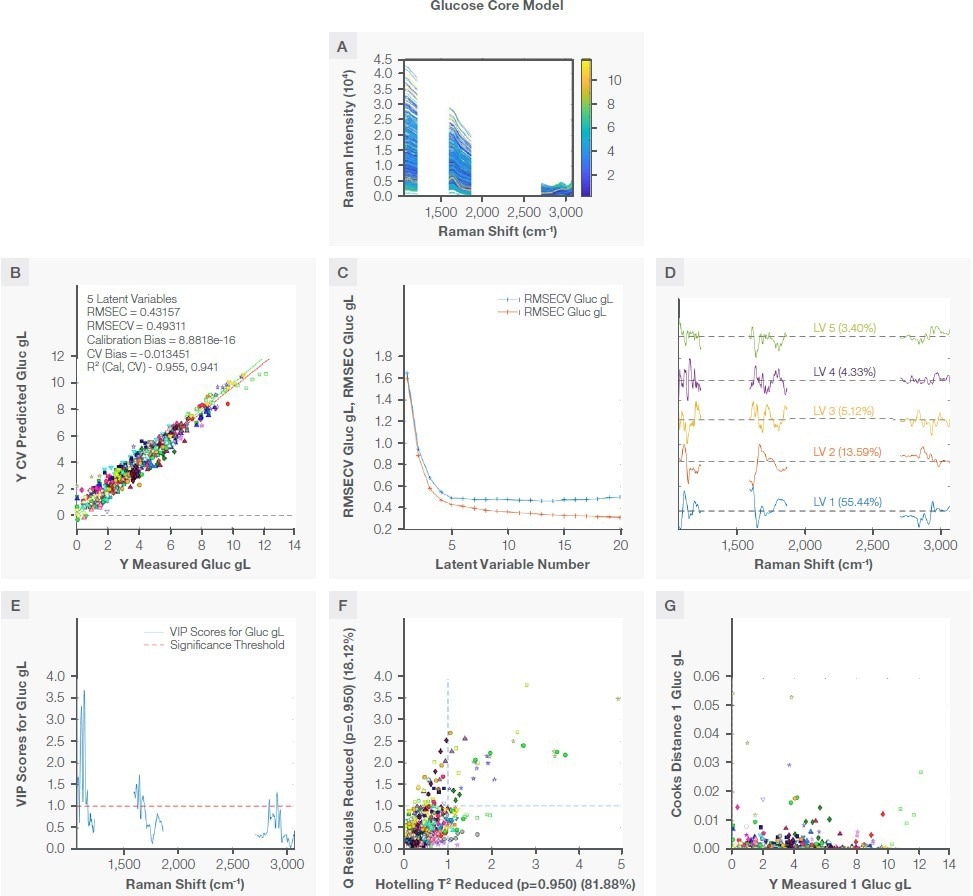
Figure 4. Glucose model. Plot A shows the region used to develop the model, plot B is the correlation plot between the measured and the prediction during cross validation, plot C shows RMSEC and RMSECV vs number of latent variables, plot D shows loading with percent variance captured, plot E shows VIP scores, plot F shows the reduced Q residual vs reduced Hotelling T2 plot, and plot G is the Crook distance for all training samples. Image Credit: Thermo Fisher Scientific – Portable and Handheld Raman Spectroscopy
Lactate “Core” model
The lactate core model was created using the same method previously described for the glucose core model. Figure 5 indicates the characteristic Raman peak for lactate at ~860 cm-1 in water and in the bioreactor following the application of the Sav-Gol filter (second derivative, order=2, window width=13).
To offer specificity toward lactate, the model was created with a single spectral region (800 to 1750 cm-1) that contained the characteristic Raman peak for lactate and water band for normalization, as seen in Figure 6A.
The lactate model was created with five latent variables (Figure 6B). The selection of five latent variables was arrived at due to the result of the predicted residual error sum of squares (PRESS) against the number of latent variables, as seen in Figure 6C. There was not a notable improvement in RMSECV following five latent variables, resulting in the five latent variables PLS model being chosen as optimal. The loadings for the model are seen in Figure 6D. Table 4 summarizes the model statistics.
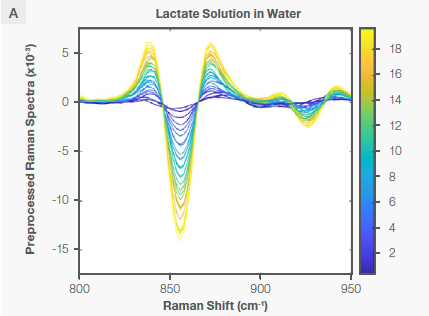
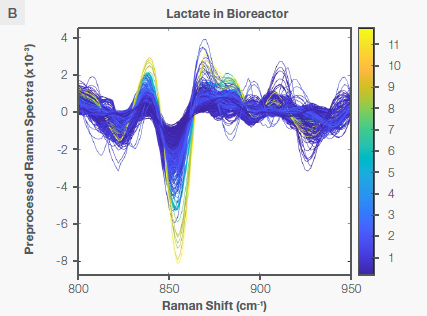
Figure 5. Characteristic Raman peaks of lactate at ~860 cm-1 in aqueous solution (plot A) and bioreactor (plot B) as second derivative (negative peaks) spectra. The spectra are color-coded by the concentration shown as the vertical bar. Image Credit: Thermo Fisher Scientific – Portable and Handheld Raman Spectroscopy
Table 4. Source: Thermo Fisher Scientific – Portable and Handheld Raman Spectroscopy
| Lactate Core Model Parameters |
Statistics |
| Model Range |
0-12 g/L |
| Number of Latent Variables |
5 |
| RMSEC |
0.23 g/L |
| RMSECV |
0.31 g/L |
| R² CV |
0.92 |
| CV Bias |
-0.0174 g/L |
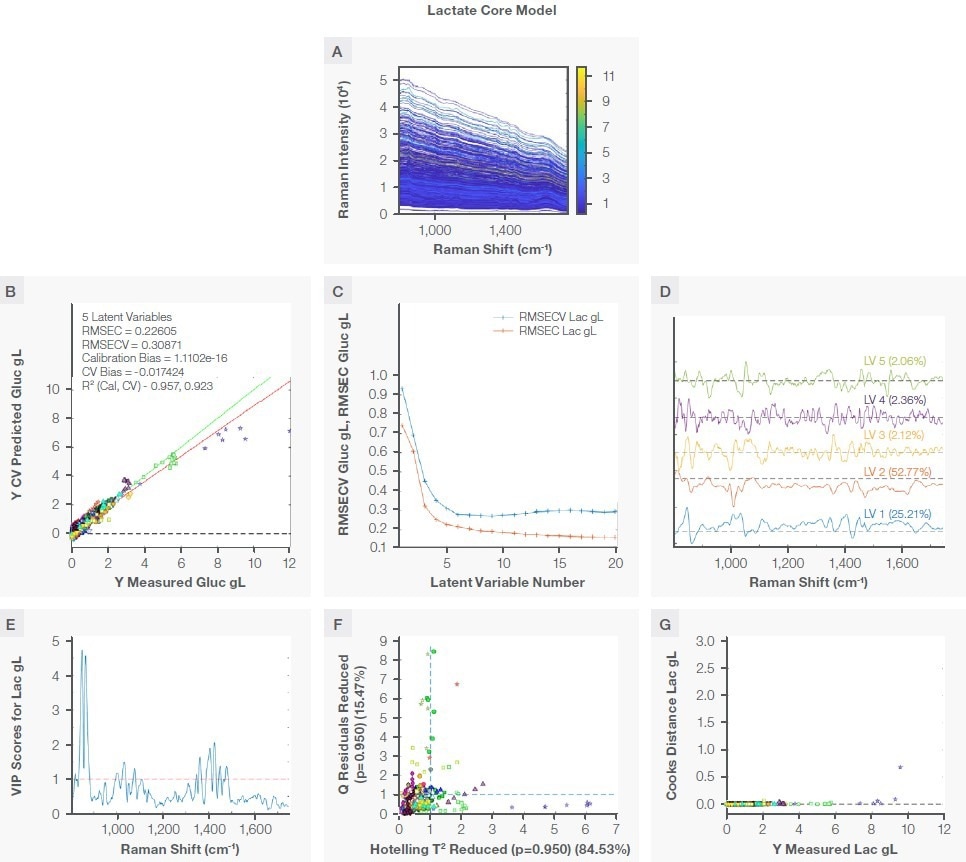
Figure 6. Lactate model. Plot A shows the region used to develop the model, plot B is the correlation plot between the measured and the prediction during cross validation, plot C shows RMSEC and RMSECV vs. number of latent variables, plot D shows loading with percent variance captured, plot E shows VIP scores, plot F shows the reduced Q residual vs. reduced Hotelling T2 plot, and plot G is the Crook distance for all training samples. Image Credit: Thermo Fisher Scientific – Portable and Handheld Raman Spectroscopy
Performance of lactate and glucose “Core” model
The performance of lactate and glucose core models mentioned in this note was investigated on five unique cell lines/media, various scales of bioreactors, and automated feedback control.9,10
The average root mean square of prediction (RMSEP) for glucose was ~0.5 g/L, whereas the average RMSEP for lactate was ~0.2 g/L. The low RMSEP for CHO and HEK cell lines in different cell media highlights the accuracy of the model, its reliability, and its transferability over a range of scales and processes.
Conclusion
The reliable, accurate, and transferable lactate and glucose Raman “core” models were created for bioreactor monitoring and control. These models allow clients to save important time, costs, and resources that may be needed to develop chemometric models.
With these models being available, users can immediately begin automated glucose feeding in their bioreactor while reaping the benefits of the advantages provided by Raman spectroscopy as an in-line PAT solution. These benefits include enhancing and regulating the process, minimizing variations batch-to-batch, and guaranteeing consistent product quality and quantity.
References
- Bioreactors: Design, Operation and Novel Applications | Wiley. Wiley.com.
- Zhong, J.-J. Recent Advances in Bioreactor Engineering. Korean J. Chem. Eng. 2010, 27 (4), 1035–1041. https://doi.org/10.1007/s11814-010-0277-5.
- Research, C. for D. E. and. PAT — A Framework for Innovative Pharmaceutical Development, Manufacturing, and Quality Assurance. https://www.fda.gov/regulatory-information/search-fda-guidance-documents/pat-framework-innovative-pharmaceutical-development-manufacturing-and-quality-assurance (accessed 2024-06-19).
- Buckley, K.; Ryder, A. G. Applications of Raman Spectroscopy in Biopharmaceutical Manufacturing: A Short Review. Appl. Spectrosc. 2017, 71 (6), 1085–1116. https://doi.org/10.1177/0003702817703270.
- Esmonde-White, K. A.; Cuellar, M.; Lewis, I. R. The Role of Raman Spectroscopy in Biopharmaceuticals from Development to Manufacturing. Anal. Bioanal. Chem. 2022, 414 (2), 969–991. https://doi.org/10.1007/s00216-021-03727-4.
- Webster, T. A.; Hadley, B. C.; Dickson, M.; Hodgkins, J.; Olin, M.; Wolnick, N.;Armstrong, J.; Mason, C.; Downey, B. Automated Raman Feed-Back Control of Multiple Supplemental Feeds to Enable an Intensified High Inoculation Density Fed-Batch Platform Process. Bioprocess Biosyst. Eng. 2023, 46 (10), 1457–1470. https://doi.org/10.1007/s00449-023-02912-2.
- Guo, S.; Popp, J.; Bocklitz, T. Chemometric Analysis in Raman Spectroscopy from Experimental Design to Machine Learning–Based Modeling. Nat. Protoc. 2021, 16 (12), 5426–5459. https://doi.org/10.1038/s41596-021-00620-3.
- Bellon-Maurel, V.; Fernandez-Ahumada, E.; Palagos, B.; Roger, J.-M.; McBratney, A. Critical Review of Chemometric Indicators Commonly Used for Assessing the Quality of the Prediction of Soil Attributes by NIR Spectroscopy. TrAC Trends Anal. Chem. 2010, 29 (9), 1073–1081. https://doi.org/10.1016/j.trac.2010.05.006.
- Villa, J.; Zustiak, M.; Kuntz, D.; Zhang, L.; Khadka, N.; Broadbelt, K.; Woods, S. Use of Lykos and TruBio Software Programs for Automated Feedback Control to Monitor and Maintain Glucose Concentrations in Real Time.
- Villa, J.; Zustiak, M.; Ramirez, D.; Kruger, J.; Kuntz, D.; Zhang, L.; Khadka, N.; Broadbelt, K.; Woods, S. Demonstrating Chemometric Model Transferability for 5 Mammalian Cell Lines and 5 Media Types Using the Thermo Scientific MarqMetrix All-In-One Process Raman Analyzer to Monitor Upstream Bioprocesses
About Thermo Fisher Scientific – Portable and Handheld Raman Spectroscopy
Thermo Fisher Scientific offers innovative solutions that help our customers solve complex analytical challenges, accelerate life sciences manufacturing, deliver medicines to market, and increase laboratory productivity. Our Thermo Scientific portable and handheld process Raman analyzers enable accurate, real-time results for process monitoring.
Our Thermo Scientific™ MarqMetrix™ All-In-One Process Raman Analyzer is an all-in-one system purpose-built for rapid deployment, ease of use, and scalability in markets where time-to-results is critical. The Ramina Process Analyzer is designed for:
- Analysis without sample preparation, delivering Raman spectral results in real-time
- Easy setup and deployment by non–Raman spectroscopists
- Non-destructive workflows to protect precious samples
- Non-invasive handling to minimize contamination of samples
- Small footprint for convenient deployment
- Factory calibration for hardware stability and portability
Our Thermo Scientific TruScan G3 Handheld Raman Analyzer includes state-of-the-art optics paired with a patented multivariate residual analysis that offers an effective chemometric solution for material identification, with two spectral pre-processing options. The analyzer’s non-destructive point-and-shoot sampling principle facilitates rapid verification of a broad range of chemical compounds, including cellulose-based products.
The Thermo Scientific TruScan G3 Handheld Raman Analyzer takes pharmaceutical manufacturing QA/QC to the next level with:
- Enhanced 21 CFR Part 11 and cGMP compliance with biometric login, complex password options, and full audit trail features
- Non-contact analysis through plastic bags, glass containers, blister packs and clear gel caps
- Intuitive workflow adapted to production environment through PDF batch reports and ease of data input using barcode scanners
- Easy fleet management feature that enables cloning of instruments and identification methods
Sponsored Content Policy: News-Medical.net publishes articles and related content that may be derived from sources where we have existing commercial relationships, provided such content adds value to the core editorial ethos of News-Medical.Net which is to educate and inform site visitors interested in medical research, science, medical devices and treatments.