Process development teams have started using real-time monitoring of intricate parameters during manufacturing processes to better comprehend and manage mammalian cell cultivations in the biopharmaceutical sector.
In terms of strategy, the procedure is more effective than earlier workflows. It has been determined with confidence that Raman Spectroscopy is a tool that can be applied for in-line, real-time monitoring of biopharmaceutical production processes.
This technical note explains how to integrate two benchtop 5 L bioreactors with the Thermo Scientific™ MarqMetrix™ All-In-One Process Raman Analyzer System to perform in-line measurements of TCD, VCD, and the concentrations of glucose and lactate.
An accurate prediction model for several significant metabolites was created using spectral data from the MarqMetrix All-In-One Process Raman Analyzer, demonstrating a high correlation with independent data obtained from an at-line instrument.
Background
The biopharmaceutical industry is currently showing much interest in implementing Process Analytical Technology (PAT) tools in biopharmaceutical manufacturing to enable rapid development and access to therapeutics and existing medications without compromising high quality.1,2
Real-time monitoring of crucial process parameters has decreased development times, opened access to novel chemistries impractical for batch processing, increased safety, and improved product quality assurance.3,4
Since frequent sample analysis is necessary to determine the amount of cell feed (glucose), cell culture processes require a lot of labor. Nutrients are periodically added to bioreactors running in fed-batch mode using a bolus-feeding strategy and predetermined volumes of concentrated nutrients. These volumes are subsequently obtained from off-line concentration analyses.
This typically leads to significant fluctuations in glucose levels over a broad range. Due to the potential for greater nutrient depletion or accumulation (waste), this is not ideal for the cells.
Due to abnormal glycosylation, increased glucose levels also impact titer product quality.6 Inefficient feeding methods can result in an abundance of secondary metabolites that reduce cell viability and product yield.
In contrast to traditional monitoring systems, which require manual sampling and offline analysis5, using an immersed Raman optical sensor that provides real-time process information about the critical process parameters (CPPs) is highly advantageous.
Increased data acquisition frequency enables quick correction of any process parameter deviations, and reduced offline sampling lowers the risk of contamination, among other noted benefits.
Some spectroscopic tools have been linked to the FDA’s proposed PAT initiative, which aims to enhance pharmaceutical processes and their products. Raman spectroscopy, a laser-based technique for creating a chemical fingerprint of a sample, is one of these tools.7
Raman spectroscopy analysis has attracted attention in bioprocess monitoring due to its capacity to measure various variables in situ, without causing any damage, and with little interference from water. Nutrient feed, metabolites, growth profiles, product levels, and product quality attributes are some of these variables.1,2
To interpret spectral peaks related to the measured process parameters and attributes, the Raman spectral data is combined with chemometric modeling.
The ability to simultaneously predict multiple components (such as lactate, glutamine, glutamate, viable cell density [VCD], and total cell density [TCD]) in cell cultivation is made possible by the MarqMetrix All-In-One Process Raman Analyzer.
This enables quick decision-making. It is a small, portable analyzer that is simple to set up, gets a lot of process data in real-time, and is easy to use for people who are not experts in Raman.
Materials and methods
Cell culture and feeding strategy
For the bioreactor culture experiment, a Thermo Scientific™ ExpiCHO™ clone that expresses a biosimilar substitute for Rituximab was used. Chemical definitions were applied to all used media.
Each bioreactor was inoculated with 0.6 × 10⁶ cells/mL, T = 36.6 °C, pH = 7.0 +/−0.3, DO = 40%, in a working volume of roughly 2.6 L of cell culture medium (ExpiCHO SPM). By gassing CO2 and adding sodium carbonate as needed, the pH level was maintained.
The cells were grown for 14 days in a medium designed for mammalian cells in duplicate, standard fed-batch bioreactors using a platform process (SPM for the basal medium, Efficient feed C+ as the feed) created by Thermo Fisher Scientific.
Starting on day three, the cultures were fed 3% weight/volume in the form of bolus feed and glucose ranging from less than 4 g/L (preEFC feed) to 6 g/L (final).
To shield them from stray light, the bioreactors were covered in aluminum foil. A bioreactor ball probe with TouchRaman immersion technology was inserted into the cell culture media and connected to each bioreactor’s MarqMetrix All-In-One Process Raman Analyzer system for in-line real-time measurements.
All cultivations underwent manual offline measurements to assess cell growth (VCD, and viability), pH, DO, glucose, and lactate levels.
MarqMetrix All-In-One Analyzer Measurements
Thermo Scientific’s MarqMetrix All-In-One Process Raman Analyzer was used to measure, and each bioreactor was directly probed with the optical probe (Bioreactor BallProbe with TouchRaman immersion technology) of the analyzer (Figure 1).
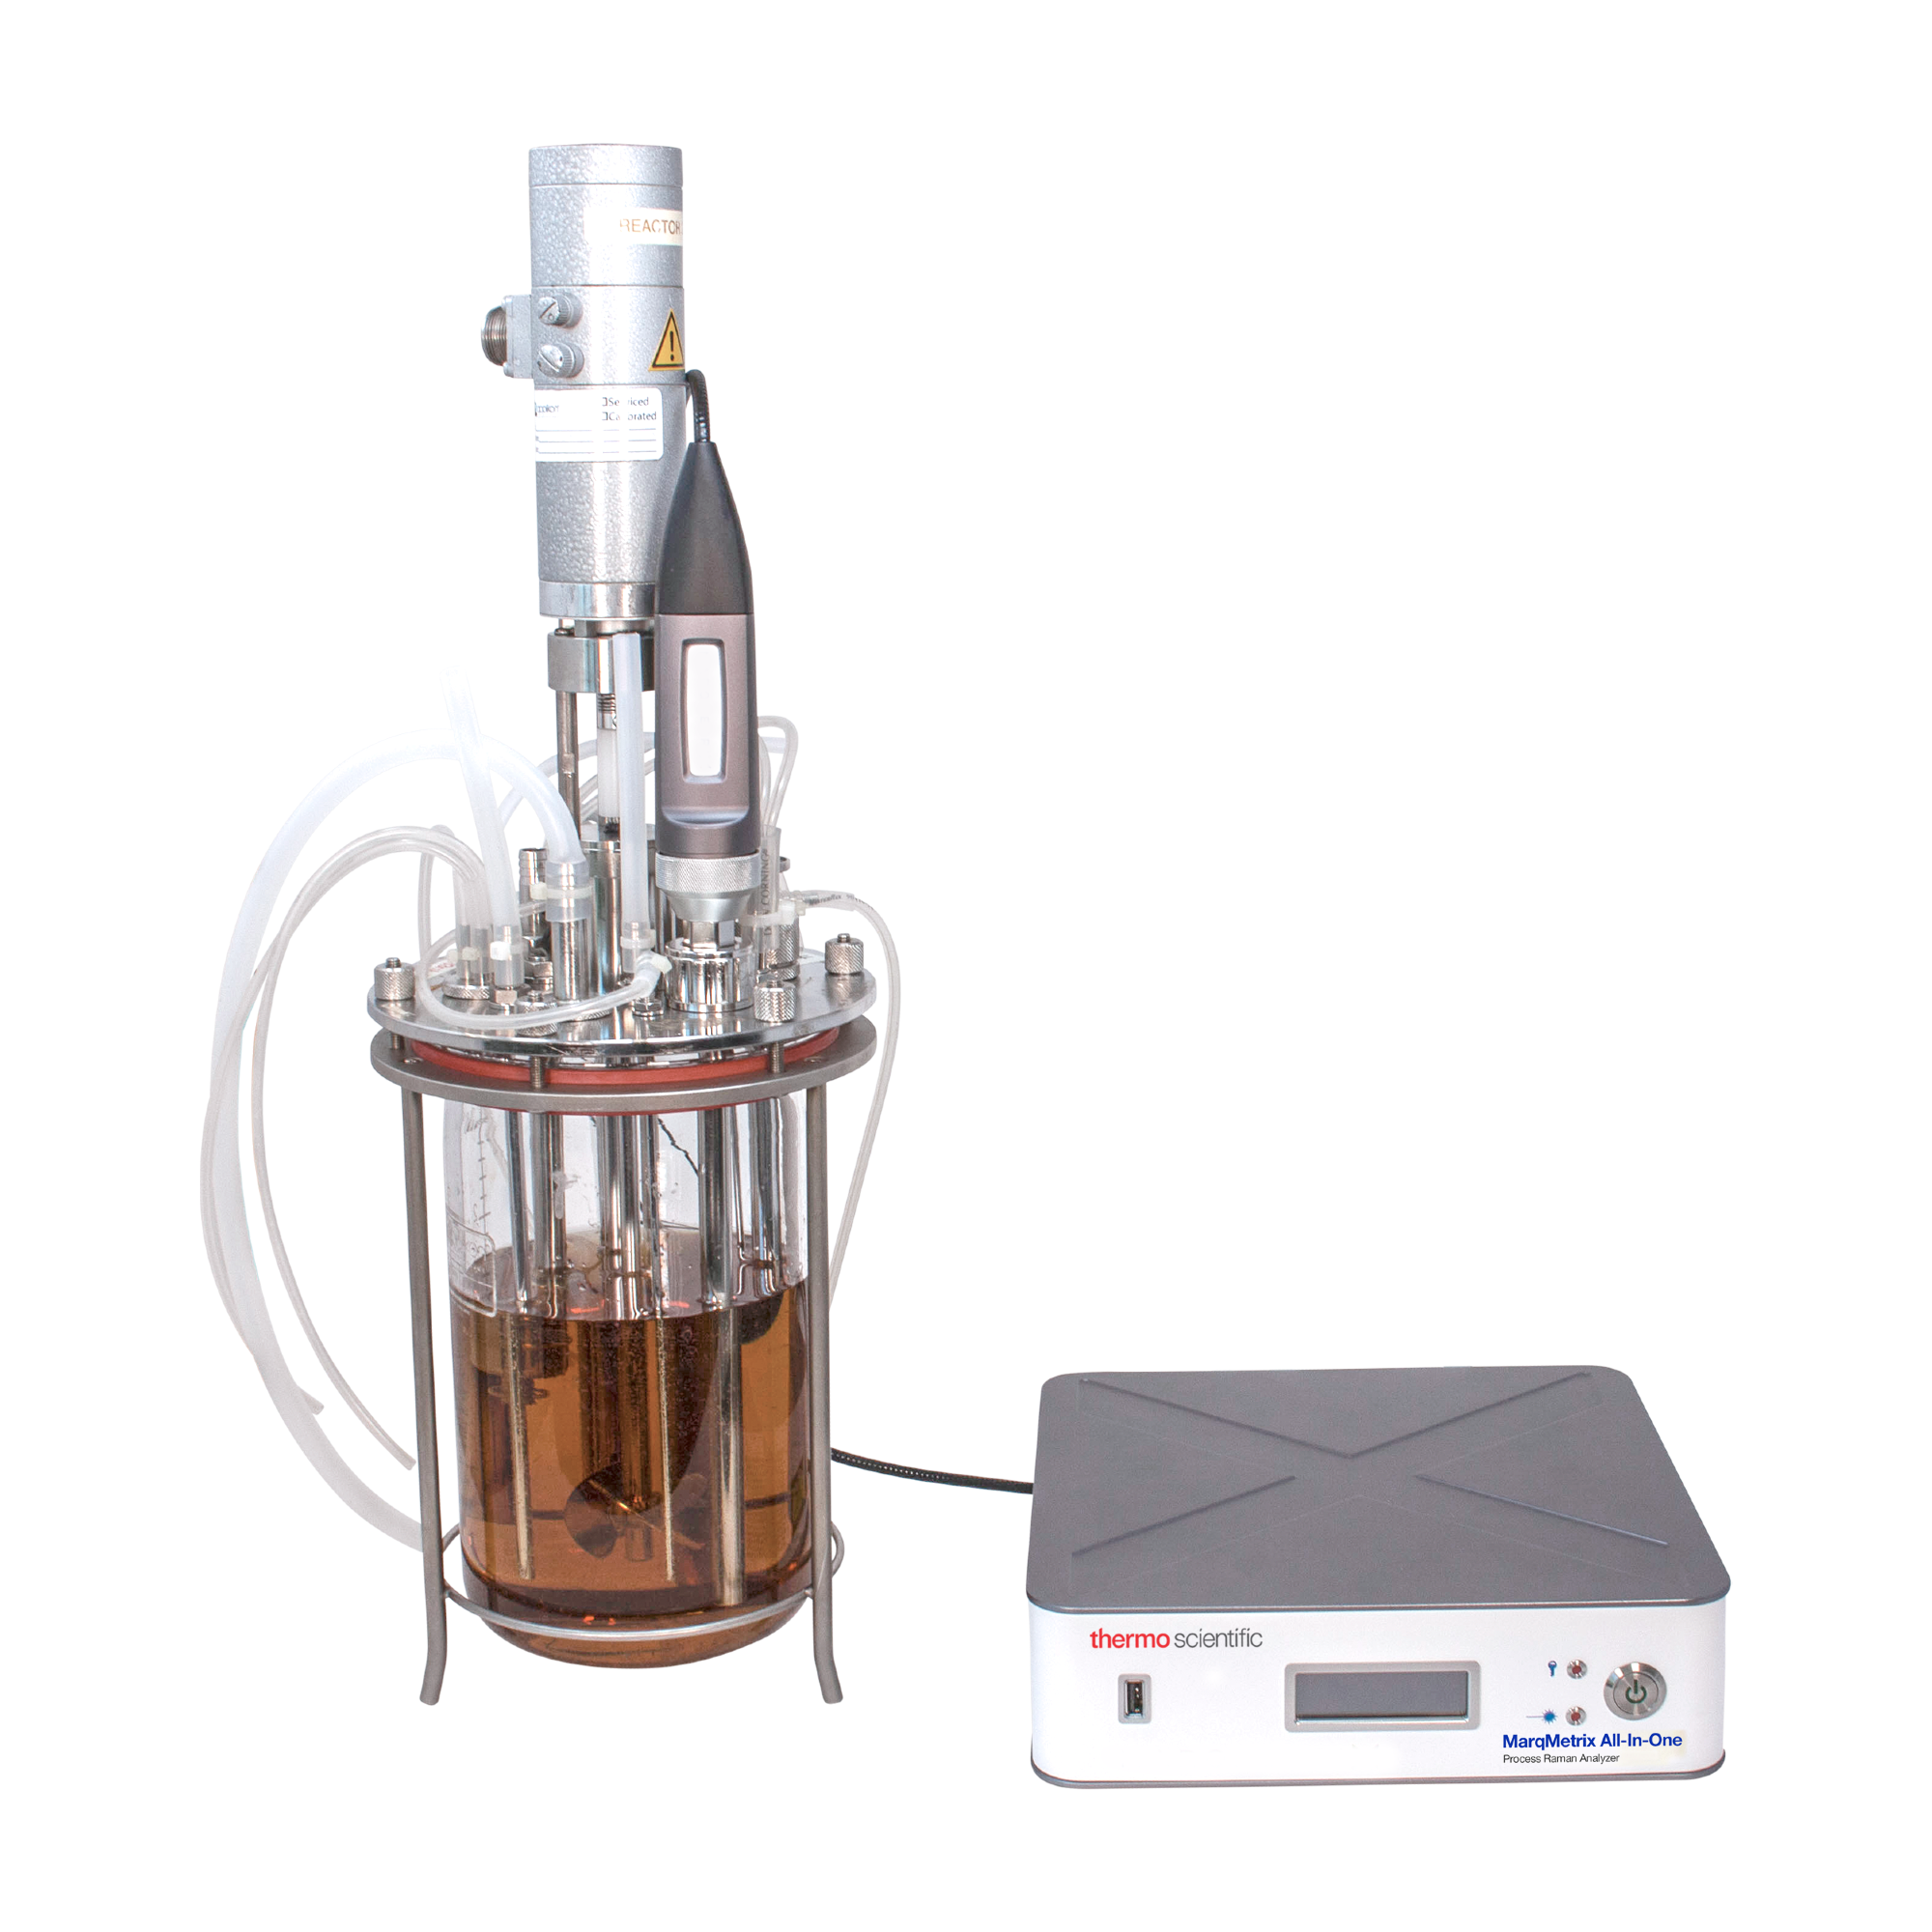
Figure 1. The MarqMetrix All-In-One Process Raman Analyzer with optical probe immersed into the bioreactor. Image Credit: Thermo Fisher Scientific.
Every Raman spectrum was produced using an average of 20 measurements, a 3-second integration/exposure time, and a 450-mW power setting. The total acquisition time for each spectrum was 2 minutes, and the offline instrument and MarqMetrix All-In-One Process Raman Analyzer timestamps were matched to create the model.
Chemometrics, model building
To create each chemometric model, raw spectral data was reviewed, cosmic rays were subtracted, and the training set data was gathered from 45 samples per bioreactor. The spectra were preprocessed to remove the baseline and increase signal-to-noise after the spectral region of interest was chosen.
The Savitzky Golay filter with derivatives, Automatic Whitaker Smoothing, Extended Multiplicative Scatter Correction, SNV, and mean centering were just a few of the pre-processing methods tested. The most effective pre-processing methods changed depending on the modeled property of interest.
For each property of interest, partial least squares (PLS) models were made, and cross-validation was used to optimize each model’s parameters. The properties of glucose, lactate, glutamine, glutamate, TCD, VCD, and other typical bioreactor byproducts were of interest.
Results
In this study, a fed-batch CHO cell culture process was examined using in-line Raman spectroscopy. The offline reference data for lactate and glucose were correlated with the in-line spectral data.
Building a chemometric model using a calibration dataset is necessary before using Raman spectroscopy to monitor process parameters. Daily samples were taken and analyzed to compare the MarqMetrix All-In-One Process Raman Analyzer measurements’ accuracy to conventional offline sampling techniques.
For each parameter, the root mean square error of calibration (RMSEC), root mean square error of cross validation (RMSECV), and root mean square error of prediction (RMSEP) were calculated.
The model’s error was averaged based on its predictions to determine the RMSECV, which is used to build the model while the RMSEP is used to test the model using “new” data that it has never seen before.
Each PLS model’s R2 coefficient of variation was noted. The value is used to calculate the percentage of the Y variable’s variation that the model predictors (X variables) can account for. The data show a correlation between offline data and model predictions, and Table 1 shows that the combined model data also show highly correlated predictive data for a variety of metabolites.
Source: Thermo Fisher Scientific
| Metabolite Predicted |
R2 Bioreactor 1 |
R2 Bioreactor 2 |
Bioreactor 1 |
Bioreactor 2 |
| RMSEC |
RMSECV |
RMSEP |
RMSEC |
RMSECV |
RMSEP |
| Viability (%) |
0.9 |
0.9 |
2.92 |
3.12 |
2.50 |
2.92 |
3.12 |
2.95 |
| TCD (106 TC/mL) |
0.97 |
0.94 |
2.63 |
3.45 |
1.77 |
2.63 |
3.45 |
2.96 |
| VCD (106 VC/mL) |
0.97 |
0.92 |
2.83 |
3.59 |
1.80 |
2.83 |
3.59 |
3.26 |
| TCD (106 TC/mL) |
0.9 |
0.9 |
1.83 |
2.11 |
1.72 |
1.83 |
2.11 |
1.83 |
| VCD (106 VC/mL) |
0.9 |
0.9 |
1.73 |
2.43 |
1.62 |
1.73 |
2.43 |
1.72 |
| Viability (%) |
0.94 |
0.96 |
2.55 |
3.48 |
2.17 |
2.55 |
3.48 |
2.74 |
| Diameter (µm) |
0.91 |
0.91 |
0.41 |
0.47 |
0.41 |
0.41 |
0.47 |
0.39 |
| Gln (mmol/L) |
0.96 |
0.98 |
0.23 |
0.28 |
0.25 |
0.23 |
0.28 |
0.20 |
| Glu (mmol/L) |
0.97 |
0.97 |
0.38 |
0.4 |
0.40 |
0.38 |
0.4 |
0.33 |
| Gluc (g/L) |
0.97 |
0.97 |
0.42 |
0.64 |
0.38 |
0.42 |
0.64 |
0.43 |
| Lac (g/L) |
0.93 |
0.93 |
0.16 |
0.2 |
0.16 |
0.16 |
0.2 |
0.16 |
| NH4+ (mmol/L) |
0.95 |
0.89 |
1.04 |
1.27 |
0.79 |
1.04 |
1.27 |
1.20 |
| Na+ (mmol/L) |
0.97 |
0.96 |
2.72 |
2.84 |
2.50 |
2.72 |
2.84 |
2.78 |
| K+ (mmol/L) |
0.98 |
0.96 |
0.31 |
0.35 |
0.25 |
0.31 |
0.35 |
0.34 |
| pCO2 (mmHg) |
0.92 |
0.92 |
4.1 |
5.16 |
4.06 |
4.1 |
5.16 |
3.89 |
| Osm (mOsm/kg) |
0.98 |
0.96 |
8.41 |
9.08 |
7.03 |
8.41 |
9.08 |
9.03 |
| Titer |
0.96 |
0.95 |
0.34 |
0.35 |
0.31 |
0.34 |
0.35 |
0.34 |
In addition to cell viability and cell titer, Figures 2 and 3 display plots of the Raman Model vs. offline analysis of metabolites that demonstrate an excellent correlation between measured and predicted metabolic concentration.
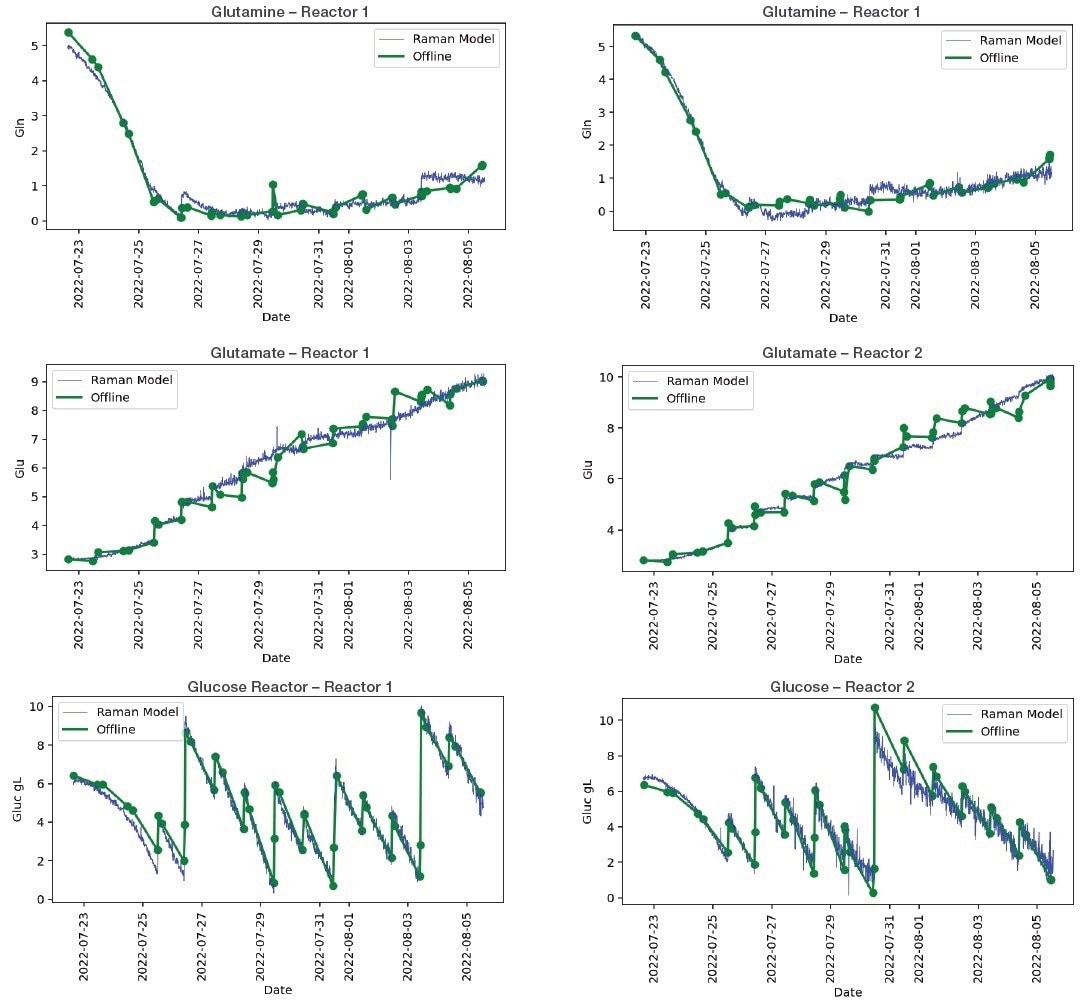
Figure 2. Bioreactor model plots, selected plots of Raman model vs off-line analysis for metabolites. Image Credit: Thermo Fisher Scientific.
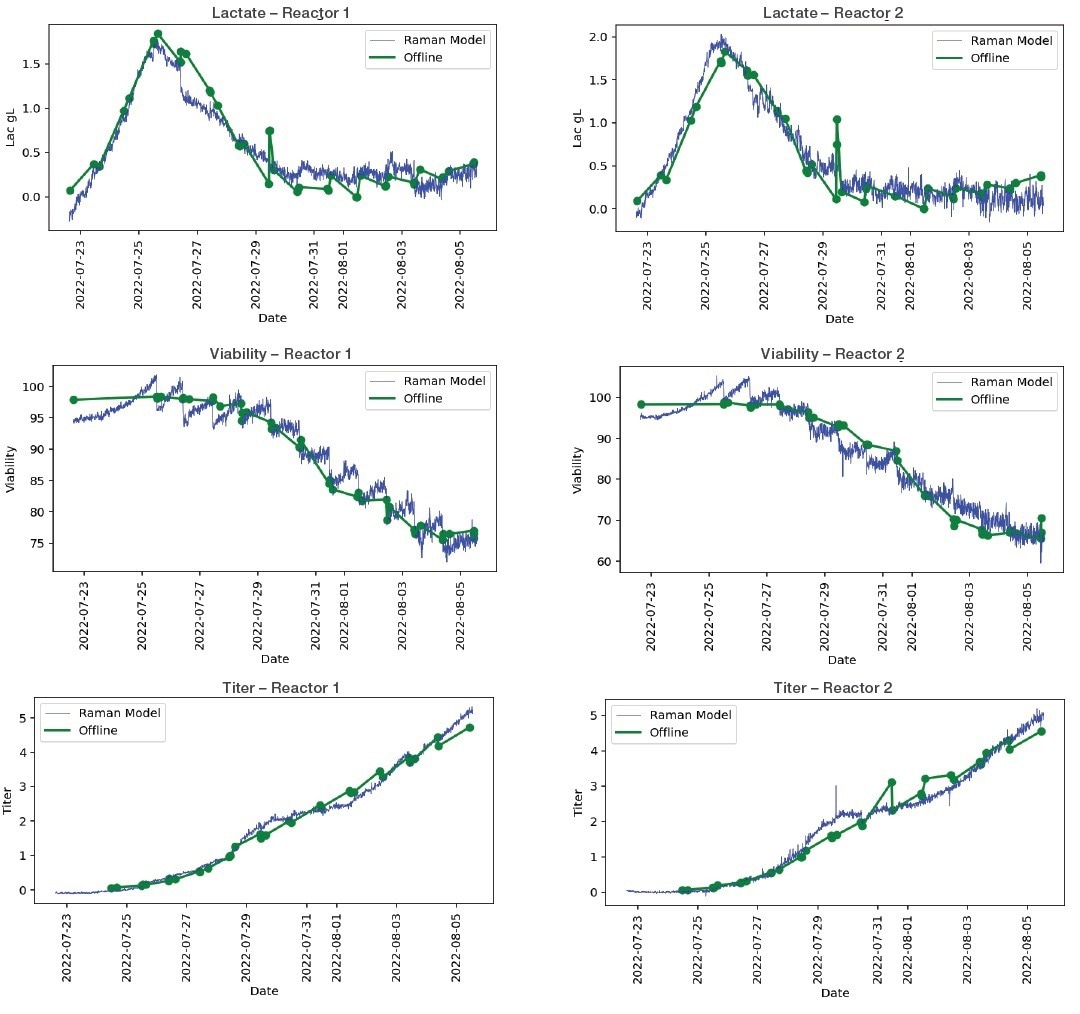
Figure 3. Bioreactor model plots, selected plots of Raman model vs off-line analysis for metabolites. Image Credit: Thermo Fisher Scientific
Conclusions
The critical process parameters glucose, glutamine, glutamate, and lactate as well as the total and viable cell densities were all measured inline, in real-time, by the MarqMetrix All-In-One Process Raman Analyzer in two bench-scale bioreactors.
The MarqMetrix All-In-One Process Raman Analyzer data obtained from Thermo Scientific and the offline data for many metabolites and CPPs showed excellent agreement in the correlation analysis (Table 1).
It is particularly interesting to measure metabolites and product titers simultaneously because this will improve process control over cultivation and purification parameters during continuous biomanufacturing processes.
The ability of process Raman spectroscopy as a Process Analytical Technology (PAT) tool for in-line monitoring of a variety of key metabolites in bioreactor systems is demonstrated in this study.
References
- Real time monitoring of multiple parameters in mammalian cell culture bioreactors using an in-line Raman spectroscopy probe. Nicholas R Abu-Absi1, Brian M Kenty, Maryann Ehly Cuellar, Michael C Borys, Sivakesava Sakhamuri, David J. Strachan, Michael C Hausladen, Zheng Jian Li. Biotechnol Bioeng. 2011 May;108(5):1215-21. doi: 10.1002/bit.23023.Epub 2010 Dec 22
- Quick generation of Raman spectroscopy based in-process glucose control to influence biopharmaceutical protein product quality during mammalian cell culture. Brandon N Berry, Terrence M Dobrowsky, Rebecca C Timson, Rashmi Kshirsagar, Thomas Ryll, Kelly Wiltberger Biotechnol Prog 2016 Jan-Feb;32(1):224-34. doi: 10.1002/btpr.2205. Epub 2015 Dec 21
- Raman spectroscopy as a method to replace off-line pH during mammalian cell culture processes. Carl Rafferty, Jim O’Mahony, Barbara Burgoyne, Rosemary Rea, Karin M Balss, David C Latshaw 2nd. Biotechnol Bioeng 2020 Jan;117(1):146-156. doi: 10.1002/bit.27197. Epub 2019 Nov 12
- Raman-based dynamic feeding strategies using real-time glucose concentration monitoring system during adalimumab producing CHO cell cultivation. Júlia Domján, Annamária Fricska, Lajos Madarász, Martin Gyürkés, Ákos Köte, Attila Farkas, Panna Vass, Csaba Fehér, Balázs Horváth, Kálmán Könczöl, Hajnalka Pataki, Zsombor Kristóf Nagy, György János Marosi, Edit Hirsch1 Biotechnol Prog. 2020 Nov;36(6): e3052. doi: 10.1002/btpr.3052. Epub 2020 Jul 31
- A Novel Approach for Non-Invasive Continuous InLine Control of Perfusion Cell Cultivations by Raman Spectroscopy. A Graf, J Lemke , M Schulze, R Soeldner, K Rebner, M Hoehse, J Matuszczyk Front Bioeng Biotechnol. 2022 Apr 25; 10:719614. doi: 10.3389/fbioe.2022.719614. eCollection 2022
- Fed-batch cultivation of animal cells using different medium design concepts and feeding strategies. L Xie1, D I Wang. Biotechnol Bioeng. 1994 May;43(11):1175-89. doi: 10.1002/bit.260431123
- Using Raman spectroscopy to characterize biological materials. Butler HJ, Ashton L, Bird B, Cinque G, Curtis K, Dorney J, Esmonde-White K, Fullwood NJ, Gardner B, Martin-Hirsch PL, Walsh MJ, McAinsh MR, Stone N, Martin FL. Nat Protoc. 2016 Apr;11(4):664-87. doi: 10.1038/nprot.2016.036. Epub 2016 Mar 10
About Thermo Fisher Scientific – Materials and Structural Analysis
Thermo Fisher Materials and Structural Analysis products give you outstanding capabilities in materials science research and development. Driving innovation and productivity, our portfolio of scientific instruments enable the design, characterization and lab-to-production scale of materials used throughout industry.
X-ray fluorescence spectrometers, FTIR spectrometers and X-ray photoelectron spectrometers enable researchers and material analysts to probe the chemical composition of materials ranging from ultra thin-films to bulk powders used in product development and materials troubleshooting. We offer a line of rheometry and viscometry instruments, as well as single- and twin-screw extruders, for laboratory benches that enable you to measure the physical property of semi-solids and liquids for shear flow and yield stress.
No other company offers the breadth of products and the depth of analytical capabilities for materials science and engineering.
Sponsored Content Policy: News-Medical.net publishes articles and related content that may be derived from sources where we have existing commercial relationships, provided such content adds value to the core editorial ethos of News-Medical.Net which is to educate and inform site visitors interested in medical research, science, medical devices and treatments.